|
Simply Economics will be taking off next week to celebrate
Thanksgiving. Simply Economics will return on December 5, 2014.
Happy Thanksgiving from all of us at Econoday!
Equities trended upward on generally favorable news on earnings and economic indicators. The U.S. economy is looking good compared to most of the global economy.
 U.S. stocks were mixed Monday. Merger activity in the energy and healthcare sectors offset concerns about overseas growth after Japan's economy slipped into recession. Tuesday, stocks rose, boosting key indexes to all-time highs, as health-care and raw-material companies rallied on belief that U.S. growth is strong enough to offset a global slowdown. U.S. stocks were mixed Monday. Merger activity in the energy and healthcare sectors offset concerns about overseas growth after Japan's economy slipped into recession. Tuesday, stocks rose, boosting key indexes to all-time highs, as health-care and raw-material companies rallied on belief that U.S. growth is strong enough to offset a global slowdown.
 Wednesday, equities eased after release of Fed minutes which pointed to concern about low inflation—possibly indicating soft demand. Thursday, much better-than-expected economic data lifted equities. The Philadelphia Fed manufacturing survey in the mid-Atlantic region grew at its fastest pace since December 1993. Jobless claims declined 2,000 to 291,000 in the week ended November 15. Claims have stayed below 300,000 for 10 weeks in a row. Wednesday, equities eased after release of Fed minutes which pointed to concern about low inflation—possibly indicating soft demand. Thursday, much better-than-expected economic data lifted equities. The Philadelphia Fed manufacturing survey in the mid-Atlantic region grew at its fastest pace since December 1993. Jobless claims declined 2,000 to 291,000 in the week ended November 15. Claims have stayed below 300,000 for 10 weeks in a row.
Stocks were boosted Friday by foreign central banks—comments and rate moves. European Central Bank President Mario Draghi said he will do what is necessary to increase inflation in the region. China cut its benchmark interest rates for the first time since July 2012.
Equities mostly were up this past week. The Dow was up 1.0 percent; the S&P 500, up 1.2 percent; the Nasdaq, up 0.5 percent; and the Wilshire 5000, up 1.1 percent. The Russell 2000 slipped 0.1 percent.
For the year-to-date, major indexes are up as follows: the Dow, up 7.4 percent; the S&P 500, up 11.6 percent; the Nasdaq, up 12.8 percent; the Russell 2000, up 0.8 percent; and the Wilshire 5000, up 10.1 percent.
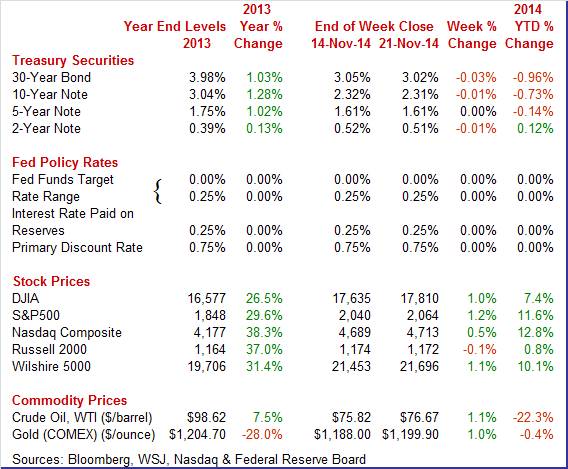
Weekly percent change column reflects percent changes for all components except interest rates. Interest rate changes are reflected in simple differences.
 Treasury yields essentially were nearly unchanged this past week. The biggest daily swing (though not much) was Wednesday after Fed minutes indicated a continuation to higher rates although likely not until mid-2015. Treasury yields essentially were nearly unchanged this past week. The biggest daily swing (though not much) was Wednesday after Fed minutes indicated a continuation to higher rates although likely not until mid-2015.
Rates eased very marginally Thursday on the view that inflation expectations would remain low. On Friday, rates slipped on comments by European Central Bank President Mario Draghi said officials would expand debt purchases if the inflation outlook weakens. The People's Bank of China cut its one-year lending rate by 0.4 percentage point to 5.6 percent, while the one-year deposit rate was reduced by 0.25 percentage point to 2.75 percent.
For this past week Treasury rates were down marginally as follows: 3-month T-bill, down 1 basis point; the 2-year note, down 1 basis point; the 10-year note, down 1 basis point; and the 30-year bond, down 3 basis points. The 5-year note and the 7-year note were unchanged.
 Spot West Texas Intermediate ended the week almost unchanged with only modest daily swings in price. Spot West Texas Intermediate ended the week almost unchanged with only modest daily swings in price.
After almost no change Monday, WTI dipped a dollar Tuesday on news that Japan had slid into recession. After pennies change on Wednesday, WTI gained somewhat over a dollar a barrel on Thursday on belief that OPEC this week might make reductions in production quotas. On Friday, crude rose about a dollar a barrel after the rate cut announcement by the Peoples' Bank of China.
Net for the week, the spot price for West Texas Intermediate nudged up 85 cents per barrel to settle at $76.67.
This week's big news was detail from Fed minutes. The recovery continues at a moderate pace.
The Fed is in transition. It is moving from quantitative easing to unwinding its balance sheet and starting to nudge up policy rates.
The latest Fed minutes are somewhat complex. Of course, quantitative easing ended. The key point currently is that the first rate increase is still data dependent. Some FOMC participants wanted to remove "considerable time" in the statement while others did not.
There was notable discussion of headwinds from Europe and Asia. This means that the Fed is not in a rush to raise rates but this not new news.
The Fed still sees the labor market as sluggish even though the unemployment rate has dipped. Notably the Fed sees inflation down in the near term but expects firming further out. The drop in gasoline prices is seen as boosting near-term consumer spending.
FOMC participants see risks to the economy as essentially balanced.
The Fed sees the U.S. economy as slowly improving but is somewhat concerned about low inflation. Rates are likely to rise in 2015 but the questions are when and how fast. Increases are almost certainly to be slow.
The December FOMC statement will add clarification to timing of policy changes with both the Fed forecasts and the chair press conference.
The latest report on industrial production emphasizes the point that detail is often more important than headline numbers.
 Industrial production for October slipped on comedowns in mining and utilities. Industrial production for October slipped on comedowns in mining and utilities.
Industrial production dipped 0.1 percent after jumping 0.8 percent in September.
Importantly, manufacturing gained 0.2 percent after rebounding 0.2 percent in September. Mining declined 0.9 percent in October, following a 1.6 percent boost the month before. Utilities slipped 0.7 percent after a monthly 4.2 percent surge in September.
The production of nondurable goods rose 0.3 percent and the production of durable goods edged up 0.1 percent. Among durable goods industries, machinery posted the largest increase, 1.3 percent, while wood products, computers and electronic products, and furniture and related products all recorded gains of more than 1/2 percent. These gains were partially offset by declines of more than 1 percent in the indexes for nonmetallic mineral products and for motor vehicles and parts. The decline in motor vehicles and parts resulted from a decrease in vehicle assemblies, which fell 400,000 units to an annual rate of 11.1 million. Production increased for most nondurable goods industries, with the largest advances recorded by chemicals and by plastics and rubber products; only the paper industry registered a decline.
Excluding motor vehicles, manufacturing rose 0.2 percent, following a gain of 0.3 percent in September.
Overall capacity utilization posted at 78.9 percent in October versus 79.2 percent in September.
The notable detail in the latest report is that manufacturing remains on a moderate uptrend despite headline weakness.
But more current manufacturing surveys are very mixed. And there is not a strong correlation between surveys and national production numbers.
Markit's sample reported slowing growth so far this month, to 54.7 from 55.9 in October and from 56.2 in the October flash. The 1.2 point decline was deceleration for this index which is now at its slowest rate since the heavy weather of January.
Main negatives included slowing in output and, not encouragingly, for new orders. Weakness in exports was especially noted with the strong dollar blamed. A positive was strength in employment. Price data show easing pressure for raw materials to the slowest rate of increase in 1-1/2 years.
The headline index for this report has been trending lower and is pointing to slowing for the fourth quarter.
 All of this past week's regional surveys showed overall improvement for November manufacturing—including for Empire State, Philly, and Kansas City. All of this past week's regional surveys showed overall improvement for November manufacturing—including for Empire State, Philly, and Kansas City.
Business has picked back up in the New York manufacturing sector this month based on the Empire State general conditions index which rose nearly 4 points to 10.16. The new orders index is the highlight of the report, rising to 9.14 from a brief dip into the negative column last month at minus 1.73. Shipments show a similar gain, to 11.83 from October's very flat plus 1.12. Employment growth is steady, at 8.51 vs 10.23, while the 6-month general conditions outlook rose nearly 6 points 47.61. The 6-month outlook for employment is a special positive, nearly doubling this month to 24.47.
 Spectacular strength was reported this month from the Mid-Atlantic manufacturing sector where the general business conditions surged to 40.8, almost doubling October's very strong growth of 20.7. The gain is backed by new orders which are at 35.7 versus October's 17.3. Shipments are at 31.9 vs 16.6 with employment nearly doubling, to 22.4 versus 12.1. November's numbers are total standouts for this report which goes back nearly 50 years. Spectacular strength was reported this month from the Mid-Atlantic manufacturing sector where the general business conditions surged to 40.8, almost doubling October's very strong growth of 20.7. The gain is backed by new orders which are at 35.7 versus October's 17.3. Shipments are at 31.9 vs 16.6 with employment nearly doubling, to 22.4 versus 12.1. November's numbers are total standouts for this report which goes back nearly 50 years.
And despite the surge in demand, price pressures, due to falling oil prices, are easing. Inventories look lean and delivery times are up, two other indications of general strength.
 Fed 10th District manufacturing activity expanded at a slightly faster pace in November, and producers' expectations for future activity increased further. Firms reported rising difficulties in attracting and retaining certain key workers, and several contacts cited increased labor costs. Price indexes were mixed with little change overall. Fed 10th District manufacturing activity expanded at a slightly faster pace in November, and producers' expectations for future activity increased further. Firms reported rising difficulties in attracting and retaining certain key workers, and several contacts cited increased labor costs. Price indexes were mixed with little change overall.
The month-over-month composite index was 7 in November, up from 4 in October and 6 in September.
The production index rose from 3 to 9, and the shipments, employment, and new orders for exports indexes also increased. The order backlog index moved into positive territory for the first time in four months, while the new orders index was basically unchanged. The finished goods inventory index jumped from minus 5 to 4, and the raw materials inventory index increased for the second straight month.
 Housing remains an uncertain sector as starts slipped in October while permits gained. Housing remains an uncertain sector as starts slipped in October while permits gained.
Housing starts numbers continue to oscillate. October weakness was in the multifamily component which swings sharply on a monthly basis. The single-family component may be gaining mild strength. Housing starts declined 2.8 percent after a 7.8 percent spike in September. The 1.009 million unit pace was up 7.8 percent on a year-ago basis. Market expectations were for 1.028 million units.
Multifamily starts swung sharply-dropping a monthly 15.4 percent in October, following a 14.9 percent surge the month before. Single-family starts gained 4.2 percent in both October and September.
 Housing permits, however, showed momentum with a 4.8 percent gain in October after a 2.8 percent boost the month before. The 1.080 million unit pace was up 1.2 percent on a year-ago basis. Analysts projected 1.035 million units. Housing permits, however, showed momentum with a 4.8 percent gain in October after a 2.8 percent boost the month before. The 1.080 million unit pace was up 1.2 percent on a year-ago basis. Analysts projected 1.035 million units.
Multifamily permits jumped 10.0 percent in October, following a 6.4 percent gain in September. Single-family permits rose somewhat with a 1.4 percent increase after a 0.6 percent rise in September.
Housing data are oscillating but with the housing market index showing improvement, this sector may be slowly building strength-emphasis on slowly. Also, winter data are coming and they have very large seasonal factors. And if there is an atypically cold winter, that will affect the numbers.
 Housing starts are struggling but existing home sales offer hope of modest improvement in the housing sector. Existing home sales continued to slowly rise in October, gaining 1.5 percent, following a 2.6 percent boost in September. On a year-ago basis sales posted at 2.5 percent. Housing starts are struggling but existing home sales offer hope of modest improvement in the housing sector. Existing home sales continued to slowly rise in October, gaining 1.5 percent, following a 2.6 percent boost in September. On a year-ago basis sales posted at 2.5 percent.
Supply declined 2.6 percent in October after a 2.1 percent drop in September. Months' supply slipped to 5.1 months from 5.3 months in September.
Yet demand appears to be soft as the median price eased 0.4 percent after a 4.3 percent drop in September. The year-ago price stood at up 5.5 percent in October.
Overall, the latest report suggests modest improvement in housing sales but with mixed numbers on supply and prices. Housing currently is not robust.
Inflation remains soft at both the producer and consumer levels.
 Producer price inflation was stronger than expected in October but on average remains sluggish. Headline inflation posted at a monthly 0.2 percent versus expectations of a 0.1 percent dip and a 0.1 percent decrease in September. Excluding food & energy, producer price inflation jumped 0.4 percent compared to no change in September. Producer price inflation was stronger than expected in October but on average remains sluggish. Headline inflation posted at a monthly 0.2 percent versus expectations of a 0.1 percent dip and a 0.1 percent decrease in September. Excluding food & energy, producer price inflation jumped 0.4 percent compared to no change in September.
The index for final demand services moved up 0.5 percent in October, the largest increase since a 0.5-percent rise in July 2013. The October advance can be traced to a 1.5-percent increase in margins for final demand trade services. The index for final demand goods moved down 0.4 percent in October, the fourth consecutive decrease.
The October decline was led by prices for final demand energy, which fell 3.0 percent. The index for final demand goods less foods and energy edged down 0.1 percent. Conversely, prices for final demand foods moved up 1.0 percent.
 On a seasonally adjusted year-ago basis, PPI final demand was up 1.5 percent, compared to 1.6 percent in September. Excluding food & energy, PPI final demand was up 1.7 percent versus 1.8 percent the month before. On a seasonally adjusted year-ago basis, PPI final demand was up 1.5 percent, compared to 1.6 percent in September. Excluding food & energy, PPI final demand was up 1.7 percent versus 1.8 percent the month before.
Overall, inflation remains sluggish at the producer level on an average basis.
Lower energy costs are keeping consumer inflation soft.
 Overall consumer prices in October were a flat 0.0 percent after firming 0.1 percent in September. Excluding food and energy, the CPI was warmer, gaining 0.2 percent after nudging up 0.1 percent in September. The consensus was for a 0.1 percent increase in October. Overall consumer prices in October were a flat 0.0 percent after firming 0.1 percent in September. Excluding food and energy, the CPI was warmer, gaining 0.2 percent after nudging up 0.1 percent in September. The consensus was for a 0.1 percent increase in October.
Energy fell 1.9 percent after slipping 0.7 percent in September. Gasoline dropped 3.0 percent after declining 1.0 percent the month before. Food price inflation rose 0.1 percent, following a gain of 0.3 percent in September.
 For the core rate, the shelter index, airline fares, household furnishings and operations, medical care, recreation, personal care, tobacco, and new vehicles were among the indexes that increased. The indexes for used cars and trucks and for apparel declined in October. For the core rate, the shelter index, airline fares, household furnishings and operations, medical care, recreation, personal care, tobacco, and new vehicles were among the indexes that increased. The indexes for used cars and trucks and for apparel declined in October.
On a seasonally adjusted basis, the headline CPI was up year-ago 1.7 percent versus 1.7 percent in September. Excluding food and energy, the year-ago pace was 1.8 percent, compared to 1.7 percent the month before.
While consumer price inflation firmed marginally, the year-ago rate is still below the Fed's target of 2 percent-especially when converted to a PCE basis which has been running below the CPI.
 The U.S. economy appears to be headed to stronger growth based on the index of leading indicators. The U.S. economy appears to be headed to stronger growth based on the index of leading indicators.
The index of leading economic indicators rose a very strong 0.9 percent in October pointing to near term acceleration in economic growth. The largest positive was once again in interest rates which reflects the Fed's near zero rate policy. Low unemployment claims were a strong contributor as were housing permits. The stock market was the only negative in the report but here strength may rebound given gains so far in November.
The leading index is running on the warm side but does underscore some of the economy's key pluses going into year-end and the New Year. Overall, the U.S. economy appears to be leading the global economy and likely is to continue to do so.
The U.S. recovery continues but on a moderate trajectory. Manufacturing and housing continue to oscillate while the consumer sector is slowly improving. The Fed remains concerned about low inflation.
Indicators are front loaded in the week ahead due to the Thanksgiving holiday on Thursday. Third quarter GDP gets a revision but that likely is a sleeper. Housing and manufacturing are two of the big issues as both sectors have been wavering. For housing, home prices will likely indicate strength of demand with the FHFA and Case-Shiller reports. For manufacturing, the key news will be durables orders. The consumer sector has been holding up moderately strong and is not as suspect. But notable releases are personal income, consumer confidence, and consumer sentiment.
The Chicago Fed National Activity Index for September jumped to 0.47 from minus 0.25 in August. Three of four components rose in the month led by production indicators which got a special boost from the manufacturing component of the industrial production report. Employment was the second strongest component in the report, getting a boost from the 2 tenths dip in the unemployment rate to 6.1 percent. The third positive component was sales/orders/inventories with consumption & housing the only component in the minus column as deterioration in consumption indicators more than offset a boost in housing starts & permits. On the whole, this report showed accelerating strength with the 4-week average at plus 0.25 vs plus 0.16 in August.
Chicago Fed National Activity Index Consensus Forecast for October 14: 0.50
Range: 0.25 to 1.00
The Markit PMI services index posted well over breakeven 50 at 58.9 in September versus 58.5 at mid-month and 59.5 in final August. Backlog was at a record high for this sample, which goes back five years, as new business rose at what the report called a "sharp and accelerated pace." The report said employment continued to grow, though it didn't describe the rate of growth, and said input price pressures eased. The sample's outlook was very positive with about half expecting business activity to increase over the next year and only 5 percent seeing a reduction.
Markit PMI services index (flash) Consensus Forecast for October 14: 57.8
Range: 57.2 to 58.0
The Dallas Fed general business activity index in its Texas manufacturing survey in October held steady at a solid reading of 10.5. The company outlook index surged more than 12 points to 18.2, reaching its highest level in six months. The production index, a key measure of state manufacturing conditions, fell from 17.6 to 13.7, indicating output grew but at a slightly slower pace than in September. Other measures of current manufacturing activity also reflected continued growth in October. The new orders index rose notably from 7.5 to 14.2, reaching a six-month high. The capacity utilization index edged down to 18.1 and the shipments index slipped to 12.8, although still more than a quarter of firms noted increases in these measures over September levels.
Dallas Fed general business activity index Consensus Forecast for November 14: 9.0
Range: 8.0 to 12.0
GDP growth for the initial estimate for the third quarter topped expectations even as it decelerated from the second quarter. Third quarter GDP growth decelerated after a second quarter jump related to make up activity after the first quarter decline due to atypically adverse winter weather. The advance estimate for the third quarter posted at a moderately healthy 3.5 percent annualized, following 4.6 percent boost in the second quarter. The median forecast was for 3.0 percent. Final sales of domestic product increased a healthy 4.2 percent after gaining 3.2 percent in the second quarter. Final sales to domestic purchasers rose 2.7 percent in the third quarter, compared to 3.4 percent in the second quarter. On the price front, the chain-weighted price index decelerated to 1.3 percent annualized from 2.1 percent in the second quarter. The core chain index, excluding food and energy, eased to 1.6 percent from 1.8 percent in the second quarter.
Real GDP Consensus Forecast for second estimate Q3 14: +3.3 percent annual rate
Range: +3.0 to +3.8 percent annual rate
GDP price index Consensus Forecast for second estimate Q3 14: +1.3 percent annual rate
Range: +1.3 to +1.3 percent annual rate
The FHFA purchase only house price index made a comeback with a 0.5 percent gain in August, following rise of 0.2 percent in July. August posted above market expectations for a 0.3 percent gain. The year-ago rate firmed to 4.8 percent from 4.6 percent in July. Regionally, seven Census regions reported gains in August while two declined.
FHFA purchase only house price index Consensus Forecast for September 14: +0.4 percent
Range: +0.3 to +0.6 percent
The S&P/Case-Shiller 20-city home price index (SA) contracted for a fourth straight month in August in Case-Shiller 20-city data, down 0.1 percent. Prices declined in 12 of the 20 cities, not much improved from July when prices declined in 13 of the 20 cities. Contraction in the August data was most severe in Chicago, Minneapolis, and Detroit with Chicago and Minneapolis also posting very soft year-on-year rates of only plus 2.9 percent and plus 3.9 percent, respectively. The total year-on-year adjusted rate fell sharply, to plus 5.6 percent from plus 6.7 and 8.0 percent in the two prior months and a positive low double-digit trend going back to the beginning of last year. The 5.6 percent rate is the lowest since November 2012.
The S&P/Case-Shiller 20-city HPI (SA, m/m) Consensus Forecast for September 14: +0.3 percent
Range: -0.4 to +0.4 percent
The S&P/Case-Shiller 20-city HPI (NSA, m/m) Consensus Forecast for September 14: -0.1 percent
Range: -0.3 to +0.4 percent
The S&P/Case-Shiller 20-city HPI (NSA, y/y) Consensus Forecast for September 14: +4.7 percent
Range: +4.4 to +5.4 percent
The Conference Board's consumer confidence index advanced to a new recovery high of 94.5 for October, up from an upwardly revised 89.0 in September and surpassing the previous recovery high of 93.4 in August. The index was last this strong in October 2007, right at the beginning of the Great Recession. October's gain was concentrated almost entirely in the expectations component, which jumped 8.6 points to 95.0 in a reading that isn't quite a recovery high but near one, next only to February 2011's 97.5. The strength in expectations reflects optimism in the outlook for both jobs and income, both of which show convincing gains. Showing only marginal strength was the present situation component which rose only 7 tenths to 93.7. Yet this is still a very strong reading, surpassed only once in the recovery in this year's August reading of 93.9.
Consumer confidence Consensus Forecast for November 14: 96.5
Range: 94.8 to 98.8
The Richmond Fed manufacturing index in October accelerated to 20 from September's 14. New orders were especially strong, at 22 versus 14, as were backlogs which rose 3 points to 9 which is very strong for this reading. Shipments were also up, to 23 vs 11, with employment growth solid and steady, at 14 versus 17.
Richmond Fed manufacturing index Consensus Forecast for November 14: 16
Range: 12 to 24
Durable goods orders notably disappointed in September after August's decline that followed a July surge. The core was soft in September but volatile (as usual) in recent months. New factory orders for durables decreased 1.1 percent in September after dropping 18.3 percent in August and spiking 22.5 percent in July. Transportation dipped 3.5 percent after falling a monthly 42.4 percent in August. Excluding transportation, durables orders slipped 0.2 percent, following a rebound of 0.7 percent in August. Expectations were for a 0.5 percent gain.
Numbers reflect revisions from the more recent total factory orders report.
New orders for durable goods Consensus Forecast for October 14: -0.5 percent
Range: -2.0 percent to +3.0 percent
New orders for durable goods, ex-trans., Consensus Forecast for October 14: +0.5 percent
Range: -0.3 percent to +1.4 percent
Initial jobless claims edged down in the November 15 week, 2,000 lower to 291,000, while the 4-week average edged up, 1,750 higher to 287,500. The November 15 week was the survey week for the November employment report and a comparison with the October survey week showed a 7,000 gain with the 4-week average up almost as much, at 6,250. This comparison won't be lifting estimates for the November report.
Jobless Claims Consensus Forecast for 11/22/14: 286,000
Range: 278,000 to 295,000
Personal income in September continued a modest uptrend but spending slipped on volatile auto sales and lower gasoline prices. Personal income advanced 0.2 percent in September, following a 0.3 percent gain in August. The wages & salaries component increased 0.2 percent, following a 0.5 percent boost the prior month. Averaging the wage gains leaves consumer basic income moderately healthy.
Personal income Consensus Forecast for October 14: +0.4 percent
Range: +0.3 to +0.5 percent
Personal consumption expenditures Consensus Forecast for October 14: +0.3 percent
Range: +0.2 to +0.4 percent
PCE price index Consensus Forecast for October 14: 0.0 percent
Range: -0.2 to +0.1 percent
Core PCE price index Consensus Forecast for October 14: +0.2 percent
Range: +0.1 to +0.2 percent
The Reuter's/University of Michigan's consumer sentiment index has been spiking going into the holiday shopping season, at 89.4 for the preliminary November reading versus October's final reading of 86.9 and preliminary reading of 86.4. Strength was led by the current conditions component which rose a very sizable 4.7 points from final September to 103.0. This offered an early indication, and a very positive indication, on the November-versus-October comparison in consumer activity. The expectations component showed less strength and less monthly acceleration but was still respectable, at 80.6 for a 1.0 point gain from final September. All these readings are the highest they've been since 2007. Falling gasoline prices are a major factor boosting confidence. A downward trend in initial jobless also is helping.
Consumer sentiment Consensus Forecast for final November 14: 90.0
Range: 89.5 to 94.8
New home sales have been volatile in recent months but saw back-to-back gains in August and September despite a large jump in August which suggested some comeback the next month. However, there was a dip from the initial August estimate. New home sales, at a 467,000 annual rate, managed to top August's great surge but only after August was revised sharply lower, from 504,000 to 466,000. Still, September's 467,000 rate was the best of the recovery, going back to July 2008 with August's 466,000 right behind in second place. Supply was stable in the report with 207,000 new homes on the market versus 204,000 in August while supply relative to sales is unchanged at 5.3 months.
New home sales Consensus Forecast for October 14: 470 thousand-unit annual rate
Range: 440 thousand to 490 thousand-unit annual rate
The pending home sales index has been pointing to continued modest growth in sales. Pending home sales were up 0.3 percent in September after a 1.0 drop in August. This was a small gain but nevertheless hints at growth ahead for existing home sales, final sales of which have been up-and-down all year. Looking at pending sales, which are defined as contract signings, strength was led by a 1.4 percent rise in the South which is by far the largest housing region and the region where sales have been strongest. Right behind at plus 1.2 percent was the Northeast with the Midwest and West both showing declines at minus 1.2 percent and minus 0.8 percent. One subtle plus in the report was the year-on-year trend which, after spending most of the year in the minus column, was back on the plus side at 1.0 percent, modest but a move in the right direction.
Pending home sales Consensus Forecast for October 14: +0.6 percent
Range: -1.0 to +2.0 percent
U.S. Holiday: Thanksgiving Day. All Markets Closed
The Chicago PMI in October jumped 5.7 points to 66.2 for its best reading in a year. And the gain was led by new orders, the most important component which was also at a 1-year high. Backlog orders were also up as was production. Employment in the sample was at its best level since November last year.
Chicago PMI Consensus Forecast for November 14: 63.2
Range: 62.0 to 65.0
NYSE Early Close, 1:00 p.m. ET
SIFMA Recommended Early Close 2:00 ET
Note: This week's Looking Ahead was posted November 21 due to the Thanksgiving holiday with Simply Economics taking the holiday week off. Consensus numbers that are available are preliminary and will be updated online.
The Markit PMI manufacturing flash index reported slowing growth so far for November, to 54.7 from 55.9 in October and from 56.2 in the October flash. The 1.2 point decline was deceleration for this index which is now at its slowest rate since the heavy weather of January. Main negatives included slowing in output and, not encouragingly, for new orders. Weakness in exports was especially noted with the strong dollar blamed. A positive was strength in employment.
No consensus numbers are yet available for this month's report
The composite index from the ISM manufacturing survey stands out starkly from the net result of other anecdotal surveys on October's manufacturing sector, showing outstanding growth at a composite index of 59.0 versus 56.6 in September. This level matches August's level with the two the strongest since February 2011. New orders, the most important reading in the report, rose a strong 5.8 points to a blistering 65.8. Production, at 64.8, was strong and in line with orders.
ISM manufacturing composite index Consensus Forecast for November 14: 58.0
Range: 57.0 to 60.0
Sales of total light motor vehicles firmed very slightly in October, to a 16.5 million annual pace versus 16.4 million in September. Sales of North American-made vehicles led October, rising to a 13.3 million rate from September's 13.2 million. Foreign-made sales slowed slightly to 3.2 million. These results point to little change for the motor vehicle component of the October retail sales report.
Motor vehicle domestic sales Consensus Forecast for November 14
No consensus numbers are yet available for this month's report
Motor vehicle total sales Consensus Forecast for November 14: 16.5 million-unit rate
Range: 16.5 to 16.6 million-unit rate
Construction spending unexpectedly declined in September on public outlays and somewhat on the private nonresidential component. Private residential spending was a positive for the month. Construction spending declined 0.4 percent in September after a 0.5 percent decrease in August. September's decrease was led by public outlays which fell 1.3 percent after a 1.0 percent drop in August. Private nonresidential spending dipped 0.6 percent, following an easing of 0.3 percent the month before. On a positive note, private residential construction spending rebounded 0.4 percent, following a decrease of 0.3 percent in August. And strength was in the new one-family component which advanced 1.1 percent in September, following a 1.2 percent gain the month before.
Construction spending Consensus Forecast for October 14: +0.6 percent
Range: +0.4 to +0.9 percent
ADP private payroll employment for October posted at 230,000. This compares with the BLS private payroll gain of 209,000.
ADP private payrolls Consensus Forecast for November 14: 215,000
Range: 205,000 to 240,000
Nonfarm business productivity for the third quarter advanced an annualized 2.0 percent, following a 2.9 percent boost in the second quarter. Unit labor costs nudged up 0.3 percent after falling an annualized 0.5 percent in the second quarter. Output growth slowed to 4.4 percent in the second quarter, following a 5.5 percent jump the prior quarter. Compensation growth held steady at a pace of 2.3 percent.
Nonfarm Business Productivity Consensus Forecast for revised Q3 14: +1.8 percent annual rate
Range: +1.5 to +1.8 percent annual rate
Unit Labor Costs Consensus Forecast for revised Q3 14: +0.6 percent annual rate
Range: +0.5 to +0.6 percent annual rate
The Markit PMI services flash index is scheduled for this week. The flash release was not yet available at publication.
No consensus numbers are yet available for this month's report
The composite index from the ISM non-manufacturing survey is scheduled for this week. ISM's non-manufacturing sample reports slowing but still very solid growth in October, at a composite reading of 57.1 vs 58.6 in September. A big plus in the report was a solid 1.1 point gain in employment to 59.6. This is the third strongest reading for employment in the 17 year history of the report which has exceeded 60 only once, in August 2005. But other readings slowed with new orders down 1.9 points to 59.1, for the least robust reading since April, and business activity down 2.9 points to 60.0.
ISM non-manufacturing composite index Consensus Forecast for November 14: 57.0
Range: 56.0 to 58.5
The Beige Book being prepared for the December 16-17 FOMC meeting is released. Trader focus likely will be on comments on the labor market and inflation.
Initial jobless claims are scheduled.
No consensus numbers are yet available for this week's report
Nonfarm payroll employment advanced 214,000 in October after gaining 256,000 September and 203,000 in August. Net revisions for August and September were up 31,000. The median market forecast for October was for a 240,000 boost. The unemployment rate dipped to 5.8 percent in October from 5.9 percent in September. Expectations were for 5.9 percent. The U-6 underemployment rate (which takes into account traditional unemployed, plus all persons marginally attached to the labor force, plus total employed part time for economic reasons, as a percent of the civilian labor force plus all persons marginally attached to the labor force) declined to 11.5 percent from 11.8 percent in September. This rate is one of Fed Chair Janet Yellen's favorite labor market indicators.
Going back to the payroll report, private payrolls grew 209,000 after advancing 244,000 in September. Average hourly earnings edged up 0.1 percent after no change in September. Average weekly hours ticked up to 34.6 hours versus 34.5 hours in September.
On a positive note (taking into account payroll growth, average hourly earnings, and change in the average workweek), private aggregate weekly earnings rose 0.6 percent in October, pointing to a notable rise in private wages & salaries. Production worker hours in manufacturing were up 0.3 percent for the month, suggesting a moderate manufacturing component for October industrial production.
Nonfarm payrolls Consensus Forecast for November 14: 225,000
Range: 200,000 to 250,000
Private payrolls Consensus Forecast for November 14: 205,000
Range: 191,000 to 245,000
Unemployment rate Consensus Forecast for November 14: 5.8 percent
Range: 5.7 to 5.8 percent
Average workweek Consensus Forecast for November 14: 34.6 hours
Range: 34.5 to 34.6 hours
Average hourly earnings Consensus Forecast for November 14: +0.2 percent
Range: +0.2 to +0.3 percent
The U.S. international trade gap in September expanded to $43.0 billion from $40.0 billion in August. Analysts expected a deficit of $40.7 billion. Exports declined 1.5 percent in September, following a rise of 0.3 percent in August. Imports were unchanged, following a 0.1 percent uptick the month before.
The petroleum gap grew to $14.0 billion from $13.1 billion in August. The goods excluding petroleum gap increased to $47.2 billion from $45.5 billion in August. The services surplus slipped to $19.6 billion from $20.2 billion.
Overall, slower global growth has nudged down growth in the U.S. A higher dollar may be playing somewhat of a role in softer exports. But recently lower oil prices likely will result in a favorable number for October.
International trade balance Consensus Forecast for October 14: -$40.5 billion
Range: -$43.5 billion to -$40.0 billion
Factory orders have not been much better than flat, a trend that didn't improve in September when orders fell 0.6 percent. The durable goods component, first posted last week, has been revised slightly higher but is still in the minus column at 1.1 percent vs a preliminary minus 1.3 percent. Weakness on the durable side is broad and includes special weakness in capital goods categories which points to weakness in business confidence and business investment.
The non-durable goods component is the new data in the latest report and was unchanged in September following declines of 0.4 percent and 0.8 percent in the two prior months. The price plunge for oil is certain to drag down petroleum subcomponents in the October report.
No consensus numbers are yet available for this month's report
Consumer credit outstanding rose $15.9 billion in September, right in line with expectations. Once again the gain was greatly skewed to non-revolving credit which rose $14.5 billion on strength in auto financing but also once again on the government's acquisition of student loans. The revolving side, in what is once again a disappointment for retailers, rose only $1.4 billion. Until consumers start using their credit cards, growth in retail sales will remain limited.
Consumer credit Consensus Forecast for October 14: +$16.5 billion
Range: +$14.0 billion to +$20.0 billion
R. Mark Rogers is the author of The Complete Idiot's Guide to Economic Indicators, Penguin Books.
He can also be found on a weekly broadcast talking about the U.S. economy, the easiest way to find him is by going to iTunes and searching for "Simply Economics."
Econoday Senior Writer Mark Pender contributed to this article.
|
