|
Simply Economics will be taking next week off
Simply Economics will return on Friday, January 2, 2015
Merry Christmas and Happy Holidays
from all of us at Econoday!
The economy still is not in high gear. Manufacturing and housing continue to oscillate. However, low oil prices are now being seen as a net positive for the economy—notably for the consumer and businesses outside the oil patch. And there are signs of improvement ahead.
 Equities made a substantial rebound this past week. Equities made a substantial rebound this past week.
But stocks got off to a negative start the first two days of trading. On Monday, oil stocks tugged down on worries about slowing global demand. This was despite better-than-expected industrial production gains in the U.S. Tuesday's U.S. economic data were slightly below forecasts and pulled stocks down. Housing starts declined to an annualized rate of 1.028 million units in November. But that was offset by an upward revision to October's housing starts. December's flash manufacturing PMI reading of 53.7, down from 54.8 in November, indicated that output eased.
 Stocks jumped sharply Wednesday on Fed news. A positive reaction to the Federal Reserve's monetary policy statement contributed to the rebound. In her post meeting press conference, Fed Chair Janet Yellen indicated that statement language switch to "patience" on the fed funds rate from "considerable time" did not represent a change in Fed intentions—but this still indicates loose monetary policy. She also said that the FOMC likely can hold its stance for the next two policy meetings. Stocks jumped sharply Wednesday on Fed news. A positive reaction to the Federal Reserve's monetary policy statement contributed to the rebound. In her post meeting press conference, Fed Chair Janet Yellen indicated that statement language switch to "patience" on the fed funds rate from "considerable time" did not represent a change in Fed intentions—but this still indicates loose monetary policy. She also said that the FOMC likely can hold its stance for the next two policy meetings.
Stocks staged a rally Thursday bolstered for a second session by reassurances from the Federal Reserve that it was in no hurry to normalize interest rates. Also, initial jobless claims dipped and leading indicator posted a healthy gain. Also, traders were posturing for quadruple witching on Friday. Activity generally picks up the day before and not the day of quadruple witching. Equities continued to rise Friday from continued momentum from loose Fed policy with its pledge to remain "patient" in raising policy rates.
Equities were up this past week. The Dow was up 3.0 percent; the S&P 500, up 3.4 percent; the Nasdaq, up 2.4 percent; the Russell 2000, up 3.8 percent; and the Wilshire 5000, up 3.4 percent.
For the year-to-date, major indexes are up as follows: the Dow, up 7.4 percent; the S&P 500, up 12.0 percent; the Nasdaq, up 14.1 percent; the Russell 2000, up 2.8 percent; and the Wilshire 5000, up 10.3 percent.
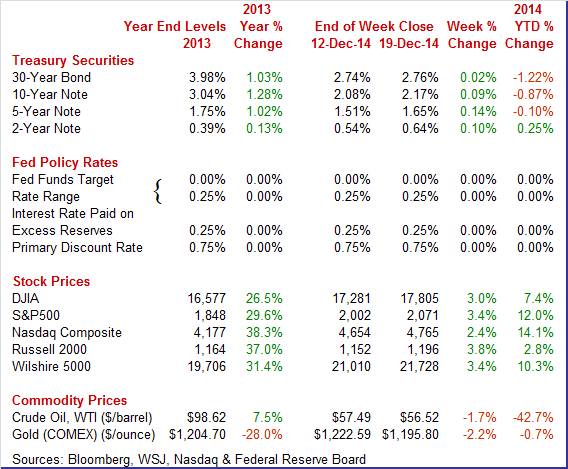
Weekly percent change column reflects percent changes for all components except interest rates. Interest rate changes are reflected in simple differences.
 Treasury rates on Monday firmed moderately on expectations of less loose policy by the Fed with Wednesday's FOMC statement. But yields slipped Tuesday on lower oil prices and lower inflation expectations. Also, sentiment on Fed policy swung in the other direction. Treasury rates on Monday firmed moderately on expectations of less loose policy by the Fed with Wednesday's FOMC statement. But yields slipped Tuesday on lower oil prices and lower inflation expectations. Also, sentiment on Fed policy swung in the other direction.
At mid-week, Treasury rates rose after Fed chair Janet Yellen stated that the Fed is on pace to raise rates next year. Fed chair comments and the FOMC statement continued to provide lift to yields Thursday along with lower jobless claims. Rates were little changed Friday.
For this past week Treasury rates were up as follows: 3-month T-bill, up 1 basis point; the 2-year note, up 10 basis points; the 5-year note, up 14 basis points; the 7-year note, up 13 basis points; the 10-year note, up 9 basis points; and the 30-year bond, up 2 basis points.
 Oil prices continued a downward trend this past week but at a mild pace. Oil prices continued a downward trend this past week but at a mild pace.
There were three modest daily swings this past week. Monday, traders saw U.S. producers holding firm on production despite the recent drop in oil prices. Spot West Texas Intermediate declined about $1-3/4 for the day. On Thursday crude dipped $1-1/2 per barrel after Saudi officials indicated that it would be hard to give up market share. WTI rose $1-1/2 per barrel Friday simply on daily volatility.
Net for the week, the spot price for West Texas Intermediate eased 97 cents per barrel to settle at $56.52.
The Fed is growing increasingly optimistic about the economy and is preparing to start slowly raising policy rate next year. This past week's economic news was mixed but leading indicators suggest improvement ahead.
 As anticipated, the FOMC left its policy interest rate range at zero to 0.25%. With quantitative easing over, the committee continues to maintain its existing policy of reinvesting principal payments from its holdings of agency debt and agency mortgage-backed securities in agency mortgage-backed securities and of rolling over maturing Treasury securities at auction. The committee said that the economy is expanding at a moderate pace and the labor market continues to improve. The FOMC continues to expect inflation to gradually increase towards its 2 percent objective as transitory effects of lower energy prices and other factors dissipate. The FOMC somewhat changed focus to being "patient" for policy rate increases. The statement indicates this language is consistent with the prior statements. Three FOMC members — Richard W. Fisher, Narayana Kocherlakota and Charles I. Plosser — voted against the decision. As anticipated, the FOMC left its policy interest rate range at zero to 0.25%. With quantitative easing over, the committee continues to maintain its existing policy of reinvesting principal payments from its holdings of agency debt and agency mortgage-backed securities in agency mortgage-backed securities and of rolling over maturing Treasury securities at auction. The committee said that the economy is expanding at a moderate pace and the labor market continues to improve. The FOMC continues to expect inflation to gradually increase towards its 2 percent objective as transitory effects of lower energy prices and other factors dissipate. The FOMC somewhat changed focus to being "patient" for policy rate increases. The statement indicates this language is consistent with the prior statements. Three FOMC members — Richard W. Fisher, Narayana Kocherlakota and Charles I. Plosser — voted against the decision.
Regarding the economy, the statement described "that economic activity is expanding at a moderate pace" and "labor market conditions improved further, with solid job gains and a lower unemployment rate."
In her post meeting press conference, Fed Chair Janet Yellen indicated that statement language switch to "patience" on the fed funds rate from "considerable time" did not represent a change in Fed intentions. Ms. Yellen sees fourth quarter GDP growth about the same as the third quarter (3.9 percent annualized growth). She expects lower oil price to hold down inflation in the near term. Meantime, long term inflation expectations remain stable. The Fed sees the drop in oil prices as a net positive for the economy. However, she was surprised that the housing recovery has not been more robust and indicated that it is because of continued tight credit markets. Ms Yellen indicated that the FOMC considered international developments including the impact of lower oil prices on Russian economic growth. However, she noted that the US has little trade with Russia.
Ms. Yellen indicated that there is no preset time table for normalization of policy rates. Rate changes will be data dependent and "relatively gradual." She also said that the FOMC likely can hold its stance for the next two policy meetings.
On inflation, "The Committee expects inflation to rise gradually toward 2 percent as the labor market improves further and the transitory effects of lower energy prices and other factors dissipate.
The latest Fed forecasts for the economy show slightly improved near-term numbers for real GDP and the unemployment rate. Headline inflation has been cut notably in the short term-likely due to lower oil prices. The drop in oil prices is seen as a net positive for the economy.
 The direction of housing remains uncertain. The direction of housing remains uncertain.
Housing remains on a flat trajectory. Single-family starts and multifamily starts moved in opposite directions. Housing starts dipped 1.6 percent after rebounding 1.7 percent in October. The 1.028 million unit pace was down 7.0 percent on a year-ago basis.
 November strength was in the volatile multifamily component. Multifamily starts rebounded 6.7 percent after declining 9.9 percent in October. In contrast, single-family starts fell 5.4 percent in November after gaining 8.0 percent in October. November strength was in the volatile multifamily component. Multifamily starts rebounded 6.7 percent after declining 9.9 percent in October. In contrast, single-family starts fell 5.4 percent in November after gaining 8.0 percent in October.
Housing permits declined a monthly 5.2 percent, following a 5.9 percent jump in October. The 1.035 million unit pace was down 0.2 percent on a year-ago basis. Market expectations were for 1.060 million units annualized.
Overall, recent housing numbers have oscillated notably. October was relatively good but November was not. On average, housing growth appears to be flat to modestly positive.
 The manufacturing sector appears to be making a comeback. Industrial production for November jumped 1.3 percent after edging up 0.1 percent in October (original estimate of down 0.1 percent due to weakness in utilities and mining). The consensus called for a 0.7 percent boost in November. The manufacturing sector appears to be making a comeback. Industrial production for November jumped 1.3 percent after edging up 0.1 percent in October (original estimate of down 0.1 percent due to weakness in utilities and mining). The consensus called for a 0.7 percent boost in November.
Manufacturing surged 1.1 percent, following a gain of 0.4 percent in October. Expectations for the manufacturing component were for an increase of 0.6 percent. The rise in factory output was well above its average monthly pace of 0.3 percent over the previous five months and was its largest gain since February. Mining slipped 0.1 percent in October, following a 1.0 percent drop the month before. Utilities rebounded 5.1 percent after a 0.7 percent decline in October.
Overall capacity utilization advanced to 80.1 percent in November from 79.3 percent in October.
November manufacturing was strong in the U.S. despite sluggishness in Europe and Asia. This report will be in the Fed hawks arguments for providing guidance for early tightening.
While national numbers were strong in November, Markit's US manufacturing sample continues to report slowing growth, much like Empire State's sample whose December report was posted yesterday. Markit's PMI December flash fell to 53.7, still above 50 to indicate monthly growth but the slowest growth in 11 months and down from 54.8 in final November and 54.7 in the November flash. Details also show 11 month lows for growth in both new orders and output while employment growth is also slowing. Cost inflation, in a reflection of plummeting oil prices, is at a 19 month low. November was a very good month for the manufacturing sector, based not only on industrial production but also the Philly Fed's report for the month, but the early indications on December are not favorable.
In December, manufacturing varied by regions.
 Sudden contraction was the theme in the December Empire State manufacturing report where the general conditions index fell to minus 3.58 for the first negative reading since January last year. This compares with plus 10.16 in November and a soft plus 6.17 in October. This report had been showing very strong momentum from May to September when the index averaged 21.22. Sudden contraction was the theme in the December Empire State manufacturing report where the general conditions index fell to minus 3.58 for the first negative reading since January last year. This compares with plus 10.16 in November and a soft plus 6.17 in October. This report had been showing very strong momentum from May to September when the index averaged 21.22.
 New orders, at minus 1.97 vs November's plus 9.14, are in the negative column for the second time in the last three months while unfilled orders, at a very steep negative reading of minus 23.96, are the weakest since December last year. Shipments are at minus 0.22 for the first negative reading since July last year. A plus in the report is steady and respectable growth in hiring, at 8.33 versus November's 8.51. The hiring pace "may" suggest optimism on the part of manufacturers. New orders, at minus 1.97 vs November's plus 9.14, are in the negative column for the second time in the last three months while unfilled orders, at a very steep negative reading of minus 23.96, are the weakest since December last year. Shipments are at minus 0.22 for the first negative reading since July last year. A plus in the report is steady and respectable growth in hiring, at 8.33 versus November's 8.51. The hiring pace "may" suggest optimism on the part of manufacturers.
Growth is still very strong in the Philly Fed manufacturing region but just not as strong as November's great surge. The Philly Fed's general conditions index slowed to 24.5 from 40.8 in November. Outside of November, the latest reading is the strongest since March 2011.
But details in the report do show across-the-board slowing including for new orders, at 15.7 vs November's 35.7, unfilled orders at 1.5 vs 7.1, employment at 7.2 vs 22.4, and shipments, at 16.1 vs November's 31.9. It was this 31.9 reading that first signaled what proved to be a great month for manufacturers based on Monday's November industrial production report where the manufacturing component surged 1.1 percent.
 Kansas City Fed District manufacturing activity continued to expand at a moderate pace in December, and producers' expectations for future activity remained at solid levels. Most price indexes grew at a slower pace, especially materials prices. Kansas City Fed District manufacturing activity continued to expand at a moderate pace in December, and producers' expectations for future activity remained at solid levels. Most price indexes grew at a slower pace, especially materials prices.
The month-over-month composite index was 8 in December, up slightly from 7 in November and 4 in October. The composite index is an average of the production, new orders, employment, supplier delivery time, and raw materials inventory indexes. The slight increase in activity was mostly attributed to durable goods producers, particularly for electronics, aircraft, and machinery products, while nondurable goods production remained sluggish. Most other month-over-month indexes were also slightly higher than last month. The production and employment indexes were unchanged, but the shipments, new orders, and order backlog indexes increased markedly.
 The consumer sector is getting a boost in higher discretionary income from lower gasoline prices. The consumer sector is getting a boost in higher discretionary income from lower gasoline prices.
Consumer price inflation turned down in November on sharply lower gasoline prices plus dips in some core subcomponents.
Overall consumer price inflation fell 0.3 percent after no change in October. The November number was below market expectations for a 0.1 percent dip. Energy dropped 3.8 percent, following a 1.9 percent decline the month before. Gasoline plunged 6.6 percent in November after a 3.0 drop in October. Food rose 0.2 percent, following a 0.1 percent increase in October. Excluding food and energy, consumer price inflation posted at 0.1 percent in November easing from 0.2 percent in October. Analysts forecast a 0.1 percent gain.
Within the core, the shelter index rose 0.3 percent, and the indexes for medical care, airline fares, and alcoholic beverages also rose. In contrast, the indexes for apparel, used cars and trucks, recreation, household furnishings and operations, personal care, and new vehicles all declined in November.
 On a seasonally adjusted basis, the headline CPI was up year-ago 1.3 percent versus 1.7 percent in October. Excluding food and energy, the year-ago rate was 1.7 percent, compared to 1.8 percent the prior month. On a seasonally adjusted basis, the headline CPI was up year-ago 1.3 percent versus 1.7 percent in October. Excluding food and energy, the year-ago rate was 1.7 percent, compared to 1.8 percent the prior month.
The latest CPI report gives the Fed room to keep monetary policy loose. However, there still likely will be lots of debate on timing of the next rate move and on guidance.
 Economic growth may be picking up according to leading indicators. The index of leading economic indicators continues to signal very strong near-term rates of growth, at 0.6 percent in November following revised growth rates of 0.6 percent and 0.8 percent in the prior two months. Economic growth may be picking up according to leading indicators. The index of leading economic indicators continues to signal very strong near-term rates of growth, at 0.6 percent in November following revised growth rates of 0.6 percent and 0.8 percent in the prior two months.
Once again the yield spread was the biggest positive for the index reflecting the Fed's near zero rate policy. Manufacturing orders, based on the ISM, were another strong plus in the latest report as was the stock market. Credit indications were also solid.
On the negative side is November's sharp decline in building permits as well as initial unemployment claims which peaked back over 300,000 briefly late in the month. Initial claims, however, have since moved convincingly back below 300,000 as evidenced in the latest claims report posted earlier this morning.
The Fed is preparing to raise policy rates in 2015 but at a slow pace according to the current labor market (wages still soft) and inflation (still below Fed target) trends. Manufacturing and housing are still on a low trajectory but leading indicators point to improvement ahead.
This week's numbers are front loaded with the Christmas holiday on Thursday. Data for three key sectors post—housing, consumer, and manufacturing. While the consumer sector has been gaining moderate traction, the other two have been oscillating near flat trends. For the consumer, the key report is personal income—spending will be key and the Fed will be watching inflation which has been running low. For manufacturing, the notable release will be durables orders. For housing, existing home sales, new home sales, and FHFA home prices hit the wires.
The Chicago Fed National Activity Index was tugged down by slowing in both production and employment, together with weakness in consumption & housing to plus 0.14 in October from a downwardly revised 0.29 in September. The decline also pulled down the 3-month average from September's downwardly revised plus 0.12 to minus 0.01.
Chicago Fed National Activity Index Consensus Forecast for Nov. 14: 0.23
Range: 0.20 to 0.25
Existing home sales continued to slowly rise in October, gaining 1.5 percent, following a 2.6 percent boost in September. The October pace of 5.26 million units topped expectations for 5.15 million units. On a year-ago basis sales posted at 2.5 percent. Supply declined 2.6 percent in October after a 2.1 percent drop in September. Months' supply slipped to 5.1 months from 5.3 months in September.
Existing home sales Consensus Forecast for November 14: 5.20 million-unit rate
Range: 4.97 to 5.35 million-unit rate
Durable goods orders rebounded 0.3 percent in October after September's decline of 0.7 percent. The core fell 1.1 percent in October after a rise 0.3 percent the month before. Transportation increased a monthly 3.4 percent after falling a monthly 3.1 percent in September.
Numbers reflect revisions from the more recent total factory orders report.
New orders for durable goods Consensus Forecast for November 14: +3.1 percent
Range: +0.5 percent to +8.0 percent
New orders for durable goods, ex-trans., Consensus Forecast for November 14: +1.3 percent
Range: +0.3 percent to +3.0 percent
GDP grew 3.9 percent in the third quarter versus the advance estimate of 3.5 percent. Growth still decelerated from the second quarter weather rebound of 4.6 percent annualized. With the second estimate for the third quarter, private inventory investment decreased less than previously estimated, and both personal consumption expenditures (PCE) and nonresidential fixed investment increased more. In contrast, exports increased less than previously estimated. On the price front, the chain-weighted price index was revised up marginally to 1.4 percent, compared to the advance estimate of 1.3 percent annualized from 2.1 percent in the second quarter. The core chain index, excluding food and energy, eased to 1.7 percent but was slightly higher than the initial estimate of 1.6 percent.
Real GDP Consensus Forecast for third estimate Q3 14: +4.3 percent annual rate
Range: +4.0 to +4.5 percent annual rate
GDP price index Consensus Forecast for third estimate Q3 14: +1.4 percent annual rate
Range: +1.4 to +1.4 percent annual rate
Personal income grew 0.2 percent in October after advancing 0.2 percent in September. The wages & salaries component gained 0.3 percent after increasing 0.2 percent the month before. Personal spending gained 0.2 percent after no change in September. Strength was in services which rose 0.3 percent, matching the September pace. Nondurables rebounded 0.2 percent in October after decreasing 0.3 percent the prior month. Durables dipped 0.2 percent after falling 1.1 percent in September. PCE inflation continues below Fed goal. Headline inflation rose only 0.1 percent on a monthly basis, matching the September number. Core PCE inflation gained 0.2 percent, following a 0.1 percent rise in September. On a year-ago basis, headline PCE inflation held steady at 1.4 percent in October. Year-ago core inflation posted at 1.6 percent in October versus 1.5 percent in September.
Personal income Consensus Forecast for November 14: +0.5 percent
Range: +0.3 to +0.7 percent
Personal consumption expenditures Consensus Forecast for November 14: +0.5 percent
Range: +0.4 to +0.7 percent
PCE price index Consensus Forecast for November 14: -0.1 percent
Range: -0.2 to -0.1 percent
Core PCE price index Consensus Forecast for November 14: +0.1 percent
Range: 0.0 to +0.2 percent
The FHFA purchase only house price index slowed in September according to FHFA with a 0.0 percent posting, following rise of 0.4 percent in August. September fell well short of market expectations for a 0.4 percent boost. The year-ago rate softened to 4.3 percent from 4.7 percent in August. Regionally, five Census regions reported gains in September while three declined and one was flat.
FHFA purchase only house price index Consensus Forecast for October 14: +0.2 percent
Range: +0.2 to +0.3 percent
The Reuter's/University of Michigan's consumer sentiment index surged to 93.8 for the mid-month December reading versus an already strong 88.8 in final November and 89.4 in mid-month November. This was the strongest reading since January 2007. The current conditions component was up 3.0 points from final November to 105.7 in a gain that signals month-to-month strength in consumer activity in December. The expectations component, though lagging at 86.1, was up a very sharp 6.2 points to signal rising confidence in the outlook for income and jobs.
Consumer sentiment Consensus Forecast for final December 14: 93.0
Range: 90.0 to 94.5
New home sales came in at a lower-than-expected 458,000 pace in October versus 455,000 in September which has been revised 12,000 lower. August, which was originally reported at 504,000, was revised down a second time, 13,000 lower in the latest report to 453,000. Supply of new home sales for sales was steady, at 212,000 vs 210,000 and 207,000 in the prior two months. On a monthly sales basis, supply was at 5.6 months versus 5.5 months in both September and August.
New home sales Consensus Forecast for November 14: 460 thousand-unit annual rate
Range: 440 thousand to 475 thousand-unit annual rate
The Richmond Fed manufacturing index was down very sharply in November, at 4 vs 20 the month before. Order readings were very weak with new orders essentially flat compared to October, at plus 1, and with backlogs in contraction, at minus 2. Shipments were also basically flat at 1 while vendor delays eased which is another sign of softness. But manufacturers in the region are still hiring, at 10 though down from 14 in October.
Richmond Fed manufacturing index Consensus Forecast for December 14: 7
Range: 5 to 11
Initial jobless claims, after rising above 300,000 briefly in late November, have been coming back down near their recovery lows. Initial claims fell for the 3rd straight week, down 6,000 to 289,000 in the December 13 week. The 4-week average, at 298,750, is down fractionally for the 1st decrease since way back at the beginning of November. Continuing claims, where data lag by a week, are also mixed. Continuing claims in the December 6 week, at 2.373 million, were down a very substantial 147,000 but merely reverse the prior week's 148,000 surge. The 4-week average, at 2.397 million, was up 10,000 in the latest data with the 4-week average trending roughly 30,000 above the month-ago comparison.
Jobless Claims Consensus Forecast for 12/20/14: 290,000
Range: 280,000 to 294,000
NYSE Early Close, 1:00 ET
SIFMA Recommended Early Close 2:00 ET
U.S. Holiday: Christmas Day. All Markets Closed.
Consensus forecasts are not yet available but will be updated on indicator web pages.
The Dallas Fed general business activity index held steady in November at a solid reading of 10.5. The company outlook index dropped from 18.2 to 8.8, due to a smaller share of firms noting an improved outlook in November than in October. The production index, a key measure of state manufacturing conditions, fell from 13.7 to 6, indicating output growth slowed in November. The new orders index also declined notably from 14.2 to 5.6, although more than a quarter of firms continued to note increases in new orders over October levels. The shipments index was 12.1, nearly unchanged from its October reading. Labor market indicators reflected continued employment growth and longer workweeks. The November employment index posted a sixth robust reading, coming in at 9.6. Twenty-one percent of firms reported net hiring, compared with 11 percent reporting net layoffs. The hours worked index slipped from 8.3 to 5.7, indicating a smaller increase in hours worked than last month.
The S&P/Case-Shiller 20-city home price index (SA) showed strength in September but not enough to reverse the trend which is still softening. Case-Shiller's 20-city rose an adjusted 0.3 percent for the first gain since April but the year-on-year rate fell 7 tenths to plus 4.9 percent which is the weakest showing since October 2012. But the breakdown was very positive with 18 of 20 cities showing monthly gains in strength of breadth last matched in March this year. The South, which is the largest region for home sales, shows special strength with Atlanta, Charlotte and Miami all at the top of the list at plus 1.2 percent in the month and with Dallas, at 0.9 percent, and Tampa, at 0.8 percent, right behind. Unadjusted data, which are closely tracked in this report, show no monthly change in September for the 20-city index vs a 0.2 percent gain in August. But the year-on-year rate, where monthly seasonality is neutralized, tells the exact same story as the adjusted data, at plus 4.9 percent for a 7 tenths decline.
The Conference Board's consumer confidence index dipped to 88.7 in November, down from a downward revised but still a 7-year, recovery best of 94.1 in October. A hidden positive in the latest report was little change in jobs-hard-to-get, at 29.2 percent which is very low for this reading and up only a marginal 2 tenths from October. The present situation component fell 3.1 points to 91.3 to indicate month-to-month weakness in consumer activity. The second component of the composite index, expectations, fell an even steeper 6.8 points to 87.0 which is the lowest reading since June. The decline here reflects declining confidence in future business conditions and some erosion in the jobs outlook. A positive, however, was strength in the key subcomponent for expectations which is future income. Optimism here held nearly steady. Income expectations turn mostly on the jobs outlook but also on the outlook for the stock market and the housing market.
Initial jobless claims are released for the week of December 27.
The Chicago PMI continues to report outsized rates of monthly growth, at a composite index of 60.8 for November versus an even greater outsized 66.2 in October. New orders fell 11.7 but were still at 61.9. Production also slowed but still remains robust while inventory growth slowed after October's 41-year high. One clear negative was a slowing in employment to its lowest level since March.
The pending home sales index continues to oscillate as pending home sales dipped 1.1 percent in October after a 0.6 percent rise the month before. Weakness was led by a 3.2 percent fall in the West with the South decreasing 1.0 percent and the Midwest slipping 0.6 percent. The Northeast edged up 0.5 percent. Housing on average is on a marginal upward trajectory-nearly flat. The year-ago pending home sales index posted at up 2.2 percent for October.
SIFMA Recommended Early Close 2:00 ET
U.S. Holiday: New Year's Day. All Markets Closed.
The Markit PMI manufacturing flash index in early December fell to 53.7, still above 50 to indicate monthly growth but the slowest growth in 11 months and down from 54.8 in final November and 54.7 in the November flash. Details also showed 11 month lows for growth in both new orders and output while employment growth was also slowing.
The composite index from the ISM manufacturing survey for November remains extremely strong. ISM's composite index held very strong near recovery highs, at 58.7 in November versus 59.0 in October. New orders came in at a blistering 66.0 versus October's 65.8 with backlog orders up 2.0 points to 55.0 which is very strong for this reading. Employment growth remained solid, at 54.9 versus 55.5, while production growth remained very strong at 64.4 versus 64.8. Delivery times slowed in a further indication of strength while inventories held steady. A notable reading in the report was contraction in input prices, at 44.5 versus October's 53.5. This was the first price contraction since July last year and reflects falling oil prices.
Construction spending rebounded significantly on public outlays and the private residential component. Construction spending jumped 1.1 percent in October after a 0.1 percent dip in September. October's increase was led by public outlays which rebounded 2.3 percent after a 1.6 percent fall in September. Private residential spending gained 1.3 percent, following an increase of 0.8 percent the month before. Private nonresidential construction spending slipped 0.1 percent, following a rise of 0.2 percent in September.
R. Mark Rogers is the author of The Complete Idiot's Guide to Economic Indicators, Penguin Books.
He can also be found on a weekly broadcast talking about the U.S. economy, the easiest way to find him is by going to iTunes and searching for "Simply Economics."
Econoday Senior Writer Mark Pender contributed to this article.
|
