|
 It was a relatively quiet week for equities other than the bigger-than-expected quantitative easing move by the European Central Bank. It was a relatively quiet week for equities other than the bigger-than-expected quantitative easing move by the European Central Bank.
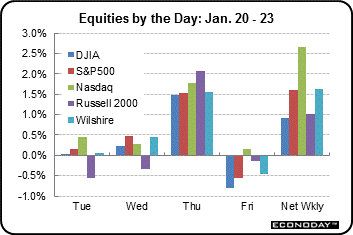
After the Martin Luther King, Jr. holiday, stocks opened mixed on Tuesday with little change also on Wednesday. Tuesday, some moderate strength was seen in the Nasdaq on gains in Yahoo!, Micron Technology, Apple, and Netflix.
 On Wednesday, stocks advanced in choppy trading as investors looked ahead to Thursday's policy setting meeting by the European Central Bank. However declines in IBM and Microsoft limited gains. On Wednesday, stocks advanced in choppy trading as investors looked ahead to Thursday's policy setting meeting by the European Central Bank. However declines in IBM and Microsoft limited gains.
Equities gained for a fourth day, wiping out losses for the year in the S&P 500, as the European Central Bank announced an expanded stimulus plan of 60 billion euros per month in asset purchases. The move was intended to push investors into riskier assets and to lower the value of the euro.
Corporate earnings came to the forefront on Friday as disappointing earnings from UPS, Bank of New York Mellon, and State Street tugged down on financial shares. But net for the week, the ECB quantitative easing program announcement boosted stocks.
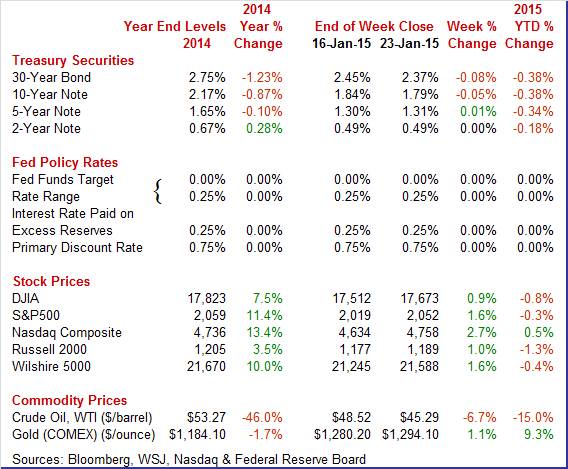
Equities were up this past week. The Dow was up 0.9 percent; the S&P 500, up 1.6 percent; the Nasdaq, up 2.7 percent; the Russell 2000, up 1.0 percent; and the Wilshire 5000, up 1.6 percent.
For the year-to-date, major indexes are mostly down as follows: the Dow, down 0.8 percent; the S&P 500, down 0.3 percent; the Nasdaq, up 0.5 percent; the Russell 2000, down 1.3 percent; and the Wilshire 5000, down 1.3 percent.
Weekly percent change column reflects percent changes for all components except interest rates. Interest rate changes are reflected in simple differences.
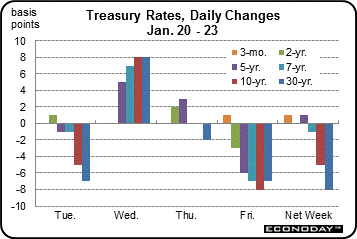 Medium and long-term Treasury rates came under pressure from ECB quantitative easing plans. Medium and long-term Treasury rates came under pressure from ECB quantitative easing plans.
Rates generally eased Tuesday after the Monday holiday on speculation that the European Central Bank would engage in quantitative easing. There was some reversal Wednesday on flow of funds into equities on a rally in energy shares and expected positive impact from ECB QE.
Yields were little changed Thursday as the ECB move was mostly anticipated. Rates dipped Friday on flight to safety on worries that Greek elections in the coming weekend would result in a win for an anti-austerity party.
For this past week Treasury rates were mostly down but mixed as follows: 3-month T-bill, up 1 basis point; the 2-year note, unchanged; the 5-year note, up 1 basis point; the 7-year note, down 1 basis point; the 10-year note, down 5 basis points; and the 30-year bond, down 8 basis points.
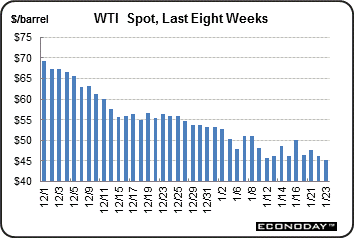 The spot price of West Texas Intermediate continued to weaken this past week. At the start of the trading week on Tuesday, oil fell sharply after Iraqi crude production surged to a record and the International Monetary Fund lowered its global growth outlook. Crude rebounded somewhat Wednesday after BHP Billiton Ltd., the largest overseas investor in U.S. shale, stated it will cut the number of active drill rigs in the U.S. by almost 40 percent. The spot price of West Texas Intermediate continued to weaken this past week. At the start of the trading week on Tuesday, oil fell sharply after Iraqi crude production surged to a record and the International Monetary Fund lowered its global growth outlook. Crude rebounded somewhat Wednesday after BHP Billiton Ltd., the largest overseas investor in U.S. shale, stated it will cut the number of active drill rigs in the U.S. by almost 40 percent.
Oil dropped Thursday after the weekly government report on inventories showed that U.S. crude supplies surged the most in almost 14 years. On Friday, oil fell to the lowest in almost six years on belief that the death of King Abdullah of Saudi Arabia will not result in any change in strategy for the world's largest crude exporter—that production levels will not be cut.
Net for the week, the spot price for West Texas Intermediate dropped $4.68 per barrel to settle at $45.29.
This past week the European Central Bank surprised with larger-than-expected quantitative easing and the housing sector was somewhat more positive than forecast.
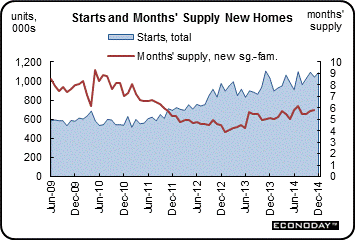 The housing sector continues to oscillate but the latest number is upward. The housing sector continues to oscillate but the latest number is upward.
Housing activity picked up in December and this time strength was in the single-family component. Housing starts rebounded 4.4 percent after declining 4.5 percent in November. Expectations were for a 1.041 million pace for November. The 1.089 million unit pace was up 5.3 percent on a year-ago basis.
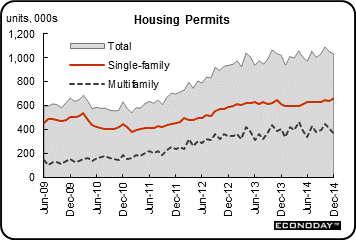 But there is little forward momentum in housing as housing permits declined a monthly 1.9 percent, following a 3.7 percent decrease in November. The 1.032 million unit pace was up 1.0 percent on a year-ago basis. But there is little forward momentum in housing as housing permits declined a monthly 1.9 percent, following a 3.7 percent decrease in November. The 1.032 million unit pace was up 1.0 percent on a year-ago basis.
Single-family permits rose 4.5 percent while multifamily permits fell 11.8 percent.
Housing is still much on a flat trajectory on average. But some of the component strength may be shifting toward the single-family component.
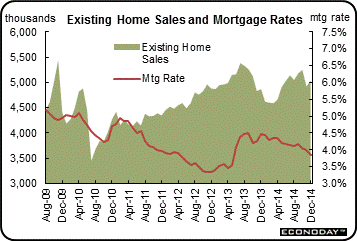 More housing numbers continue to oscillate but again the latest sales number is on the upside. Existing home sales popped up in December as expected, up 2.4 percent to an annual sales rate of 5.04 million versus a revised 6.3 percent decline in November to 4.92 million. December's gain, underscoring the housing starts report, was led by single-family homes which rose 3.5 percent to a 4.47 million rate. Condos declined 5.0 percent in the month to a 570,000 rate. The gain for single-family homes may be an important signal of strength for first-time home buyers. More housing numbers continue to oscillate but again the latest sales number is on the upside. Existing home sales popped up in December as expected, up 2.4 percent to an annual sales rate of 5.04 million versus a revised 6.3 percent decline in November to 4.92 million. December's gain, underscoring the housing starts report, was led by single-family homes which rose 3.5 percent to a 4.47 million rate. Condos declined 5.0 percent in the month to a 570,000 rate. The gain for single-family homes may be an important signal of strength for first-time home buyers.
The gain in sales drew down available homes on the market to 1.85 million from 2.08 million, in turn sharply lowering supply on the market to 4.4 months from 5.1 months. Lower supply points to sales troubles in next month's report.
On net, this is a solid report though seasonal factors do play an unusually large role in housing readings during the winter.
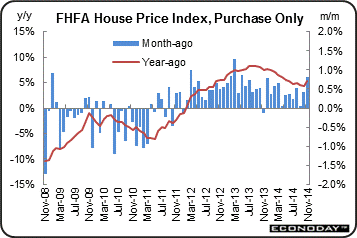 The proof is in the pudding—for housing in prices. Home prices may be signaling improvement in the housing sector. FHFA home prices gained 0.8 percent in November, following a 0.4 percent rise the month before. Market expectations were for a 0.3 percent increase for November. The year-ago rate posted at 5.3 percent from 4.4 percent in October. The proof is in the pudding—for housing in prices. Home prices may be signaling improvement in the housing sector. FHFA home prices gained 0.8 percent in November, following a 0.4 percent rise the month before. Market expectations were for a 0.3 percent increase for November. The year-ago rate posted at 5.3 percent from 4.4 percent in October.
Housing is not gangbusters but perhaps this sector is gaining a little traction.
Steady and moderate growth is the signal from the PMI manufacutring flash which came in at 53.7 in January from 53.8 in final December and a flash reading in December of 53.7. This index has been slowing to the softest readings in a year because of weakening oil & gas activity and weakening export orders. Lower oil prices have also been holding down input cost pressure which declined in the January flash for the first time in two-and-a-half years. Early indications on manufacturing activity in January have been mostly soft.
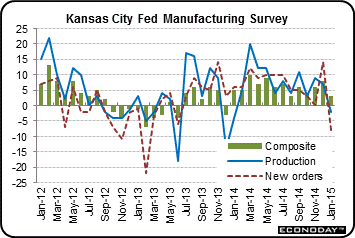 Kansas City Fed District manufacturing activity expanded at a slower pace in January, but producers' expectations for future activity remained at solid levels. Most price indexes were lower than last month, especially for finished goods prices. Kansas City Fed District manufacturing activity expanded at a slower pace in January, but producers' expectations for future activity remained at solid levels. Most price indexes were lower than last month, especially for finished goods prices.
The month-over-month composite index was 3 in January, down from 8 in December and 6 in November. The composite index is an average of the production, new orders, employment, supplier delivery time, and raw materials inventory indexes.
The overall slower growth was mostly attributable to declines in some types of durable goods production, particularly electronics, machinery, and metal products, some of which are likely due to lower energy activity. Looking across District states, the weakest activity was in energy-dependent Oklahoma. In contrast, nondurable goods producers reported a slight increase in production, especially for food and plastics products.
Most other month-over-month indexes were also down compared to last month. The production, shipments, and new orders indexes moved into negative territory for the first time in over a year, and the employment index posted a five-month low. The order backlog index plunged from 5 to minus 20, and the new orders for exports index decreased from 0 to minus 7. The finished goods inventory index continued to rise somewhat, and the raw materials inventory index moved up from 7 to 12.
Overall, the Kansas City report is hinting that slower global growth is impacting U.S. manufacturing.
Fed policy is boosting the index of leading indicators as it has for several years. But in the latest report, there is not much else to encourage optimism.
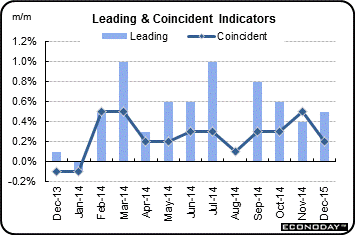 The index of leading economic indicators rose a solid 0.5 percent in December in what, however, is a somewhat shallow gain reflecting the Fed's zero interest-rate policy (the interest rate spread in leading indicators), a policy that looks to be shifting higher, and the report's credit index that has long been signaling strength in lending activity but has yet to be confirmed by other data. The index of leading economic indicators rose a solid 0.5 percent in December in what, however, is a somewhat shallow gain reflecting the Fed's zero interest-rate policy (the interest rate spread in leading indicators), a policy that looks to be shifting higher, and the report's credit index that has long been signaling strength in lending activity but has yet to be confirmed by other data.
Otherwise, the month's strength is mostly negligible though a decline in unemployment claims is the third largest factor, but here too claims so far this month have been on the rise. A clear negative reading in the report is a decline in building permits.
Essentially, the Fed's continued easy policy is showing up in leading indicators but not carrying over much to real sectors. There may be softness in economic growth ahead despite the gain in leading indicators.
This past week's focus was on the ECB and housing. The big question about the ECB's planned quantitative easing is how much impact it will have. There will be some shift to riskier assets but whether the degree will be the same as happened in U.S. is a question mark. Closer to home, the housing sector has shown a little more life but during months when seasonal factors are large. Several months of improvement are needed to see a more positive trend.
The highlight this week is the Fed's FOMC announcement on Wednesday. The Fed is watching both labor market conditions and inflation. Recent Fed comments have suggested no rate increase until after the March meeting but traders will be watching to see if there is a change in that stance. Friday, we get a first look at fourth quarter GDP and to what extent slowing in global growth might be impacting the U.S. Updates on the wavering housing and manufacturing sectors also are posted.
The Markit PMI services index softened to 53.3 for the final reading for December from the prior number of 56.2 for November final.
Markit PMI services index (flash) Consensus Forecast for January 15: 53.8
Range: 53.6 to 54.0
The Dallas Fed general business activity index fell in December from 10.5 to 4.1. The company outlook index was almost unchanged at 8.4, with 21 percent of respondents noting an improved outlook. The production index, a key measure of state manufacturing conditions, rose strongly from 6 to 15.8, indicating output grew at a faster pace in December.
Dallas Fed general business activity index Consensus Forecast for January 15: 4.0
Range: -5.0 to 7.3
FOMC meeting begins
Durable goods orders dipped 0.9 percent in November after rising 0.3 percent in October. The core declined 0.7 percent in October after a drop of 1.2 percent in October. Transportation fell a monthly 1.2 percent after jumping a monthly 3.3 percent in October. Motor vehicles and nondefense aircraft were up but defense aircraft orders were down notably. Outside of transportation, weakness was mixed but mostly down. The only major industry posting a gain in the latest month was machinery. Electrical equipment was flat. Declines were seen in primary metals, fabricated metals, and "other."
Numbers reflect revisions from the more recent total factory orders report.
New orders for durable goods Consensus Forecast for December 14: +0.7 percent
Range: -1.3 percent to +2.9 percent
New orders for durable goods, ex-trans., Consensus Forecast for December 14: +0.8 percent
Range: +0.3 percent to +2.4 percent
The S&P/Case-Shiller 20-city home price index (SA) for October (both adjusted and unadjusted) came in soft as expected for the year-ago figure, at plus 4.5 percent, down 3 tenths from September. This is the lowest rate since October 2012 and follows a full year of low double digit gains through much of 2013 and into April this year. But the month-to-month adjusted reading was positive, showing a very strong 0.8 percent adjusted gain led by continued strength in Atlanta and including big gains for San Francisco, Tampa and Denver. Unadjusted, however, the monthly change falls to minus 0.1 percent for a second straight month.
The S&P/Case-Shiller 20-city HPI (SA, m/m) Consensus Forecast for November 14: +0.6 percent
Range: +0.3 to +0.9 percent
The S&P/Case-Shiller 20-city HPI (NSA, m/m) Consensus Forecast for November 14: -0.2 percent
Range: -0.2 to 0.0 percent
The S&P/Case-Shiller 20-city HPI (NSA, y/y) Consensus Forecast for November 14: +4.3 percent
Range: +4.2 to +4.7 percent
New home sales for November came in below low-end expectations, down 1.6 percent in to an annual sales rate of 438,000 versus expectations for 460,000 and Econoday's low-end estimate for 440,000. Supply data were stable with 213,000 new homes on the market versus 210,000 in October. Supply relative to sales was up slightly, to 5.8 months from 5.7 and 5.5 months in the prior two months.
New home sales Consensus Forecast for December 14: 452 thousand-unit annual rate
Range: 445 thousand to 470 thousand-unit annual rate
The Conference Board's consumer confidence index for December rose 1.6 points to 92.6 which, outside of October's 94.4, and is the strongest reading of the recovery. November's index was revised 2.3 points higher to 91.0. The current conditions component of the index was up 5.1 points to 98.6, a convincing gain and a recovery best. The jobs-hard-to-get subcomponent showed special strength, at 27.7 percent vs November's 28.7 percent. Showing less punch was the expectations component which fell 8 tenths to 88.5. Weakness here, in contrast to the strength of the current jobs assessment, reflects pessimism in the jobs outlook where 16.9 percent see fewer jobs ahead versus 14.7 percent who see more opening up.
Consumer confidence Consensus Forecast for January 15: 96.0
Range: 93.5 to 100.0
The Richmond Fed manufacturing index for December picked up to 7 from 4 in November. New orders showed relative strength, at 4 versus November's 1, but were still on the soft side. Order backlogs, however, showed outright contraction for a second month, at minus 5 vs minus 2 in November. Shipments showed relative strength to November, at 5 vs 1, but, like new orders, were still on the soft side. A definitive sign of strength, however, came from employment which was up 3 points to a very solid 13 in a reading that points to underlying confidence among the region's manufacturers. Price data were soft in line with declining fuel costs.
Richmond Fed manufacturing index Consensus Forecast for January 15: 5.5
Range: 4.0 to 8.0
The FOMC announcement at 2:00 p.m. ET for the January 27-28 FOMC policy meeting is expected to leave rates unchanged. Traders will be taking note of the characterization of the economy and any changes in guidance on when first rate changes may occur.
FOMC Consensus Forecast for 1/28/15 policy vote on fed funds target range: unchanged at a range of zero to 0.25 percent
Initial jobless claims did fall 10,000 in the January 17 week but to a 307,000 level that was just outside the high end of the Econoday consensus range (289,000 to 305,000). The January 17 week was the sample week for the monthly employment report and a comparison with the December sample week shows a sizable 18,000 increase. The current 4-week average at 306,500 was up 6,500 from the prior week for the highest reading since way back in July. A sample-week to sample-week comparison for the average shows a 7,750 increase this month.
Jobless Claims Consensus Forecast for 1/24/15: 300,000
Range: 280,000 to 310,000
The pending home sales index picked up steam in November, to 104.8 from a revised 104.0 in October for a better-than-expected gain of 0.8 percent. The regional breakdown showed only narrow differences in the month with small gains in the Northeast, South, and West and a small decline in the Midwest.
Pending home sales Consensus Forecast for December 14: +0.9 percent
Range: +0.3 to +1.9 percent
GDP growth for the third-quarter was revised sharply higher to plus 5.0 percent for the strongest rate since way back in third-quarter 2003. The second revision, up 1.1 percentage points from the first revision and compared to plus 4.6 percent for the second quarter, reflected gains for health care, recreation, financial services, and software. Final sales were also revised sharply higher, to plus 5.0 vs a prior reading of 4.1 percent. GDP prices remain soft at plus 1.4 percent in a reading that is likely to ebb further given this quarter's drop in oil prices.
Real GDP Consensus Forecast for advance estimate Q4 14: +3.2 percent annual rate
Range: +2.2 to +3.5 percent annual rate
GDP price index Consensus Forecast for advance estimate Q4 14: +1.0 percent annual rate
Range: -0.4 to +1.4 percent annual rate
The employment cost index for the third jumped 0.7 percent for the second straight quarter (seasonally adjusted). These are the two largest increases of the recovery, going back to 2008. The wages & salaries component showed the most pressure in the report, up 0.8 percent in the quarter versus an already large 0.6 percent gain in the second quarter. The latest gain was the largest since 2008. The benefits component rose 0.6 percent, down from a 1.0 percent spike in the second quarter.
Employment cost index Consensus Forecast for Q4 14: +0.5 percent
Range: +0.3 to +0.9 percent
The Chicago PMI for December came in at 58.3 versus November's 60.8. Both new orders and backlog orders were at 5-month lows as was production. But one positive, as it has been in other reports this month, was strength in employment which points to underlying confidence in the outlook.
Chicago PMI Consensus Forecast for January 15: 57.7
Range: 54.5 to 58.8
The University of Michigan's consumer sentiment index was up 4.6 points in the mid-January reading to 98.2 for the highest level since January 2004. The expectations component, up 5.0 points to 91.6, was also at its highest level since January 2004 and reflects confidence in the outlook for jobs and income. The current conditions component, up 3.5 points to 108.3, was at its highest level since January 2007. This gain points to ongoing acceleration in consumer activity.
Consumer sentiment Consensus Forecast for final January 15: 98.2
Range: 97.7 to 100.0
R. Mark Rogers is the author of The Complete Idiot's Guide to Economic Indicators, Penguin Books.
He can also be found on a weekly broadcast talking about the U.S. economy, the easiest way to find him is by going to iTunes and searching for "Simply Economics."
Econoday Senior Writer Mark Pender contributed to this article.
|
