|
The early indications for June are decidedly flat, putting into question the big bounce theory that pent-up demand from the slow first quarter would give the second quarter a sizable lift. But not all the readings on the economy are flat and it is probably too early to rule out a September rate hike by the Fed.
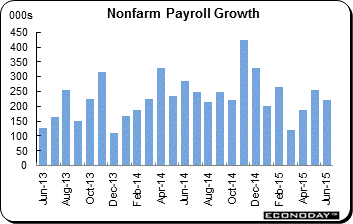 There doesn't seem to be much change in the labor market from last month's Federal Open Market Committee meeting when Fed Chair Janet Yellen described payroll growth as soft and wage pressures as subdued. Nonfarm payroll growth in June totaled only 223,000, a bit under expectations and including downward revisions totaling 60,000 to the two prior months with the initial 280,000 jump in May cut down to only 254,000 and with April moving from 221,000 to below 200,000 at 187,000. There doesn't seem to be much change in the labor market from last month's Federal Open Market Committee meeting when Fed Chair Janet Yellen described payroll growth as soft and wage pressures as subdued. Nonfarm payroll growth in June totaled only 223,000, a bit under expectations and including downward revisions totaling 60,000 to the two prior months with the initial 280,000 jump in May cut down to only 254,000 and with April moving from 221,000 to below 200,000 at 187,000.
The unemployment side of the labor market looks strong on the surface with the unemployment rate down a sharp 2 tenths to a recovery low of 5.3 percent and the broadly defined U-6 unemployment rate down 3 tenths to 10.5 percent. But this improvement is not tied to people getting more jobs, but rather to people dropping out of the workforce, evidenced by a very sharp 3 tenths drop in the labor force participation rate to 62.6 percent.
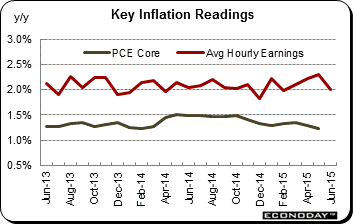 But, unquestionably, there's diminishing slack in the labor market which is tied, most acutely in the minds of the hawks, to the risk of wage inflation. Simply put, the fewer workers there are, the more employers will compete with each other to win them over. But judging by average hourly earnings, there's not much reason, at least in the June data, for anybody to worry. Average hourly earnings were surprisingly soft, unchanged in June with the year-on-year rate falling 3 tenths and back to the 2.0 percent line. There is talk, however, that this rate may have been skewed lower by the timing of the sample which ended early in the month on Friday, June 12th and did not include the 15th of the month when everyone gets paid. Similar sample timings in the past have also produced lower readings for wages. But even so, the 3 tenths year-on-year dip is very sharp and a look at other inflation measures, particularly the core PCE index which is also moving lower, is not raising any inflation flags. But, unquestionably, there's diminishing slack in the labor market which is tied, most acutely in the minds of the hawks, to the risk of wage inflation. Simply put, the fewer workers there are, the more employers will compete with each other to win them over. But judging by average hourly earnings, there's not much reason, at least in the June data, for anybody to worry. Average hourly earnings were surprisingly soft, unchanged in June with the year-on-year rate falling 3 tenths and back to the 2.0 percent line. There is talk, however, that this rate may have been skewed lower by the timing of the sample which ended early in the month on Friday, June 12th and did not include the 15th of the month when everyone gets paid. Similar sample timings in the past have also produced lower readings for wages. But even so, the 3 tenths year-on-year dip is very sharp and a look at other inflation measures, particularly the core PCE index which is also moving lower, is not raising any inflation flags.
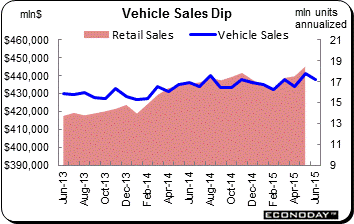 The employment report often sets the tone for how other data will unfold through the month, in this case pointing to a soft June. Vehicle sales in June, at an annualized pace of 17.2 million units, weren't actually soft but they were soft compared to May, which at 17.8 million was the strongest rate since July 2005. The slowing in vehicle sales points to slowing for the motor vehicle component of the retail sales report which makes up about 20 percent of the total report. The graph compares unit sales with retail sales and, unfortunately for June, unit sales are pointing in the wrong direction. Other than employment and vehicle sales, there's really no other definitive data out on June. The employment report often sets the tone for how other data will unfold through the month, in this case pointing to a soft June. Vehicle sales in June, at an annualized pace of 17.2 million units, weren't actually soft but they were soft compared to May, which at 17.8 million was the strongest rate since July 2005. The slowing in vehicle sales points to slowing for the motor vehicle component of the retail sales report which makes up about 20 percent of the total report. The graph compares unit sales with retail sales and, unfortunately for June, unit sales are pointing in the wrong direction. Other than employment and vehicle sales, there's really no other definitive data out on June.
Looking at the factory sector, hit by weak exports, is a real test of a person's optimism. Factory orders fell for the 9th time in 10 months in May, down a steeper-than-expected 1.0 percent and near the Econoday low-end forecast for minus 1.2 percent. The durables component of the report, initially released in the prior week, was revised a bit lower, to minus 2.2 percent, as was the durables component for April, to minus 1.7 percent. The nondurables component helped limit the damage in May but not by much, up 0.2 percent on gains for petroleum and coal.
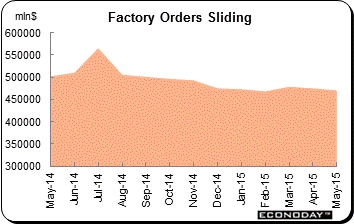 But aircraft orders, always volatile, were to blame for much of the durables weakness, falling 49 percent in the month. Excluding transportation equipment, which is where aircraft orders are tracked, factory orders were unchanged in May which isn't great but is much better than the minus 0.6 percent print for April. Weakness in energy equipment has also been a negative factor for the factory sector, down 22 percent in May following a smaller decline in April. Motor vehicle orders were also surprisingly weak, down 1.3 percent in May despite very strong sales. But aircraft orders, always volatile, were to blame for much of the durables weakness, falling 49 percent in the month. Excluding transportation equipment, which is where aircraft orders are tracked, factory orders were unchanged in May which isn't great but is much better than the minus 0.6 percent print for April. Weakness in energy equipment has also been a negative factor for the factory sector, down 22 percent in May following a smaller decline in April. Motor vehicle orders were also surprisingly weak, down 1.3 percent in May despite very strong sales.
Capital goods data had been showing some life but aren't anymore with nondefense orders excluding aircraft down 0.4 percent following a 0.7 percent decline in April. These are especially disappointing readings. And core shipments of capital goods are dead flat, near zero in both May and April. Other disappointments included a steep 0.5 percent decline in total unfilled orders following a smaller decline in April. Declines in unfilled orders are not a good omen for manufacturing employment which has been flat with a gain of only 4,000 in June's payroll data.
And looking at June's early indications, there's not much chance that factory orders will be shifting into positive ground. Most regional reports from the Federal Reserve have been flat as was the ISM report. New export orders in the ISM report came in below breakeven 50 for the fourth time this year in further evidence that the strong dollar continues to hurt manufacturers.
But there is good news in the economy right now and it's coming out of housing. The most telling data came several weeks back with the historic monthly gain of 11.8 percent for building permits in May that came on top of April's 9.8 percent surge. This points to significant work ahead in the construction sector where spending for private residential construction is now beginning to move forward again, up 0.3 percent in both May and April following a flat first quarter. Last year at this time, residential spending was in a downturn which now makes for solid year-on-year comparisons including a 7.8 percent gain for May.
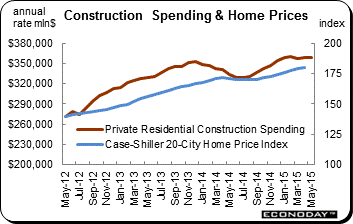 Rising investment in the new home sector is nearly certain to be accompanied by rising prices for existing homes, though the latest price news is on the soft side. Case-Shiller's closely watched 20-city index has gained only 0.3 percent in the last two readings which were for March and April. This is a respectable rate of monthly growth but isn't gangbusters, evidenced by the year-on-year rate which is not quite 5 percent. Given the still very limited number of homes for sale on the market, this lack of pricing punch is a surprise and likely reflects price concessions from sellers. But as seen in the graph, both construction spending and home prices are nevertheless trending in the right direction and hopefully the next installment of Case-Shiller, whose data lag by a month, will pop higher and reflect May's unusually great surge in existing home sales. Rising investment in the new home sector is nearly certain to be accompanied by rising prices for existing homes, though the latest price news is on the soft side. Case-Shiller's closely watched 20-city index has gained only 0.3 percent in the last two readings which were for March and April. This is a respectable rate of monthly growth but isn't gangbusters, evidenced by the year-on-year rate which is not quite 5 percent. Given the still very limited number of homes for sale on the market, this lack of pricing punch is a surprise and likely reflects price concessions from sellers. But as seen in the graph, both construction spending and home prices are nevertheless trending in the right direction and hopefully the next installment of Case-Shiller, whose data lag by a month, will pop higher and reflect May's unusually great surge in existing home sales.
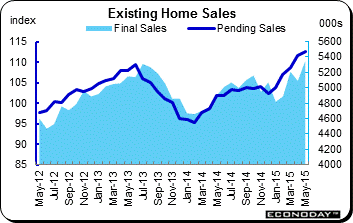 As permits are the leading indicator for residential construction, pending home sales are the leading indicator for existing home sales. Pending home sales, which track contract signings, rose a very solid 0.9 percent in May. The index level, at 112.6, is as high as it's been since the Greenspan bubble days of 2006. And the year-on-year rate is about as strong as you want, at plus 10.4 percent. Any stronger, and talk could pop up that housing is entering a new bubble. Final sales of existing homes, data that track closings and that were released in the prior week, are at a plus 9.7 percent rate. Housing, boosted by pent-up demand and perhaps the prospect of higher mortgage rates to come, has shot higher this spring and is emerging as a leader of the economy, just in time to offset all the trouble in the manufacturing sector. As permits are the leading indicator for residential construction, pending home sales are the leading indicator for existing home sales. Pending home sales, which track contract signings, rose a very solid 0.9 percent in May. The index level, at 112.6, is as high as it's been since the Greenspan bubble days of 2006. And the year-on-year rate is about as strong as you want, at plus 10.4 percent. Any stronger, and talk could pop up that housing is entering a new bubble. Final sales of existing homes, data that track closings and that were released in the prior week, are at a plus 9.7 percent rate. Housing, boosted by pent-up demand and perhaps the prospect of higher mortgage rates to come, has shot higher this spring and is emerging as a leader of the economy, just in time to offset all the trouble in the manufacturing sector.
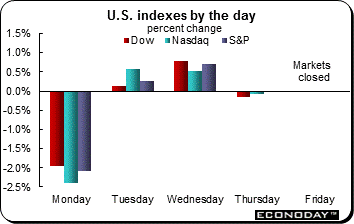 Monday was a hectic day for the markets as news hit that Greece had closed its banks for the week and would miss a debt payment to the International Monetary Fund. News of a Puerto Rican default didn't help. The rest of the week saw a bit of a recovery despite slight losses on Thursday. All together, stocks were down in the holiday shortened week with the Dow slipping 1.2 percent to 17,730. Money moved into the safety of Treasuries helping the 10-year yield to back off from 2.50 percent, ending the week at 2.42 percent. The euro slipped 0.8 percent to $1.1085 by week's end, not bad given the bad surprises out of Greece including, of course, the referendum scheduled for Sunday. All the uncertainties over the economic impact of a possible Greek exit together with weak economic data out of the U.S. didn't help oil which fell $3 to $56.50. Monday was a hectic day for the markets as news hit that Greece had closed its banks for the week and would miss a debt payment to the International Monetary Fund. News of a Puerto Rican default didn't help. The rest of the week saw a bit of a recovery despite slight losses on Thursday. All together, stocks were down in the holiday shortened week with the Dow slipping 1.2 percent to 17,730. Money moved into the safety of Treasuries helping the 10-year yield to back off from 2.50 percent, ending the week at 2.42 percent. The euro slipped 0.8 percent to $1.1085 by week's end, not bad given the bad surprises out of Greece including, of course, the referendum scheduled for Sunday. All the uncertainties over the economic impact of a possible Greek exit together with weak economic data out of the U.S. didn't help oil which fell $3 to $56.50.
Despite the strength in housing, the lack of job growth together with the lack of inflation are increasing the chances that the Fed may pass on their rate hike in September in favor of a hike at their December meeting. Putting the wildcard of Greece aside, expectations between September and December will likely take their next cue, weak vehicle sales or not, from the next retail sales report which won't be until mid-month, Tuesday, July 14th.
New indications on the services sector will come on Monday with the ISM non-manufacturing report as well as the PMI services index whose mid-month flash offered the earliest indication on the calendar that June would not be a strong month for the economy. Trade data follow on Tuesday with hard data on exports, which have been a major trouble spot for the economy. Wednesday afternoon will see the release of FOMC minutes and how silent the hawks really were at the June meeting.
The services PMI index proved prophetic, offering with its mid-month flash reading – down 1.7 points to 54.8 – the first striking indication that June, later confirmed by the employment report and by vehicle sales, would prove to be a soft month. Growth rates for new orders and shipments were among the slowest of the year in the services report. Watch for specific comments on hiring and whether service firms are having an increasingly difficult time finding new employees.
PMI Services Index - Consensus Forecast for June: 55.1
Range: 54.8 to 56.5
The ISM non-manufacturing index fell 2.1 points in May to a moderate 55.7 though new orders and business activity held at stronger levels in the high 50s. Apart from services, this report offers indications on construction, which have been strong, and on mining, which has been weak. This report also includes an export reading which has been showing, despite the strength in the dollar, still strong foreign demand for U.S. technical and managerial services.
ISM Non-Manufacturing Index - Consensus Forecast for June: 56.0
Range: 55.2 to 56.6
International trade is expected to show a slight widening in May, to $42.7 billion from April's $40.9 billion. Gains in imports are a subtraction in this report even though they do point to stronger U.S. demand for foreign goods which is getting a lift from the strong dollar. The strong dollar, however, has been weighing heavily on goods exports though services exports have held solid.
International Trade - Consensus Forecast for May : -$42.7 billion
Range: -$44.3 to -$38.5 billion
The revolving component of the consumer credit report, where credit cards are tracked, has been showing some life recently. May was a strong month for retail sales which may give a third straight lift to this component. May was also a very strong month for vehicle sales which should give yet another lift to the report's non-revolving component.
Consumer Credit - Consensus Forecast for May: +$18.5 billion
Range: +$17.8 to +$25.0 billion
Jobless claims are at rock bottom and are having a tough time moving lower. Low levels of claims have been offering leading indications for the decline underway in the unemployment rate. Initial claims inched higher in the prior week to 281,000 and are expected to inch back lower to 276,000.
Jobless Claims - Consensus Forecast for July 4 week: 276,000
Range: 260,000 to 290,000
Wholesale inventories looked heavy through the early part of the year but started to look leaner beginning in the spring when sales began to pick up. The Econoday consensus is calling for an incremental 0.3 percent rise for May's inventories.
Wholesale Inventories - Consensus Forecast for May: +0.3%
Range: +0.2% to +0.5%
|
