|
The doves attacked at mid-week with the FOMC minutes while the bears attacked on Friday as the Dow, looking like something out of Asia, lost more than 3 percent. And if you're one of those who's feeling sorry for themselves, join the rest of us. The week's news points to strength for the housing sector and is mixed on the still struggling factory sector. But at the very top of everything is the lack of inflation where the latest news, not to mention the building global meltdown, has decisively shifted liftoff expectations to December from September.
 Federal Reserve policy makers were definitely not convinced back in July that inflation was building any steam. Minutes from the FOMC meeting said that "almost all" voting members agreed that not only employment growth needed to improve, which it may or may not be doing, but that stronger inflation readings were also needed to justify a rate hike. The consumer price index rose only 0.1 percent in July as did the core, both under expectations. Year-on-year, the CPI was up 0.2 percent which is very low but, as seen in the columns at the far right of the graph, at least is moving in the right direction. Note how deeply the year-on-year overall rate has caved in so far in 2015, the result of the collapse in oil prices. The graph shows the year-on-year core rate, the dark line that, at 1.8 percent in July, continues to hold under the Fed's 2 percent target. The July CPI report has pulled down forecasts for the July PCE core, the index which the Fed watches most closely and will be released this Friday in the personal income and outlays report. The Econoday consensus is calling for only a 0.1 percent rise which should keep the year-on-year rate stubbornly under 1.5 percent and no threat to the doves. Federal Reserve policy makers were definitely not convinced back in July that inflation was building any steam. Minutes from the FOMC meeting said that "almost all" voting members agreed that not only employment growth needed to improve, which it may or may not be doing, but that stronger inflation readings were also needed to justify a rate hike. The consumer price index rose only 0.1 percent in July as did the core, both under expectations. Year-on-year, the CPI was up 0.2 percent which is very low but, as seen in the columns at the far right of the graph, at least is moving in the right direction. Note how deeply the year-on-year overall rate has caved in so far in 2015, the result of the collapse in oil prices. The graph shows the year-on-year core rate, the dark line that, at 1.8 percent in July, continues to hold under the Fed's 2 percent target. The July CPI report has pulled down forecasts for the July PCE core, the index which the Fed watches most closely and will be released this Friday in the personal income and outlays report. The Econoday consensus is calling for only a 0.1 percent rise which should keep the year-on-year rate stubbornly under 1.5 percent and no threat to the doves.
Looking ahead, it's hard to find sources of strength for inflation. The employment cost index hit a record low in the second quarter though average hourly earnings in July did edge back over 2.0 year-on-year. But strength in the dollar has been pulling import prices deep into the deflationary zone, at a year-on-year minus 10.0 percent at last count in July. Topping it off is the renewed collapse underway in commodity prices and especially oil prices where WTI is now straddling $40 for a year-to-date loss of 25 percent. But there has, however, been one source of price pressure and it's been coming out of the housing sector where rents have been climbing.
The best news in the week came once again from housing where existing home sales rose a stronger-than-expected 2.0 percent in July to a 5.59 million annual rate. And demand remains well ahead of supply which is very thin, at 4.8 months at the current sales rate vs 4.9 and 5.1 in the two prior months and 5.6 months in July last year. Sales are up 10.3 percent year-on-year, well ahead of the median price which, at $234,000, is up only 5.6 percent. This mismatch, especially given how thin supply is, hints at pricing power ahead and perhaps higher shelter prices as well. Single-family homes led the report while condos, where building on the new home side has been soaring, slipped in the month.  Year-on-year, sales of single-family homes are up 11.0 percent with condos at plus 5.0 percent. Regional data show surprisingly even strength. A highlight of this week's calendar will be new home sales on Tuesday where the Econoday consensus is calling for a more than 7 percent rebound to an annual rate of 516,000 rate. As the graph shows, the dark line of new home sales has been flattening out this year while existing home sales, in the light columns, have been posting steady and solid monthly gains. Year-on-year, sales of single-family homes are up 11.0 percent with condos at plus 5.0 percent. Regional data show surprisingly even strength. A highlight of this week's calendar will be new home sales on Tuesday where the Econoday consensus is calling for a more than 7 percent rebound to an annual rate of 516,000 rate. As the graph shows, the dark line of new home sales has been flattening out this year while existing home sales, in the light columns, have been posting steady and solid monthly gains.
 The flattening in new home sales is expected to turn higher but was mirrored by a big drop in housing permits in July which fell 16 percent to a 1.119 million annual rate as seen in the dark line of the graph. Though the drop was due in large part to a change in a real estate law that pulled New York City permits into June at the expense of July, permits were weak across regions including a 9.9 percent drop in the West which is an important market for new homes. On the plus side, the drop does follow large gains in prior months and given how thin inventories are, builders are likely to keep permits climbing. In another positive, the housing market index, a sentiment report compiled by the nation's home builders, is being driven higher by expectations for future sales and is at recovery best of 61. This points to continued growth for housing starts which, as the light columns of the graph show, have been very solid this year. The year-on-year gain in July came in at just over 10 percent. The flattening in new home sales is expected to turn higher but was mirrored by a big drop in housing permits in July which fell 16 percent to a 1.119 million annual rate as seen in the dark line of the graph. Though the drop was due in large part to a change in a real estate law that pulled New York City permits into June at the expense of July, permits were weak across regions including a 9.9 percent drop in the West which is an important market for new homes. On the plus side, the drop does follow large gains in prior months and given how thin inventories are, builders are likely to keep permits climbing. In another positive, the housing market index, a sentiment report compiled by the nation's home builders, is being driven higher by expectations for future sales and is at recovery best of 61. This points to continued growth for housing starts which, as the light columns of the graph show, have been very solid this year. The year-on-year gain in July came in at just over 10 percent.
The shock of the week, outside of the stock market, was Monday's truly amazing plunge in the Empire State index which is deep in the negative column this month at minus 14.92 vs July's more routine plus 3.86. This is by far the weakest reading of the recovery, since April 2009. New orders, which had already been weak in this report, fell from July's minus 3.50 to minus 15.70 for the worst reading since November 2010. Backlog orders, which had also been weak, came in at minus 4.55. Shipments, in the weakest reading since March 2009, fell to minus 13.79 from positive 7.99. Magnifying the surprise was that data followed the prior week's industrial production report where manufacturing, driven by strength in autos, posted a very strong gain.
 The plunge, however, in the Empire State index, which is the blue line of the graph, was not confirmed by the Philly Fed (green line) nor the manufacturing PMI (brown line). The Philly Fed's index, which is the most closely watched of the three, came in at a stronger-than-expected 8.3 for a small gain. Shipments led the report at a very strong plus 16.7 though order data showed less strength. Employment was up as was the 6-month outlook. The PMI came in at 52.9 for the flash August reading — well above 50 but still lower than expected. Note that the axis for the Philly Fed and Empire State indexes in the graph is on the left with the zero line representing the separation between monthly contraction, where Empire State is in right now, and monthly expansion which is where the Philly Fed is. For the PMI, the zero line between monthly contraction and expansion is breakeven 50 on the right axis. Growth rates for all three of these indexes peaked either late last year or early this year and have since been sloping downward. Who's to blame? Weak exports and contraction in energy equipment. The plunge, however, in the Empire State index, which is the blue line of the graph, was not confirmed by the Philly Fed (green line) nor the manufacturing PMI (brown line). The Philly Fed's index, which is the most closely watched of the three, came in at a stronger-than-expected 8.3 for a small gain. Shipments led the report at a very strong plus 16.7 though order data showed less strength. Employment was up as was the 6-month outlook. The PMI came in at 52.9 for the flash August reading — well above 50 but still lower than expected. Note that the axis for the Philly Fed and Empire State indexes in the graph is on the left with the zero line representing the separation between monthly contraction, where Empire State is in right now, and monthly expansion which is where the Philly Fed is. For the PMI, the zero line between monthly contraction and expansion is breakeven 50 on the right axis. Growth rates for all three of these indexes peaked either late last year or early this year and have since been sloping downward. Who's to blame? Weak exports and contraction in energy equipment.
 The hawks do have one chance for a September rate hike and that's the August employment report. If job growth proves solid, liftoff could be back on the table. Jobless claims aren't a measure of job growth but of attrition which is at record lows and is strongly favoring the hawks. Initial claims, the light columns in the graph, did rise but not by much, to 277,000 in the August 15 week. The August 15 week is also the sample week for the August employment report and a comparison with the July 18 week, which was the sample week for the July employment, is mixed. A one-to-one comparison against the 255,000 in the July week, which by the way is a 42-year low, points to trouble. But a comparison of the 4-week averages, which is the dark line on the graph, points to improvement. Note that week-to-week volatility was heavy in July due to summertime factory retooling, a fact that the 4-week average helps to smooth. The hawks do have one chance for a September rate hike and that's the August employment report. If job growth proves solid, liftoff could be back on the table. Jobless claims aren't a measure of job growth but of attrition which is at record lows and is strongly favoring the hawks. Initial claims, the light columns in the graph, did rise but not by much, to 277,000 in the August 15 week. The August 15 week is also the sample week for the August employment report and a comparison with the July 18 week, which was the sample week for the July employment, is mixed. A one-to-one comparison against the 255,000 in the July week, which by the way is a 42-year low, points to trouble. But a comparison of the 4-week averages, which is the dark line on the graph, points to improvement. Note that week-to-week volatility was heavy in July due to summertime factory retooling, a fact that the 4-week average helps to smooth.
But judging how much growth in August nonfarm payrolls would be needed to trigger a September hike is pretty much a mystery, at least at the margins. Back in July's FOMC statement, the Fed added the word "some" in describing the need for further employment growth in what then seemed to be a downgrade on how much improvement would be needed. With the addition of the word, the assumption took hold that any level above 200,000, such as July's very moderate 215,000, would be enough to trigger a September rate hike. But was the addition of this word an accident? As it turns out, the minutes offer no clue.
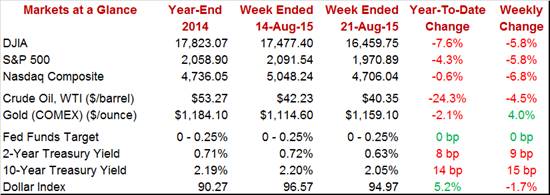
 Deep losses in emerging market currencies together with official devaluations made for an unsettling week with big slides for Kazakhstan, Malaysia, Mexico, Turkey and Vietnam. The dollar even fell, down 1.7 percent on the dollar index in the week. The Dow lost nearly 6 percent on the week while oil, now testing $40 for WTI, fell nearly 5 percent. Demand for the safety of gold and Treasuries is way up. Gold rose 4 percent and is back over $1,150 while the 10-year fell 15 basis points on the week to 2.05 percent. How much concern is there of a September rate hike? Not much based on the 2-year yield which fell a very steep 9 basis points to 0.63 percent. Deep losses in emerging market currencies together with official devaluations made for an unsettling week with big slides for Kazakhstan, Malaysia, Mexico, Turkey and Vietnam. The dollar even fell, down 1.7 percent on the dollar index in the week. The Dow lost nearly 6 percent on the week while oil, now testing $40 for WTI, fell nearly 5 percent. Demand for the safety of gold and Treasuries is way up. Gold rose 4 percent and is back over $1,150 while the 10-year fell 15 basis points on the week to 2.05 percent. How much concern is there of a September rate hike? Not much based on the 2-year yield which fell a very steep 9 basis points to 0.63 percent.
Extending chaos for both stock markets and currencies, not to mention the building downdraft in commodity prices, are sudden factors that are impossible to dismiss and that point squarely to a delay for liftoff. Housing may be strong but manufacturing is hurting and inflation, most importantly of all, is very hard to find. Hiking in September definitely poses more risks than it used to.
A heavy week is in store that will build up to Friday's release of the core PCE price index. Tuesday will see a concentration in the housing sector with the FHFA and Case-Shiller price reports, where forecasts are mixed, followed by new home sales which, having been flat this year, are expected to bounce sharply higher. Pending home sales will follow on Thursday with the latest indication on existing home sales while GDP, benefiting from prior gains in retail sales and inventories, is expected to be revised solidly higher to plus 3.2 percent. But the highlight by far will be the last glimpse of the core PCE price index before the September FOMC meeting. And no pressure is expected with the Econoday consensus calling for an increase of only 0.1 percent.
The national activity index is expected to post a very strong reading of 0.20 to indicate that July was the strongest month of the year for the economy. A big gain is certain for production due to the jump in the manufacturing component of the industrial production report while personal consumption & housing is certain to get a boost from July's strength in retail sales. But how strong will the other components be, especially employment? June, boosted by production, was a solid month for this index at plus 0.08.
National Activity Index - Consensus Forecast for July: 0.20
Range: 0.15 to 1.20
The FHFA house price index is expected to post a third straight solid gain of 0.4 percent in June. This report has been showing some strength in contrast to Case-Shiller data which have been soft.
FHFA House Price Index - Consensus Forecast for June: +0.4%
Range: +0.3% to +0.6%
Another month of disappointment is expected for Case-Shiller where the adjusted monthly gain for the 20-city index is seen at only 0.1 percent in June. This, however, would be an improvement from the 0.2 percent decline in May and no change in April. Year-on-year, rates are hovering near 5 percent which is roughly half the rate of sales growth for existing homes. Note the uncertainty among the sample with the top-end forecast all the way at plus 0.7 percent.
Case-Shiller Adj. 20-City, M/M Chg. - Consensus Forecast for June: +0.1%
Range: -0.1% to +0.7%
Case-Shiller Unadj. 20-City, M/M Chg. - Consensus Forecast for June: +1.1%
Range: +0.6% to +1.2%
Case-Shiller Unadj. 20-City, Y/Y Chg. - Consensus Forecast for June: +5.2%
Range: +5.0% to +5.3%
New home sales have been flat this year in contrast to existing home sales which are strong. But new home sales are expected to rebound a very sizable 7.1 percent in July to an annual rate of 516,000. Note that month-to-month readings in this report can be very volatile.
New Home Sales - Consensus Forecast for July: 0.516 million annual rate
Range: 0.494 to 0.531 million
Consumer confidence is expected to bounce back to 94.0 in August following July's nearly 10 point plunge to 90.9. The sample timing of this report typically goes out to mid-month which is likely to exclude the bulk of the global market turmoil centered in China. But buying plans will offer their own clues on housing demand and whether auto demand will remain strong.
Consumer Confidence - Consensus Forecast for August: 94.0
Range: 90.8 to 96.8
The Richmond Fed manufacturing index was a standout in July, rising 7 points to 13 while many other regional reports, especially those for Kansas City and Dallas, were still posting big declines tied to falling exports and falling demand for energy equipment. Forecasters see Richmond's index holding solid at 10 in August.
Richmond Fed Manufacturing Index - Consensus Forecast for August: 10
Range: 8 to 15
A bounce lower for aircraft orders is expected to pull down durable goods orders in July, to a consensus minus 0.4 percent in what would fail to extend a rare gain in June. But when excluding transportation, durable goods orders are expected to show an increase, at 0.4 percent which would only be the second gain this year.
Durable Goods Orders - Consensus Forecast for July: -0.4%
Range: -1.5% to +1.2%
Durable Goods Orders, Excluding Transportation - Consensus Forecast for July: +0.4%
Range: -0.4% to +0.7%
The services PMI is expected to ease 9 tenths of a point to a still very solid 54.8 for the flash August reading. New orders have been strong in this report which describes hiring as robust. This report is a reminder that the bulk of the economy is domestic based and insulated to a degree from exports and global markets.
Services PMI - Consensus Forecast for August, flash: 54.8
Range: 52.7 to 56.4
Real GDP is expected to be revised higher to plus 3.2 percent in the second estimate from an initial estimate of 2.3 percent. The revision is expected to reflect upward revisions to retail sales and a large build in June business inventories.
Real GDP, 2nd Estimate - Consensus Forecast for Second Quarter: +3.2%
Range: +2.7% to +3.6%
GDP Price Index, 2nd Estimate - Consensus Forecast for Second Quarter: +2.0%
Range: +1.9% to +2.1%
Initial jobless claims are expected to inch slightly lower to 274,000. With the forecast range between 268,000 and 275,000, there are no expectations that claims will break higher. Since back in March, claims data have been signaling unusually healthy conditions on the unemployment side of the labor market.
New Claims, Level - Consensus Forecast for August 22 Week: 270,000
Range: 268,000 to 275,000
Sales of existing homes are one of the very brightest spots in the economy and pending home sales are expected to signal extending strength ahead at plus 1.0% for the July report.
Pending Home Sales - Consensus Forecast for July: +1.0%
Range: +0.5% to +4.5%
The Kansas City Fed manufacturing index has been in deep contraction reflecting weak exports and the freeze on energy equipment. No let up is seen for August with the consensus at minus 4.
Kansas City Fed Manufacturing Index - Consensus Forecast for August: -4
Range: -10 to zero
The core PCE price index for July will be the last before the next FOMC, and another benign result, which is expected at plus 0.1 percent, could kill off remaining expectations for a September rate hike. Personal income and consumer spending are both expected to post solid gains of 0.4 percent in what would underscore the strength of the domestic consumer.
Personal Income - Consensus Forecast for July: +0.4%
Range: +0.2% to +0.8%
Consumer Spending - Consensus Forecast for July: +0.4%
Range: +0.4% to +0.7%
PCE Price Index - Consensus Forecast for July: +0.1%
Range: +0.1% to +0.1%
Core PCE Price Index - Consensus Forecast for July: +0.1%
Range: +0.1% to +0.2%
The final reading for this month's consumer sentiment index will include the psychological impact of China's devaluation and subsequent volatility in the financial markets. This index has been coming off highs early in the year but, boosted by strength in the jobs market, is still solid. Despite the global volatility, forecasters see a slight uptick for the final August reading, to 93.3 in what would be a 4 tenths gain from the flash reading.
Consumer Sentiment, final - Consensus Forecast for August: 93.3
Range: 92.7 to 95.0
|
