|
Simply Economics will be taking the Thanksgiving week off
and will return on Friday, December 4, 2015.
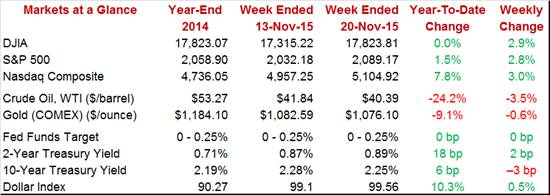
With a Fed committed to basing its liftoff decision on incoming data, Fed watching becomes a day-to-day vigil. Data following the unusually strong October employment report appeared to be edging lower but this week's data reversed the trend, showing hints of greater strength. Core inflation may be picking up, at least based on the consumer price report, while the factory sector may be moving out of contraction at the same time that the new home market may also be picking up.
 FOMC voters, based on the minutes of the last meeting, weren't ready for a rate hike in October but they sensed that conditions could very well be met in December. And as you can see, the CPI core, the dark line in the graph, justifies their instincts. The core is at 1.9 percent year-on-year, up 3 tenths from the beginning of the year and trending right at the Fed's general inflation target of 2.0 percent. And when measured from January, the year-to-date core is running slightly higher, at 2.1 percent which is up 3 tenths from this time last year. Inflation hawks, as befitting their caution, see further pressure ahead, believing commodity prices have likely hit bottom and will no longer pull down the general price trend. Some, in fact, are warning that inflation could very well begin to accelerate and accelerate very sharply, especially given the economy's low rates of unemployment and the associated risk of wage inflation. Nevertheless, when looking at total prices, such concerns seem distant. The columns in the graph are the total CPI which has been hovering near zero all year. FOMC voters, based on the minutes of the last meeting, weren't ready for a rate hike in October but they sensed that conditions could very well be met in December. And as you can see, the CPI core, the dark line in the graph, justifies their instincts. The core is at 1.9 percent year-on-year, up 3 tenths from the beginning of the year and trending right at the Fed's general inflation target of 2.0 percent. And when measured from January, the year-to-date core is running slightly higher, at 2.1 percent which is up 3 tenths from this time last year. Inflation hawks, as befitting their caution, see further pressure ahead, believing commodity prices have likely hit bottom and will no longer pull down the general price trend. Some, in fact, are warning that inflation could very well begin to accelerate and accelerate very sharply, especially given the economy's low rates of unemployment and the associated risk of wage inflation. Nevertheless, when looking at total prices, such concerns seem distant. The columns in the graph are the total CPI which has been hovering near zero all year.
 The lack of pressure for total prices reflects low costs for commodities and also low costs for imports including apparel and vehicles. But a look at domestic service prices, where the disinflationary pull from global prices is limited, does show pressure. Year-on-year, the service inflation rate (the dark line) is ascending methodically to the 2.5 percent line. Medical care ended a run of quiet months in October with a 0.7 percent jump in the month, reflecting a jump in in-patient hospital charges and taking the year-on-year rate to plus 3.0 percent. Education & communications also showed pressure in the month with a 0.3 percent gain though the year-on-year rate is still only plus 1.0 percent. The lack of pressure for total prices reflects low costs for commodities and also low costs for imports including apparel and vehicles. But a look at domestic service prices, where the disinflationary pull from global prices is limited, does show pressure. Year-on-year, the service inflation rate (the dark line) is ascending methodically to the 2.5 percent line. Medical care ended a run of quiet months in October with a 0.7 percent jump in the month, reflecting a jump in in-patient hospital charges and taking the year-on-year rate to plus 3.0 percent. Education & communications also showed pressure in the month with a 0.3 percent gain though the year-on-year rate is still only plus 1.0 percent.
 But the CPI isn't the favored the measure of Fed policy makers who prefer the core PCE index where, among other improvements, product substitution is taken into consideration, that is consumers moving to lower cost goods when their preferred goods go up in price. PCE prices typically lag CPI prices by about 1/2 percent but that's only a factoid, the trend of the two reports is what's important. And the trend for the core PCE, the light line in the graph, isn't keeping up with the dark line of the CPI core. There's been a widening separation all year between these two though if the CPI keeps going up, the PCE, however reluctantly, is certain to follow. But the October gains for the CPI numbers aren't guaranteed for the coming PCE numbers. The jump in medical costs may not be mirrored in the PCE where this subcomponent is based not on consumer prices but on producer prices where related costs are tame. But Econoday forecasters do see a 0.2 percent increase for October's core PCE which is headlining the coming week's calendar, up from plus 0.1 percent in September in a gain that could make for a rise in the 1.3 percent year-on-year rate. But the CPI isn't the favored the measure of Fed policy makers who prefer the core PCE index where, among other improvements, product substitution is taken into consideration, that is consumers moving to lower cost goods when their preferred goods go up in price. PCE prices typically lag CPI prices by about 1/2 percent but that's only a factoid, the trend of the two reports is what's important. And the trend for the core PCE, the light line in the graph, isn't keeping up with the dark line of the CPI core. There's been a widening separation all year between these two though if the CPI keeps going up, the PCE, however reluctantly, is certain to follow. But the October gains for the CPI numbers aren't guaranteed for the coming PCE numbers. The jump in medical costs may not be mirrored in the PCE where this subcomponent is based not on consumer prices but on producer prices where related costs are tame. But Econoday forecasters do see a 0.2 percent increase for October's core PCE which is headlining the coming week's calendar, up from plus 0.1 percent in September in a gain that could make for a rise in the 1.3 percent year-on-year rate.
 If not on inflation, the December rate decision could very well hinge on the global economy's effect on U.S. exports, a wildcard played out in the nation's factory sector where the latest run of news, for once in a long time, points to improvement. Three regional Fed indexes, as tracked in the graph, were posted in the week and the wide pull of contraction, apparent especially since August, is definitely easing. The Philly Fed index, the dark blue column, ended two months of contraction with a small 1.9 point gain where details include a long-awaited upturn in backlog orders and a solid gain for the general 6-month outlook, two areas of strength that point to future gains for employment. The Kansas City index, the middle brown column, also moved to the plus side but also just barely, to plus 1 for this reading. Still, this is the first positive score since all the way back in February. The best reading for this report is a strong bounce back for new export orders, to plus 7 vs a long run of minus readings including minus 10 for October (export readings are worth watching given the ups-and-downs of the global market). But not all the data are positive. The light green column is Empire State which remains deeply depressed at minus 10.74 for this reading from the New York Fed and which is really no better than any of the four prior months. New orders have contracted for six straight months in this report with shipments down for four straight. And in a reading that is not pointing to improvement for inflation, prices for final goods fell for a third straight month and are in their longest run of contraction since early 2013. If not on inflation, the December rate decision could very well hinge on the global economy's effect on U.S. exports, a wildcard played out in the nation's factory sector where the latest run of news, for once in a long time, points to improvement. Three regional Fed indexes, as tracked in the graph, were posted in the week and the wide pull of contraction, apparent especially since August, is definitely easing. The Philly Fed index, the dark blue column, ended two months of contraction with a small 1.9 point gain where details include a long-awaited upturn in backlog orders and a solid gain for the general 6-month outlook, two areas of strength that point to future gains for employment. The Kansas City index, the middle brown column, also moved to the plus side but also just barely, to plus 1 for this reading. Still, this is the first positive score since all the way back in February. The best reading for this report is a strong bounce back for new export orders, to plus 7 vs a long run of minus readings including minus 10 for October (export readings are worth watching given the ups-and-downs of the global market). But not all the data are positive. The light green column is Empire State which remains deeply depressed at minus 10.74 for this reading from the New York Fed and which is really no better than any of the four prior months. New orders have contracted for six straight months in this report with shipments down for four straight. And in a reading that is not pointing to improvement for inflation, prices for final goods fell for a third straight month and are in their longest run of contraction since early 2013.
 The week's best news on manufacturing came not out of the current month of November but from the first set of definitive data from October. Boosted by construction supplies, the manufacturing component of the industrial production report rose a solid 0.4 percent to end two prior months of decline. Construction supplies jumped 1.7 percent in the month in a reminder of how strong construction spending is right now, both housing and non-housing. Motor vehicle production, a center of strength all year for the manufacturing sector, jumped 0.7 percent with the year-on-year rate in the double-digits at plus 10.9 percent. Even when excluding vehicles, factory production in October rose 0.4 percent which is the best gain of the year. The gains here, as well as the early indications of improvement from the regional Feds, support the contention that the negative effects of dollar appreciation may be fading. Maybe, but maybe not. The dollar, in fact, continues to appreciate and global markets continue to look soft. The graph tracks the manufacturing component index on the right axis with goods exports on the left axis. Goods exports pivoted lower late last year and, at $127.3 billion in the latest available data for the month of September, have not shown much life. Note that the climb of the manufacturing curve began to flatten as exports began to sink. The week's best news on manufacturing came not out of the current month of November but from the first set of definitive data from October. Boosted by construction supplies, the manufacturing component of the industrial production report rose a solid 0.4 percent to end two prior months of decline. Construction supplies jumped 1.7 percent in the month in a reminder of how strong construction spending is right now, both housing and non-housing. Motor vehicle production, a center of strength all year for the manufacturing sector, jumped 0.7 percent with the year-on-year rate in the double-digits at plus 10.9 percent. Even when excluding vehicles, factory production in October rose 0.4 percent which is the best gain of the year. The gains here, as well as the early indications of improvement from the regional Feds, support the contention that the negative effects of dollar appreciation may be fading. Maybe, but maybe not. The dollar, in fact, continues to appreciate and global markets continue to look soft. The graph tracks the manufacturing component index on the right axis with goods exports on the left axis. Goods exports pivoted lower late last year and, at $127.3 billion in the latest available data for the month of September, have not shown much life. Note that the climb of the manufacturing curve began to flatten as exports began to sink.
 The housing sector this year has been bumpy, showing a burst of strength followed by a fizzle. And much like the factory sector, the latest data from housing, at least on net, looks improved. But we'll have to get past the headline for housing starts which fell a very steep 11.0 percent in October to a 1.060 million rate as seen in the columns of the graph. The reading is skewed by a drop in multi-family starts which surged in the prior month. Turning to the line in the graph, the spike for June reflected a surge in multi-family permits which are now in construction. Looking at permits for October, they rose 4.1 percent and perhaps hint at a leveling ahead for starts (at least they're not pointing to further erosion). The housing sector this year has been bumpy, showing a burst of strength followed by a fizzle. And much like the factory sector, the latest data from housing, at least on net, looks improved. But we'll have to get past the headline for housing starts which fell a very steep 11.0 percent in October to a 1.060 million rate as seen in the columns of the graph. The reading is skewed by a drop in multi-family starts which surged in the prior month. Turning to the line in the graph, the spike for June reflected a surge in multi-family permits which are now in construction. Looking at permits for October, they rose 4.1 percent and perhaps hint at a leveling ahead for starts (at least they're not pointing to further erosion).
 Putting aside the low-cost multi-family group and focusing specifically on the higher priced category of single-family homes, permits rose 2.4 percent to a 711,000 rate and are extending their climb that reverses a very weak start to the year. The graph tracks the dark line of permits against the columns of new home sales which, unfortunately, have not shown consistent strength this year, coming in as they did in September and June below 475,000. But the gains for permits, though not robust, will at least provide new supply to a new home market where lack of supply has been holding down sales. Not holding down sales are mortgage rates which remain low, at least for now. But the risk of higher rates, highlighted by the strength of October employment report, has led to a surge in mortgage applications for both refinancing and for home purchases, the latter up 12.0 percent in the latest week and, aside from keeping mortgage bankers busy, pointing to immediate strength for home sales. This is a stampede of buyers wanting to lock in low rates while they can, last at 4.18 percent for 30-year conforming mortgages ($417,000 or less). A sharp climb ahead for rates, however, is not the plan among Fed policy makers who instead see a long intermittent series of incremental rate increases having no dramatic effect on mortgage rates. Putting aside the low-cost multi-family group and focusing specifically on the higher priced category of single-family homes, permits rose 2.4 percent to a 711,000 rate and are extending their climb that reverses a very weak start to the year. The graph tracks the dark line of permits against the columns of new home sales which, unfortunately, have not shown consistent strength this year, coming in as they did in September and June below 475,000. But the gains for permits, though not robust, will at least provide new supply to a new home market where lack of supply has been holding down sales. Not holding down sales are mortgage rates which remain low, at least for now. But the risk of higher rates, highlighted by the strength of October employment report, has led to a surge in mortgage applications for both refinancing and for home purchases, the latter up 12.0 percent in the latest week and, aside from keeping mortgage bankers busy, pointing to immediate strength for home sales. This is a stampede of buyers wanting to lock in low rates while they can, last at 4.18 percent for 30-year conforming mortgages ($417,000 or less). A sharp climb ahead for rates, however, is not the plan among Fed policy makers who instead see a long intermittent series of incremental rate increases having no dramatic effect on mortgage rates.
 Housing and manufacturing may or may not be improving but there is definitely a lack of slack in the labor market. Yet, even here, not all is clear as there may be less slack then before. Initial jobless claims, as seen in the graph, have largely held below 280,000 for the last six months. This is the best run in more than 40 years and relative to the increased size of the labor force, is very likely the best run ever. The latest week, the November 14 week, is an especially important reading as it is also the sample week of the monthly employment report. And though claims did dip in the week relative to the prior week, they are actually up relative to the October 17 sample week for both the current week and the 4-week average. Though tangible, the increases are not dramatic and they don't point to significant erosion for nonfarm payroll growth which, remember, was a spectacularly strong 271,000 in October. Whether improving or not, claims are pointing to full employment and lack of slack in the labor pool. Housing and manufacturing may or may not be improving but there is definitely a lack of slack in the labor market. Yet, even here, not all is clear as there may be less slack then before. Initial jobless claims, as seen in the graph, have largely held below 280,000 for the last six months. This is the best run in more than 40 years and relative to the increased size of the labor force, is very likely the best run ever. The latest week, the November 14 week, is an especially important reading as it is also the sample week of the monthly employment report. And though claims did dip in the week relative to the prior week, they are actually up relative to the October 17 sample week for both the current week and the 4-week average. Though tangible, the increases are not dramatic and they don't point to significant erosion for nonfarm payroll growth which, remember, was a spectacularly strong 271,000 in October. Whether improving or not, claims are pointing to full employment and lack of slack in the labor pool.
 Fed minutes at mid-week solidly confirmed that policy makers very much, as they've been indicating all along, want to begin raising their policy rate beginning at the December FOMC. Bonds and the dollar showed very little reaction but not equities which got a big kick out of the news. Bullish confidence in the economy, justified by the Fed's desire to raise rates, vs the bearish effects of higher rates is a precarious balance to judge in the stock market. Yet the week's gains, at 2.9 percent for the Dow, at least point to confidence that higher rates will not slow economic growth, at least not by much. But the lack of movement in the long end of the bond market perhaps hints at counter expectations, that economic growth from here on out will be no better than modest. The 10-year Treasury yield actually came down in the week, 3 basis points lower to 2.25 percent. Fed minutes at mid-week solidly confirmed that policy makers very much, as they've been indicating all along, want to begin raising their policy rate beginning at the December FOMC. Bonds and the dollar showed very little reaction but not equities which got a big kick out of the news. Bullish confidence in the economy, justified by the Fed's desire to raise rates, vs the bearish effects of higher rates is a precarious balance to judge in the stock market. Yet the week's gains, at 2.9 percent for the Dow, at least point to confidence that higher rates will not slow economic growth, at least not by much. But the lack of movement in the long end of the bond market perhaps hints at counter expectations, that economic growth from here on out will be no better than modest. The 10-year Treasury yield actually came down in the week, 3 basis points lower to 2.25 percent.
Excluding trouble in global markets and excluding a disastrous employment report for November, the Fed appears very likely to begin its long promised series of slow hikes beginning at the December FOMC. The week's data, which perhaps show service-based price pressures and improvement for manufacturing and housing, confirm those expectations but don't really heighten them. The core PCE is still sagging and economic growth isn't that strong, a reminder that the Fed probably wants to remain accommodative, but just not at zero any more.
A holiday shortened week may pack a punch for Wednesday but there will be plenty of data to mull on Monday, led by existing home sales, and on Tuesday which will be highlighted by home prices and consumer confidence. Existing home sales are not, unfortunately, expected to show much life though Case-Shiller home prices on Tuesday are. Wednesday will see an avalanche of market-moving indicators led by durable goods orders, which are expected to show a rare advance, and personal income and outlays where, according to the Econoday consensus, core PCE prices are expected to post a noticeable advance. New home sales, the bookend to Monday's existing home sales, will end the holiday shortened week.
Unlike most other measures, the manufacturing PMI has not been signaling contraction for the sector. Far from it, with the index trending near the mid 50s and a 54.5 reading expected for the November flash. Regional reports on November activity have been constructive including the closely watched Philly Fed which moved back over breakeven. But the manufacturing PMI has been well above breakeven, in fact never approaching its 50 breakeven mark while the factory sector in fact has been in contraction all year. But the text of this report did describe October production as "robust" which, if not quite robust, was confirmed by a solid rise in the manufacturing component of the industrial production report.
Manufacturing PMI, Flash - Consensus Forecast for November: 54.5
Range: 53.8 to 55.0
Existing home sales bounced up strongly in September but a dip back is expected for October with the Econoday consensus at a 5.40 million annual rate, down what would be 2.7 percent in the month. The consensus estimate, based on weakness in pending home sales data, would point to a falling sales trend, one that would not point to home-price appreciation or rising household wealth.
Existing Home Sales, Annualized Rate - Consensus Forecast for October: 5.40 million
Range: 5.25 to 5.60 million
The second estimate for third-quarter GDP is expected to get a boost from a rise in inventories, specifically retail inventories which rose sharply in September. The Econoday consensus is calling for a 6 tenths gain in the second GDP estimate to plus 2.1 percent. Apart from inventories where reasons for change are hard to read, demand indications in the first estimate were very strong with final sales up 3.0 percent.
Real GDP, 3rd Quarter, 2nd Estimate, Annualized Rate - Consensus Forecast: +2.1%
Range: +1.8% to +2.4%
GDP Price Index, 3rd Quarter, 2nd Estimate - Consensus Forecast: +1.2%
Range: +1.2% to +1.4%
The nation's trade gap in goods has swung wildly the past couple of reports. Econoday forecasters see international trade in goods for October coming in somewhere between, at a gap of $62.0 billion vs $58.6 and $67.2 billion in the prior two months. Exports showed strength in September but not imports which could be pointing to business caution for the holidays.
International Trade In Goods, M/M Chg - Consensus Forecast for October: -$62.0 billion
Range: -$63.0 to -$58.5 billion
Case-Shiller 20-city home prices are expected to bounce higher in September, up a consensus 0.3 percent for the 20-city adjusted index vs only a 0.1 percent increase in August. The unadjusted year-on-year rate is expected to rise 2 tenths to plus 5.3 percent. Such gains would be welcome as data in this report have been very soft, belying lack of available homes on the housing market and pointing to weakness for household wealth.
Case-Shiller, 20-City Adj. Index, M/M Chg - Consensus Forecast for September: +0.3%
Range: +0.1% to +0.7%
Case-Shiller, 20-City Unadj. Index, Y/Y Chg - Consensus Forecast for September: +5.3%
Range: +5.1% to +5.6%
The consumer confidence index had been peaking going into the fall but fell back a sharp 5.0 points in October, to a 97.6 reading that the Econoday consensus sees partially reversed with a 2-point gain to 99.6 for November. Assessments of the jobs market in this report are always very closely watched and the consensus is hinting at month-to-month improvement for the November employment report.
Consumer Confidence Index - Consensus Forecast for November: 99.6
Range: 96.2 to 102.0
Regional Fed surveys have been showing improvement in November and the same is expected for the Richmond Fed's manufacturing index. The Econoday consensus is calling for a 2 point rise to plus 1 which would be the first positive reading since July. Details in this report, as in other manufacturing surveys, did show life in October but there were points of weakness including lack of growth for new orders and extended contraction for backlog orders.
Richmond Fed Manufacturing Index - Consensus Forecast for November: +1
Range: 0 to +4
Deep contractions in September and August are expected to be partially reversed with a 1.5 percent gain for durable goods orders in October which should get a not-quite-seasonable boost from Boeing orders at the biennial Dubai airshow. But even outside of transportation, forecasters see strength, at plus 0.4 percent which would also partially reverse prior weakness – but again only partially. A special focus will be inventory readings in this report and whether they point to an unwanted and extended overhang tied to soft demand. Strength in the dollar, which has not at all abated, and resulting weakness in export demand has been tipping the factory sector into contraction all year.
Durable Goods Orders, M/M Chg - Consensus Forecast for October: +1.5%
Range: +0.2% to +2.7%
Durable Goods Orders, Ex-Transportation, M/M Chg - Consensus for October: +0.4%
Range: +0.1% to +1.3%
Initial jobless claims have been trending at 42-year lows and, as a share of the whole labor market, are likely at record lows. Econoday forecasters see initial claims holding steady in the November 14 week, up only 1,000 to a very low 270,000. Continuing claims have also been at record lows.
Initial Jobless Claims - Consensus Forecast for November 21 week: 270,000
Range: 265,000 to 282,000
The core PCE price index is the Fed's favorite inflation reading and Econoday expectations are calling for a 0.2 percent gain in October in what would be substantial enough to further build expectations for a December rate hike. Readings on personal income and personal spending are also expected to rise, at respective consensus forecasts of plus 0.4 percent for the former, reflecting wage and workweek gains in the October employment report, and plus 0.3 percent for the latter in what, combined with steady incremental gains in service spending, would be in line with gains for core retail sales.
Personal Income, M/M Chg - Consensus for October: +0.4%
Range: +0.3% to +0.6%
Personal Spending, M/M Chg - Consensus for October: +0.3%
Range: +0.2% to +0.5%
PCE Price Index, M/M Chg - Consensus for October: +0.2%
Range: -0.1% to +0.2%
Core PCE Price Index M/M Chg - Consensus for October: +0.2%
Range: +0.1% to +0.2%
Home-price appreciation, as measured by the FHFA house price index, is expected to bounce back in September, to a consensus plus 0.4 percent vs plus 0.3 percent in August. Despite lack of available homes on the market, home prices have been soft and have not been contributing much to consumer momentum.
FHFA House Price Index - Consensus Forecast for September: +0.4%
Range: +0.3% to +0.5%
The service sector is the bread and butter of the U.S. economy and continued strength for the services PMI is expected, at a consensus 55.0 for the November flash for a 6 tenths increase from October. Though gains for November are expected, details in the October report were soft with new business slowing and backlog orders continuing to contract.
Services PMI - Consensus Forecast for November, Flash: 55.0
Range: 53.8 to 55.3
Samples are small and monthly data move wildly but new home sales simply plummeted in September, down 12 percent to a 468,000 annualized rate. A gain is the consensus for October, to 499,000 for what would be a giant looking 6.6 percent burst. But even with this gain, the sales rate would still be well below August and could nevertheless raise questions over what is, in any case, a cautious outlook for the new home market.
New Home Sales, Annualized Rate - Consensus Forecast for October: 499,000
Range: 458,000 to 540,000
Consumer sentiment is expected to hold onto its early November gains, at 93.1 for the final reading of the month and once again the strongest result since July. Expectations were on the rise early in the month as was the assessment of current conditions. But watch for inflation readings in this report which have been weak and could become a factor for the December FOMC.
Consumer Sentiment, Preliminary - Consensus for November: 93.1
Range: 92.0 to 94.5
Consensus estimates and commentary for the below data were not available at the November 20 posting but will be posted online as they become available (Simply Economics is taking the November 27 week off in observance of Thanksgiving).
|
