|
There's been good news on the economy lately but it has not been centered in the business sector. Investment in new machinery, which is central to productivity improvement, continues to contract, in turn detracting from consumer strength and very possibly derailing any chance for a June FOMC rate hike.
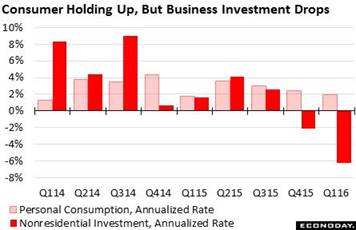 Friday's second estimate for first-quarter GDP is one of the highlights of the week's data. Highlight, however, is really not the right word. GDP came in at an annualized plus 0.8 percent for a paltry 3 tenths gain from the first estimate. We consumers did our share in the quarter, in sharp contrast to businesses which definitely did not do theirs. Personal consumption was unrevised at a plus 1.9 percent rate, far from stellar yet simply robust compared to a downward revised 6.2 percent contraction for nonresidential fixed investment, its second dip in a row and by far the weakest result of our economic cycle. This breakdown unquestionably points to lack of confidence in the business outlook. The importance of this for the FOMC is hard to overstate. Janet Yellen, in comments late in the week, called the nation's productivity growth, which is tied directly to business investment, as "really miserable". Friday's second estimate for first-quarter GDP is one of the highlights of the week's data. Highlight, however, is really not the right word. GDP came in at an annualized plus 0.8 percent for a paltry 3 tenths gain from the first estimate. We consumers did our share in the quarter, in sharp contrast to businesses which definitely did not do theirs. Personal consumption was unrevised at a plus 1.9 percent rate, far from stellar yet simply robust compared to a downward revised 6.2 percent contraction for nonresidential fixed investment, its second dip in a row and by far the weakest result of our economic cycle. This breakdown unquestionably points to lack of confidence in the business outlook. The importance of this for the FOMC is hard to overstate. Janet Yellen, in comments late in the week, called the nation's productivity growth, which is tied directly to business investment, as "really miserable".
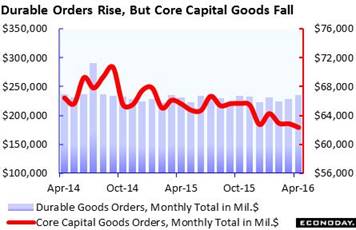 But the decline in nonresidential investment should not be a surprise given how weak capital goods have been in the monthly durable goods report. New orders for core capital goods, a reading that excludes defense goods and commercial aircraft, fell a very sharp 0.8 percent in data for the month of April. This is the third straight decline and the fifth out of the last six months in a string that has taken this reading to a five-year low. Year-on-year, orders are squarely in the negative column at minus 5 percent and are down 12 percent from their cycle peak in September 2014. Other data in the durables report, that is data that are tied closer to the consumer and further from businesses, were solid as total orders, underpinned by vehicles and aircraft, rose 3.4 percent. But the decline in nonresidential investment should not be a surprise given how weak capital goods have been in the monthly durable goods report. New orders for core capital goods, a reading that excludes defense goods and commercial aircraft, fell a very sharp 0.8 percent in data for the month of April. This is the third straight decline and the fifth out of the last six months in a string that has taken this reading to a five-year low. Year-on-year, orders are squarely in the negative column at minus 5 percent and are down 12 percent from their cycle peak in September 2014. Other data in the durables report, that is data that are tied closer to the consumer and further from businesses, were solid as total orders, underpinned by vehicles and aircraft, rose 3.4 percent.
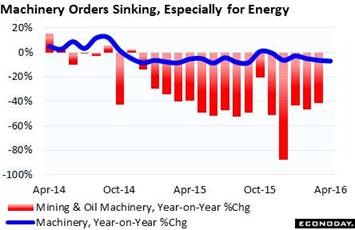 There are large lag effects in economics and one is visible right now in capital goods where declines in mining & oil machinery, tied ultimately to the 2014 collapse in oil and commodity prices, continue to express themselves in force. New orders for mining & oil-field machinery entered a contraction cycle in October 2014 and have been pulling down total machinery orders ever since. The rate of year-on-year decline for this subcomponent has been roughly at the 40 percent line from March last year — and no improvement has yet to be seen, this despite the ongoing run-up in oil prices. But boom and bust is not that unusual in mining and oil, industries that are tied inseparably to changes in commodity prices. Note that April's results for mining & oil machinery, which are missing in the red column of the accompanying graph, will be released with the factory orders report on Friday, June 3rd. There are large lag effects in economics and one is visible right now in capital goods where declines in mining & oil machinery, tied ultimately to the 2014 collapse in oil and commodity prices, continue to express themselves in force. New orders for mining & oil-field machinery entered a contraction cycle in October 2014 and have been pulling down total machinery orders ever since. The rate of year-on-year decline for this subcomponent has been roughly at the 40 percent line from March last year — and no improvement has yet to be seen, this despite the ongoing run-up in oil prices. But boom and bust is not that unusual in mining and oil, industries that are tied inseparably to changes in commodity prices. Note that April's results for mining & oil machinery, which are missing in the red column of the accompanying graph, will be released with the factory orders report on Friday, June 3rd.
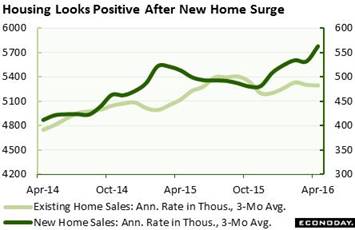 In contrast to business investment, consumer investment is now taking off, first evident in April's retail sales report which, posted at mid-month this month, showed convincing across-the-board gains. And there's no bigger investment for a consumer than a house. Until the last couple of weeks, indications on housing were really no better than mixed. But this week, housing put on a breakout performance. It's hard to exaggerate the gain for new home sales in April, surging to a 619,000 annualized rate for a 16.6 percent monthly gain that was last exceeded way back in January 1992. The rate itself is the highest since January 2008 and dwarfs all readings of the recovery. February 2015's rate, way behind at 545,000, is the next highest of this cycle. Year-on-year, total sales of new homes are suddenly up 24 percent which is at the top of the economy's growth rates and puts home builders and realtors in a long awaited sweet spot. The accompanying graph compares the 3-month averages for new home sales and existing home sales, averages that help to smooth out monthly volatility which is common for these two very important economic series. In contrast to business investment, consumer investment is now taking off, first evident in April's retail sales report which, posted at mid-month this month, showed convincing across-the-board gains. And there's no bigger investment for a consumer than a house. Until the last couple of weeks, indications on housing were really no better than mixed. But this week, housing put on a breakout performance. It's hard to exaggerate the gain for new home sales in April, surging to a 619,000 annualized rate for a 16.6 percent monthly gain that was last exceeded way back in January 1992. The rate itself is the highest since January 2008 and dwarfs all readings of the recovery. February 2015's rate, way behind at 545,000, is the next highest of this cycle. Year-on-year, total sales of new homes are suddenly up 24 percent which is at the top of the economy's growth rates and puts home builders and realtors in a long awaited sweet spot. The accompanying graph compares the 3-month averages for new home sales and existing home sales, averages that help to smooth out monthly volatility which is common for these two very important economic series.
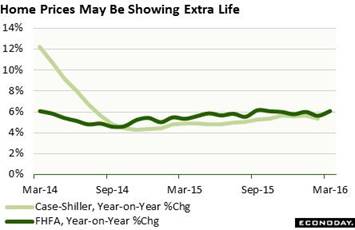 As sales go, so go prices which are showing new traction. The median price for a new home jumped 7.8 percent in April to a record $321,100 while the year-on-year rate, which was negative in the March report, is now at plus 9.7 percent. But prices in the new home sales report are based on small samples and are subject to big swings from month to month, unlike prices in the FHFA house price report which were also released in the week. The FHFA index for March rose a higher-than-expected 0.7 percent for the best reading since September, with the year-on-year rate jumping a big 5 tenths and over the 6 percent line to 6.1 percent for the best reading since October. Home-price appreciation, during a time of weak wage growth, is central to household wealth and the turn higher points squarely to consumer strength. S&P Case-Shiller data, which like FHFA data are very smooth, have yet to show convincing acceleration but a gain looks likely for the next report, to be released Tuesday, May 31st. As sales go, so go prices which are showing new traction. The median price for a new home jumped 7.8 percent in April to a record $321,100 while the year-on-year rate, which was negative in the March report, is now at plus 9.7 percent. But prices in the new home sales report are based on small samples and are subject to big swings from month to month, unlike prices in the FHFA house price report which were also released in the week. The FHFA index for March rose a higher-than-expected 0.7 percent for the best reading since September, with the year-on-year rate jumping a big 5 tenths and over the 6 percent line to 6.1 percent for the best reading since October. Home-price appreciation, during a time of weak wage growth, is central to household wealth and the turn higher points squarely to consumer strength. S&P Case-Shiller data, which like FHFA data are very smooth, have yet to show convincing acceleration but a gain looks likely for the next report, to be released Tuesday, May 31st.
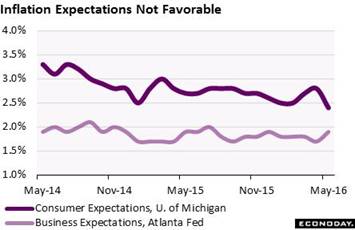 Another positive in the week's data is strength in consumer sentiment which held onto the bulk of its mid-month surge. The consumer sentiment index for May, in yet another example of consumer strength, came in at 94.7 for a very strong 5.7 point rise from April. The expectations component is a standout, up 7.3 points from April to 84.9 for the sharpest monthly gain since May 2013, one that ultimately reflects confidence in the jobs outlook. The current conditions component also added to May's strength, up 3.2 points from April to 109.9. This is the best reading of the whole cycle, since January 2007, and is an unusually strong indication for current spending. But not all the news is good as the 1-year inflation outlook fell another 1 tenth at month's end to 2.4 percent for a major decline of 4 tenths from April. Near-term inflation expectations are typically tied to swings in gasoline prices but not this time as regular this month is up 15 cents to an average $2.30 per gallon. Like the decline underway in business investment, the decline in inflation expectations could very well derail chances for a June hike. Another positive in the week's data is strength in consumer sentiment which held onto the bulk of its mid-month surge. The consumer sentiment index for May, in yet another example of consumer strength, came in at 94.7 for a very strong 5.7 point rise from April. The expectations component is a standout, up 7.3 points from April to 84.9 for the sharpest monthly gain since May 2013, one that ultimately reflects confidence in the jobs outlook. The current conditions component also added to May's strength, up 3.2 points from April to 109.9. This is the best reading of the whole cycle, since January 2007, and is an unusually strong indication for current spending. But not all the news is good as the 1-year inflation outlook fell another 1 tenth at month's end to 2.4 percent for a major decline of 4 tenths from April. Near-term inflation expectations are typically tied to swings in gasoline prices but not this time as regular this month is up 15 cents to an average $2.30 per gallon. Like the decline underway in business investment, the decline in inflation expectations could very well derail chances for a June hike.
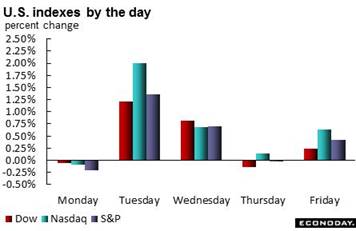 For the markets, the big move in May was already made in Treasuries following the mid-month release of the April FOMC minutes where members were pointing strongly to a June rate hike. The tough talk sent bonds tumbling and short yields spiking. Action in stocks had been contained until this week when buying emerged, sending the Dow up 2.1 percent to end at 17,873. And oil is also rebounding, up nearly $1 and over $49 for WTI which, on Thursday, briefly touched $50 for the first time this year. The move to risk came at the expense of gold which fell a sizable 3.6 percent on the week and, at $1,207, is back near support at the $1,200 mark. Yet gold, along with oil, are showing strong year-to-date gains, at over 30 percent for the latter and nearly percent for the former. This compares with incremental gains for both stocks and the dollar and steep gains for Treasuries. For the markets, the big move in May was already made in Treasuries following the mid-month release of the April FOMC minutes where members were pointing strongly to a June rate hike. The tough talk sent bonds tumbling and short yields spiking. Action in stocks had been contained until this week when buying emerged, sending the Dow up 2.1 percent to end at 17,873. And oil is also rebounding, up nearly $1 and over $49 for WTI which, on Thursday, briefly touched $50 for the first time this year. The move to risk came at the expense of gold which fell a sizable 3.6 percent on the week and, at $1,207, is back near support at the $1,200 mark. Yet gold, along with oil, are showing strong year-to-date gains, at over 30 percent for the latter and nearly percent for the former. This compares with incremental gains for both stocks and the dollar and steep gains for Treasuries.
| Markets at a Glance |
Year-End |
Week Ended |
Week Ended |
Year-To-Date |
Weekly |
|
2015 |
20-May-16 |
27-May-16 |
Change |
Change |
| DJIA |
17,425.03 |
17,500.94 |
17,873.22 |
2.6% |
2.1% |
| S&P 500 |
2,043.94 |
2,052.32 |
2,099.86 |
2.7% |
2.3% |
| Nasdaq Composite |
5,007.41 |
4,769.56 |
4,933.51 |
-1.5% |
3.4% |
|
|
|
|
|
|
| Crude Oil, WTI ($/barrel) |
$37.40 |
$48.50 |
$49.41 |
32.1% |
1.9% |
| Gold (COMEX) ($/ounce) |
$1,060.00 |
$1,252.56 |
$1,207.70 |
13.9% |
-3.6% |
|
|
|
|
|
|
| Fed Funds Target |
0.25 to 0.50% |
0.25 to 0.50% |
0.25 to 0.50% |
0 bp |
0 bp |
| 2-Year Treasury Yield |
1.05% |
0.90% |
0.92% |
–13 bp |
2 bp |
| 10-Year Treasury Yield |
2.27% |
1.85% |
1.85% |
–42 bp |
0 bp |
| Dollar Index |
98.84 |
95.35 |
95.74 |
-3.1% |
0.4% |
A pass at the June FOMC, one based on weakness in business spending and inflation, could trigger a return back into bonds though the possible effects on other markets including stocks are less certain. How the near-term rate outlook plays out could very well be compressed in a matter of minutes, that is the market reaction to Friday's employment report where strength is definitely not the expectation.
Tuesday begins a very busy week following Monday's Memorial Day holiday, opening with personal income and outlays where both are expected to show strength unlike the PCE core inflation index which is expected to remain little changed. Home prices are an increasing positive for the economy but signals from Case-Shiller data, also on Tuesday, are expected to be mixed. ADP's payroll estimate will be posted on Wednesday morning and though forecasters don't put much stock in the report, ADP has been performing much more accurately than most forecasters so far this year. Wednesday will also see the ISM manufacturing report where new orders are always the highlight and also construction spending where gains have been at the very top of the economy. The Beige Book will be posted Wednesday afternoon and will likely offer upgrades for consumer spending and housing in what may raise talk of a June FOMC rate hike. But such talk will depend entirely on Friday's employment report where forecasters are calling for only a 158,000 nonfarm payroll gain, one that, if not accompanied by acceleration in average hourly earnings, could push out rate-hike expectations to the July FOMC.
Personal Income for April
Consensus Forecast, Month-to-Month Change: +0.4%
Consensus Range: +0.3% to +0.6%
Personal Spending
Consensus Forecast: +0.7%
Consensus Range: +0.4% to +0.9%
PCE Price Index
Consensus Forecast: +0.3%
Consensus Range: +0.2% to +0.3%
Core PCE Price Index
Consensus Forecast: +0.2%
Consensus Range: +0.1% to +0.3%
Personal spending is expected to rise a very sharp 0.7 percent in April reflecting the big gain for the month's retail sales report. Personal income is also expected to post a meaningful gain, seen at 0.4 percent to match March's gain. But not expected to show much heat is the FOMC's key inflation gauge, the core PCE price index where the consensus is calling for only a 0.2 percent increase. A weak core index could, as far as FOMC policy goes, offset the expected gains in spending and income.
Case-Shiller, 20-City Adjusted Index for April
Consensus Forecast, Month-to-Month Change: +0.7%
Consensus Range: +0.6% to +0.8%
Case-Shiller, 20-City Unadjusted Index
Consensus Forecast, Year-on-Year Change: +5.1%
Consensus Range: +4.9% to +5.6%
Home price data have been rising sharply, especially the FHFA house price index and price data in both the latest existing and new home sales reports. Forecasters see Case-Shiller's closely watched adjusted 20-city index posting a solid 0.7 percent monthly increase though the year-on-year index is seen contracting to plus 5.1 percent. Home-price appreciation, given weakness in wages, is a major key to household wealth this year.
Chicago PMI for May
Consensus Forecast: 50.7
Consensus Range: 49.0 to 52.2
The Chicago PMI is expected to come in at 50.7, barely over the breakeven 50 level and little changed from April. New orders have been slowing sharply in this often volatile report while backlogs have been in contraction.
Consumer Confidence Index for May
Consensus Forecast: 97.0
Consensus Range: 95.0 to 99.3
The University of Michigan's consumer sentiment index rose sharply in May and strength is also expected for the Conference Board's consumer confidence index which forecasters see rising 2.8 points to 97.0. An upward correction in the jobs-hard-to-get subcomponent, which fell sharply in April, could signal weakness for the May employment report.
Total Vehicle Sales for May
Consensus Forecast, Annualized Rate: 17.4 million
Consensus Range: 17.0 to 17.5 million
Unit vehicle sales jumped 4.8 percent in April, giving a major boost to the month's retail sales report. Unit vehicle sales for May, however, are expected to hold at April's 17.4 million annualized rate which would point to no change for the motor vehicle component of the retail sales report. Yet April's 17.4 million rate is easily beatable, surpassed in eight of the last 11 months.
ADP, Private Payrolls for May
Consensus Forecast: 175,000
Consensus Range: 105,000 to 205,000
The ADP employment report is typically dismissed as being an unreliable gauge for the government's monthly employment report. Yet ADP has been very hot, performing much better than most forecasters and pointing reliably all year to directional shifts in the government's data. Forecasters see weakness in Friday's employment report for May but not weakness for ADP, at a consensus 175,000 vs April's 171,000 for the government's corresponding private payroll reading.
Manufacturing PMI, May Final
Consensus Forecast: 50.5
Consensus Range: 50.4 to 51.1
The manufacturing PMI has slowed to a near standstill, posting a flash May index of 50.5 that was only barely above breakeven 50 and the lowest reading of the economic cycle. Growth in new orders has slowed, inventory inputs are falling, and the sample's production is in outright contraction. Econoday's consensus for the final May reading is unchanged from the flash, at 50.5.
ISM Manufacturing Index for May
Consensus Forecast: 50.6
Consensus Range: 49.9 to 51.0
The ISM manufacturing index proved soft in April at 50.8 but not new orders which, though slowing, still posted a solidly expansionary 55.8. Export orders were also positive, at 52.5 for the best reading of the year. May's consensus is at 50.6 in a result, however, that would not raise expectations for this stubbornly sluggish sector.
Construction Spending for April
Consensus Forecast, Month-to-Month Change: +0.6%
Consensus Range: +0.1% to +0.9%
Construction spending has been positive this year and well ahead of home sales which have only recently been showing strength. Residential construction, up 1.8 percent, was especially strong in March while nonresidential construction rose 0.7 percent. Year-on-year, total construction spending was up 8.0 percent, split between a 7.8 percent gain on the residential side and a 9.3 percent gain on the non-residential side. These were down from 10 percent rates in prior reports but are still very hard to match anywhere else in the economy. Forecasters see the strength continuing with the consensus for April at a monthly plus 0.6 percent.
Beige Book
Prepared for the June FOMC Meeting
Parts of the economy have been picking up steam and are likely to get an upgrade by the Beige Book including consumer spending and home sales. But other areas are still soft especially manufacturing. Inflation has not been moving to the FOMC's 2 percent target which will focus attention on price assessments especially wage growth.
Initial Jobless Claims for May 28 week
Consensus Forecast: 267,000
Consensus Range: 263,000 to 275,000
Initial jobless claims rose sharply in late April and through mid-May but edged back to 268,000 in the May 21 week. Forecaster see initial claims coming in little changed at 267,000 in the May 28 week. The Labor Department has not been citing any special factors in this series but Verizon's strike of 35,100 workers, which has since been resolved, is still a possible wildcard that could drive claims higher.
Nonfarm Payrolls for May
Consensus Forecast: 158,000
Consensus Range: 110,000 to 219,000
Private Payrolls
Consensus Forecast: 150,000
Consensus Range: 105,000 to 211,000
Unemployment Rate
Consensus Forecast: 4.9%
Consensus Range: 4.9% to 5.0%
Average Hourly Earnings
Consensus Forecast: +0.2%
Consensus Range: +0.2% to +0.3%
Average Workweek
Consensus Forecast: 34.5 hours
Consensus Range: 34.4 to 34.5 hours
Nonfarm payrolls slowed to 160,000 in April and no rebound is expected for May where the consensus is at 158,000. Yet the unemployment rate is expected to dip 1 tenth and move back below 5.0 percent at 4.9 percent. This report had been very strong before April as newcomers entered the labor force, but business investment and business confidence have been moving lower and pointing to less need for hiring. Average hourly earnings showed traction in April, up 0.3 percent for a 2.5 percent year-on-year rate, but here forecasters do not see further pressure, at a consensus 0.2 percent monthly gain. If results come in near the consensus, talk may still hold for a July FOMC rate hike but perhaps not for a June hike. Note that the Verizon strike of 35,100 workers has since been resolved but, because of the possible hiring of temporary workers, still may be a wildcard for this report.
International Trade Balance for April
Consensus Forecast: -$41.0 billion
Consensus Range: -$44.0 to -$40.4 billion
The nation's trade deficit is expected to widen slightly in April, to a consensus $41.0 billion vs March's $40.4 billion. Advanced data on goods showed gains for imports, which are a subtraction in the national accounts, that exceeded gains in exports. Still, the gains in both imports and exports are positives for the global outlook, the former pointing to rising foreign demand and the latter to rising domestic demand.
Factory Orders for April
Consensus Forecast, Month-to-Month Change: 2.0%
Consensus Range: +0.3% to +3.0%
Factory orders are expected to rise 2.0 percent in April but the gain is likely to mask significant weakness in capital goods orders, based on the advance durable goods report where core orders fell 0.8 percent for the third decline in a row and the fifth of the last six months. Still, vehicle demand and aircraft demand are positives as may be dollar totals for energy products given oil's price rise during April. The factory orders report includes revised data on durable goods and initial data on non-durable goods.
ISM Non-Manufacturing Index for May
Consensus Forecast: 55.5
Consensus Range: 54.8 to 56.5
The ISM non-manufacturing index is expected to edge lower from 55.7 in April to 55.5 in May to point to steady and solid growth for the great bulk of the nation's economy. New orders were very strong in April, at 59.9 and helping to lift the sample's hiring as employment came in at 53.0 for the best reading of the year. The strength in the April report was a surprise and correctly pointed to improved gains for many subsequent indicators.
|
