|
A European currency realignment has initially raised demand for both the dollar and U.S. bonds, one a negative for the nation's exports but the other lowering interest rates and a plus for overall demand. Another of Brexit's immediate effects is to draw the curtain on pre-Brexit economic data, now a la-la moonscape of helpless unknowing. But let's try hard to block out Brexit, at least for a moment, and instead assess exactly where the economy was when Brexit hit.
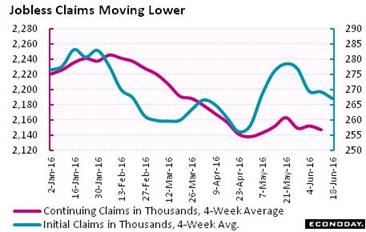 Another thing to block out is May's pathetic 38,000 rise in nonfarm payrolls, one that pulled a June rate hike off the table and triggered a downward shift in FOMC projections. But early indications on last month's labor market are surprisingly good. Jobless claims came down all month and are back at historic lows across the series. Initial claims fell a very sharp 18,000 to 259,000 in the June 18 week -- which importantly is also the sample week for the monthly employment report. The 259,000 for the June sample week compares with 278,000 in the May sample week for a 19,000 decrease while the same comparison for the 4-week average is down nearly 9,000. Lower claims mean that layoffs are down which is a solid indication for the June employment report. And continuing claims are sending the same signal, down 20,000 in lagging data for the June 11 week to a 2.142 million level that is 18,000 below the month-ago comparison. The 4-week average was also down in the week as was the month-ago comparison. The unemployment rate for insured workers held unchanged at 1.6 percent which is very very low. Another thing to block out is May's pathetic 38,000 rise in nonfarm payrolls, one that pulled a June rate hike off the table and triggered a downward shift in FOMC projections. But early indications on last month's labor market are surprisingly good. Jobless claims came down all month and are back at historic lows across the series. Initial claims fell a very sharp 18,000 to 259,000 in the June 18 week -- which importantly is also the sample week for the monthly employment report. The 259,000 for the June sample week compares with 278,000 in the May sample week for a 19,000 decrease while the same comparison for the 4-week average is down nearly 9,000. Lower claims mean that layoffs are down which is a solid indication for the June employment report. And continuing claims are sending the same signal, down 20,000 in lagging data for the June 11 week to a 2.142 million level that is 18,000 below the month-ago comparison. The 4-week average was also down in the week as was the month-ago comparison. The unemployment rate for insured workers held unchanged at 1.6 percent which is very very low.
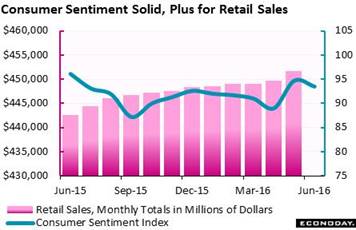 More positives from the past come from the consumer sentiment report where readings in the final June report proved upbeat. The final index did dip a point or so to a roughly 93 pace in the last two weeks of the month, but this is still one of the best readings of the year. The current conditions index, at 110.8, compares with May's 109.9 for a positive indication on June's spending outlook. The expectations component fell 2.5 points to an 82.4 level that, outside of May, is still the best since January. Strength in expectations points to confidence in the jobs outlook. And a special plus in the report is a sudden turn higher for inflation expectations, one that looks like a delayed reaction to gasoline. As for retail sales, they surged in April then added solidly to the gain in May and, based at least on consumer sentiment, are likely to prove solid once more in June. More positives from the past come from the consumer sentiment report where readings in the final June report proved upbeat. The final index did dip a point or so to a roughly 93 pace in the last two weeks of the month, but this is still one of the best readings of the year. The current conditions index, at 110.8, compares with May's 109.9 for a positive indication on June's spending outlook. The expectations component fell 2.5 points to an 82.4 level that, outside of May, is still the best since January. Strength in expectations points to confidence in the jobs outlook. And a special plus in the report is a sudden turn higher for inflation expectations, one that looks like a delayed reaction to gasoline. As for retail sales, they surged in April then added solidly to the gain in May and, based at least on consumer sentiment, are likely to prove solid once more in June.
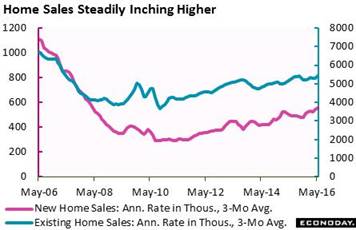 Remember back to the subprime housing boom when new homes were popping up left and right and prices were spiking. Sales in those days peaked at 7 million per year for existing homes and at 1.2 million for new homes. Existing homes are now selling at only three quarters of their subprime pace, at 5.530 million in May. Yet May is a month of special note in this series as the rate, though only modestly above recent readings, is still the best so far this cycle, since February 2007. New home sales are selling at less than half their peak, yet are also making new recovery highs. The trajectory for both is moderate at best, trending in the mid-single digits, but there are benefits to slow growth — reduced risk of over investment and over building. The sector's gains are being driven by the South which is by far housing's largest region. Southern sales of existing homes are up a year-on-year 6.5 percent at a 2.280 million pace (or 41 percent of total existing sales) with sales of new homes in the region up 13.3 percent at a 323,000 pace (27 percent of total new sales). Remember back to the subprime housing boom when new homes were popping up left and right and prices were spiking. Sales in those days peaked at 7 million per year for existing homes and at 1.2 million for new homes. Existing homes are now selling at only three quarters of their subprime pace, at 5.530 million in May. Yet May is a month of special note in this series as the rate, though only modestly above recent readings, is still the best so far this cycle, since February 2007. New home sales are selling at less than half their peak, yet are also making new recovery highs. The trajectory for both is moderate at best, trending in the mid-single digits, but there are benefits to slow growth — reduced risk of over investment and over building. The sector's gains are being driven by the South which is by far housing's largest region. Southern sales of existing homes are up a year-on-year 6.5 percent at a 2.280 million pace (or 41 percent of total existing sales) with sales of new homes in the region up 13.3 percent at a 323,000 pace (27 percent of total new sales).
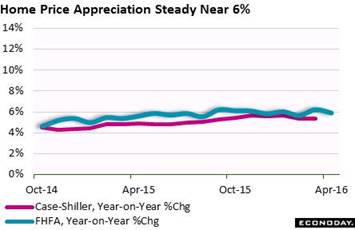 In a time of low wage growth, home price appreciation is central to household health and ultimately the health of personal spending. But here the latest news isn't good. Home builders did enjoy a good month of sales in May but had to give concessions, as the median price for a new home fell 9.3 percent in the month to $290,400 for a very meager year-on-year gain of only 1.0 percent. Prices for existing sales aren't doing much better, up only 4.5 percent on the year. There was also bad news from the FHFA house price report. FHFA's index rose only 0.2 percent in April for the smallest monthly gain since June last year. The year-on-year rate has been skirting 6 percent for the past year and is now back below the line, down 3 tenths at 5.9 percent. But 6 percent is nothing to sneeze at and is actually one of the highest growth rates anywhere in the economy. Case-Shiller is also a closely watched price report with its 20-city sample running well off the 6 percent pace, at 5.4 percent in March's data. Case-Shiller's coming report will be an early highlight of next week's calendar. In a time of low wage growth, home price appreciation is central to household health and ultimately the health of personal spending. But here the latest news isn't good. Home builders did enjoy a good month of sales in May but had to give concessions, as the median price for a new home fell 9.3 percent in the month to $290,400 for a very meager year-on-year gain of only 1.0 percent. Prices for existing sales aren't doing much better, up only 4.5 percent on the year. There was also bad news from the FHFA house price report. FHFA's index rose only 0.2 percent in April for the smallest monthly gain since June last year. The year-on-year rate has been skirting 6 percent for the past year and is now back below the line, down 3 tenths at 5.9 percent. But 6 percent is nothing to sneeze at and is actually one of the highest growth rates anywhere in the economy. Case-Shiller is also a closely watched price report with its 20-city sample running well off the 6 percent pace, at 5.4 percent in March's data. Case-Shiller's coming report will be an early highlight of next week's calendar.
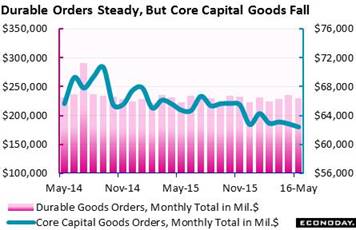 Certainly not a highlight of any calendar are factory reports which have never really shown any boost from this year's prior decline in the dollar (a decline now apparently in Brexit evaporation). May proved to be another weak month for the factory sector with minus signs spread across the durable goods report. Total new orders fell a very sizable 2.2 percent with ex-transportation orders, which exclude aircraft and vehicles, down 0.3 percent. The worst news comes from capital goods, a sector where weakness points to more weakness for business investment and to continuing trouble for the nation's productivity. Orders for core capital goods fell 0.7 percent in the month while shipments, which are inputs into the nonresidential investment component of GDP, fell 0.5 percent. Overall shipments also fell with inventories, due to tight management, in thankful contraction. Vehicles, like they were in the industrial production report, were very weak with orders down 2.8 percent and shipments down 3.4 percent. Certainly not a highlight of any calendar are factory reports which have never really shown any boost from this year's prior decline in the dollar (a decline now apparently in Brexit evaporation). May proved to be another weak month for the factory sector with minus signs spread across the durable goods report. Total new orders fell a very sizable 2.2 percent with ex-transportation orders, which exclude aircraft and vehicles, down 0.3 percent. The worst news comes from capital goods, a sector where weakness points to more weakness for business investment and to continuing trouble for the nation's productivity. Orders for core capital goods fell 0.7 percent in the month while shipments, which are inputs into the nonresidential investment component of GDP, fell 0.5 percent. Overall shipments also fell with inventories, due to tight management, in thankful contraction. Vehicles, like they were in the industrial production report, were very weak with orders down 2.8 percent and shipments down 3.4 percent.
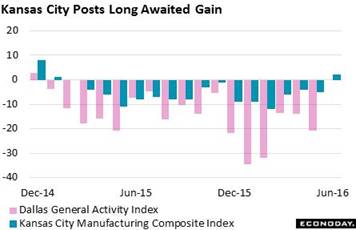 A regular negative for all factory data is weakness in mining & oil field equipment. But there may be better news ahead. The Kansas City manufacturing index doesn't look that great at plus 2 in June, but this is the first positive reading since January last year. The gain reflects a solid increase in production as well as an upturn for new orders. Kansas City like Dallas is at the heart of the energy sector and any emerging strength may hint at less energy-related drag for manufacturing as a whole. The Dallas Fed, whose general activity index has yet to emerge from contraction, will post its June results on Monday, June 27. A regular negative for all factory data is weakness in mining & oil field equipment. But there may be better news ahead. The Kansas City manufacturing index doesn't look that great at plus 2 in June, but this is the first positive reading since January last year. The gain reflects a solid increase in production as well as an upturn for new orders. Kansas City like Dallas is at the heart of the energy sector and any emerging strength may hint at less energy-related drag for manufacturing as a whole. The Dallas Fed, whose general activity index has yet to emerge from contraction, will post its June results on Monday, June 27.
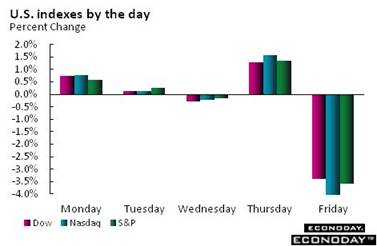 So much for sleeping, it was Brexit Thursday night and Brexit again Friday morning. So much for advanced polling technology and so much for the market's informed ability to position itself for an outcome. U.S. yields fell sharply early in the week then rose suddenly going into the vote. Now of course they are grinding dramatically lower in extremely heavy volume as investors pack themselves into the safety of Treasuries. The Fed's December rate hike, against the year-to-date plunge in yields, looks completely out of place. The 2-year yield, at 0.65 percent, is down 40 full basis points so far this year with the 10-year at 1.57 percent and down 70 basis points. The Fed was looking for rates to go up, not down. The dollar had gone down this year but is now moving up, 1.5 percent higher in the week on the dollar index which is a concrete negative for growth. And gold is surging so we know it's emergency time for everyone. Emergency is also a good word for the stock market as the Dow plunged a very steep 3.4 percent on Friday to turn slightly negative on the year. Even if June payrolls jump and May and April are revised sharply higher, a rate hike at the July FOMC looks impossibly far fetched and a hike at the September looks like an increasing long shot. So much for sleeping, it was Brexit Thursday night and Brexit again Friday morning. So much for advanced polling technology and so much for the market's informed ability to position itself for an outcome. U.S. yields fell sharply early in the week then rose suddenly going into the vote. Now of course they are grinding dramatically lower in extremely heavy volume as investors pack themselves into the safety of Treasuries. The Fed's December rate hike, against the year-to-date plunge in yields, looks completely out of place. The 2-year yield, at 0.65 percent, is down 40 full basis points so far this year with the 10-year at 1.57 percent and down 70 basis points. The Fed was looking for rates to go up, not down. The dollar had gone down this year but is now moving up, 1.5 percent higher in the week on the dollar index which is a concrete negative for growth. And gold is surging so we know it's emergency time for everyone. Emergency is also a good word for the stock market as the Dow plunged a very steep 3.4 percent on Friday to turn slightly negative on the year. Even if June payrolls jump and May and April are revised sharply higher, a rate hike at the July FOMC looks impossibly far fetched and a hike at the September looks like an increasing long shot.
| Markets at a Glance |
Year-End |
Week Ended |
Week Ended |
Year-To-Date |
Weekly |
|
2015 |
17-Jun-16 |
24-Jun-16 |
Change |
Change |
| DJIA |
17,425.03 |
17,675.16 |
17,399.86 |
-0.1% |
-1.6% |
| S&P 500 |
2,043.94 |
2,071.22 |
2,037.30 |
-0.3% |
-1.6% |
| Nasdaq Composite |
5,007.41 |
4,800.34 |
4,707.98 |
-6.0% |
-1.9% |
|
|
|
|
|
|
| Crude Oil, WTI ($/barrel) |
$37.40 |
$48.08 |
$47.62 |
27.3% |
-1.0% |
| Gold (COMEX) ($/ounce) |
$1,060.00 |
$1,301.10 |
$1,321.60 |
24.7% |
1.6% |
|
|
|
|
|
|
| Fed Funds Target |
0.25 to 0.50% |
0.25 to 0.50% |
0.25 to 0.50% |
0 bp |
0 bp |
| 2-Year Treasury Yield |
1.05% |
0.70% |
0.65% |
–40 bp |
–5 bp |
| 10-Year Treasury Yield |
2.27% |
1.61% |
1.57% |
–70 bp |
–4 bp |
| Dollar Index |
98.84 |
94.15 |
95.58 |
-3.3% |
1.5% |
Unfolding outcomes from Brexit, including the initial ones, are not going to be easy to predict to say the least. But the U.S. economy was reasonably fit when it hit, with unemployment very low, the consumer upbeat, and housing demand leading the way. The post-Brexit reality means new priorities and of course a new set of buzz words and phrasings. It also means watching closely for the first Brexit effects as they emerge in the economic data.
Post-Brexit developments will undoubtedly make for swings in what looks to be a turbulent week for the financial markets. The only U.S. data that could pick up possible early Brexit effects will be Thursday's consumer comfort index. Case-Shiller on Tuesday will offer signals on home prices which, despite gains for sales, have been slowing. Pending home sales on Wednesday are expected to extend their steady rise while a gain is also expected for construction spending on Friday. Consumer updates are also expected to be upbeat including personal income & outlays on Wednesday and vehicle sales on Friday. Friday's ISM report won't include any Brexit effects but it will offer a snap shot of the manufacturing sector going into the vote.
International Trade In Goods for May
Consensus Forecast, Month-to-Month Change: -$59.3 billion
Consensus Range: -$55.0 to -$60.7 billion
Exports and imports of goods both rose sharply in April pointing to much needed improvement in cross-border demand. Higher oil prices made for related gains on both sides of the ledger though other areas, including autos and also capital goods also showed gains. Forecasters see a widening in the goods deficit for May, to $59.3 vs $57.5 billion in April.
Real GDP, 1st Quarter, 3rd Estimate, Annualized Rate
Consensus Forecast: +1.0%
Consensus Range: +0.9% to +1.2%
GDP Price Index
Consensus Forecast: +0.6%
Consensus Range: +0.6% to +0.6%
The third estimate for first-quarter GDP is expected to come in at plus 1.0 percent for a 2 tenths gain from the second estimate. Residential investment was the standout in the first quarter, contrasting with sharp weakness in nonresidential investment. Personal consumption expenditures were soft in the quarter as were final sales which were up only 1.0 percent in the second estimate. The GDP price index is seen holding at 0.6 percent.
Case-Shiller, 20-City Adjusted Index for April
Consensus Forecast, Month-to-Month Change: +0.6%
Consensus Range: +0.4% to +0.9%
Case-Shiller, 20-City Unadjusted Index
Consensus Forecast, Year-on-Year Change: +5.5%
Consensus Range: +5.3% to +5.8%
Home price data, after having risen sharply earlier in the year, have been backing down in recent reports, this at the same time that underlying sales have been climbing. Forecasters see only modest slowing for Case-Shiller's closely watched adjusted 20-city index which is expected to post a 0.6 percent monthly increase vs a 0.9 percent gain in the prior report. The year-on-year index is seen rising slightly to plus 5.5 percent. Home-price appreciation, given weakness in wages, is increasingly important to household wealth.
Consumer Confidence Index for June
Consensus Forecast: 93.3
Consensus Range: 90.8 to 95.5
The Conference Board's consumer confidence fell back in May but forecasters see a rebound for June, at a consensus 93.3 vs May's 92.6. May's report was a disappointment but did include some positives including modest improvement in income expectations and a rise in buying plans for homes. This report has not been signaling the same level of recent strength as the consumer sentiment index which is near recovery highs.
Personal Income for May
Consensus Forecast, Month-to-Month Change: +0.3%
Consensus Range: +0.2% to +0.3%
Personal Spending
Consensus Forecast: +0.4%
Consensus Range: +0.2% to +0.5%
PCE Price Index
Consensus Forecast: +0.2%
Consensus Range: +0.2% to +0.2%
Core PCE Price Index
Consensus Forecast: +0.2%
Consensus Range: +0.1% to +0.2%
Personal spending proved exceptionally strong in April and another month of strength is expected for May with forecasters calling for a 0.4 percent increase. Personal income is also expected to post a meaningful gain, of 0.3 percent. Meaningful gains, however, are not expected for the core PCE price index where the consensus is calling for only a 0.2 percent increase.
Pending Home Sales for May
Consensus Forecast, Month-to-Month Change: -1.0%
Consensus Range: -2.4% to +0.1%
Existing home sales are on a slow but solid climb as indicated all along by pending home sales which track contract signings. But pending sales for May are expected to fall back 1.0 percent in a difficult comparison with April's surprising 5.1 percent surge. Housing has been coming alive and strength for this report, apart from an expected headline decline, would point to further strength for the sector.
Initial Jobless Claims for June 25 week
Consensus Forecast: 266,000
Consensus Range: 248,000 to 270,000
Initial jobless claims fell a very sharp 18,000 to a lower-than-expected 259,000 in the June 18 week but little give back is expected in the June 25 week where the consensus is calling for only a 7,000 rise to 266,000 in a result that would confirm labor market strength. Even with a gain, levels of initial claims are very low. Levels of continuing claims are also low. Trends in this report are pointing to favorable results for the June employment report.
Chicago PMI for June
Consensus Forecast: 50.5
Consensus Range: 49.5 to 52.5
The Chicago PMI is expected to come in at 50.5 in June, up 1.2 points from May but barely over the breakeven 50 level. New orders have been weak much of the year and fell into contraction in May with backlog orders also in contraction. Production, employment and inventories were also all in contraction during May.
Total Vehicle Sales for June
Consensus Forecast, Annualized Rate: 17.3 million
Consensus Range: 17.1 to 17.5 million
Unit vehicle sales are expected to move slightly lower in June, down 2 tenths to a consensus 17.3 million annualized rate in what will be the first hard data on consumer demand during June. Right in trend, May's 17.5 million was a very solid rate. Motor vehicles have contributed strongly to retail sales in recent months.
ISM Manufacturing Index for June
Consensus Forecast: 51.5
Consensus Range: 50.0 to 53.0
The ISM manufacturing index is expected to hold steady, at a consensus 51.5 in June vs May's 51.3. New orders were steady and strong in May at 55.7 as were new export orders. May's order strength points to June strength for production and employment.
Construction Spending for May
Consensus Forecast, Month-to-Month Change: +0.6%
Consensus Range: -0.3% to +1.9%
Bouncing back from a 1.8 percent plunge in April, construction spending is expected to rise a consensus 0.6 percent in May. Construction spending has seen bursts of strength this year even though the year-on-year rate is at a 3-year low of only 4.5 percent. But details in this report have been favorable especially an 8.0 percent year-on-year gain for residential spending, the result of strength in both new home sales and also home improvements.
|
