|
Building materials & garden equipment posted some strong numbers in June, if you remember the prior week's retail sales report. Some of this is without a doubt bound to be unloaded at new addresses, whether resales or new homes. Summer is here and the weather isn't the only thing that's been heating up.
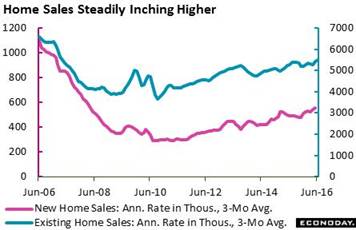 Home sales appear to be coming on inch by inch. Rates are at their highest levels of the cycle and the upward slopes are, by current standards at least, relatively long and steep. Existing home sales rose 1.1 percent in June to a 5.570 million annualized rate which is the best of the cycle, since February 2007. Single-family sales rose a very solid 0.8 percent in the month for a plus 3.1 percent year-on-year rate with condos up 3.2 percent for a 1.6 percent rate. The total year-on-year rate is modest but still constructive at plus 3.0 percent. High levels of employment and low mortgage rates are making for steady incremental gains in housing, gains that appear to be sustainable and tame and far from bubble-like (at least to the eye). New home sales for June will be one of the coming week's highlights, released on Tuesday, July 26. Home sales appear to be coming on inch by inch. Rates are at their highest levels of the cycle and the upward slopes are, by current standards at least, relatively long and steep. Existing home sales rose 1.1 percent in June to a 5.570 million annualized rate which is the best of the cycle, since February 2007. Single-family sales rose a very solid 0.8 percent in the month for a plus 3.1 percent year-on-year rate with condos up 3.2 percent for a 1.6 percent rate. The total year-on-year rate is modest but still constructive at plus 3.0 percent. High levels of employment and low mortgage rates are making for steady incremental gains in housing, gains that appear to be sustainable and tame and far from bubble-like (at least to the eye). New home sales for June will be one of the coming week's highlights, released on Tuesday, July 26.
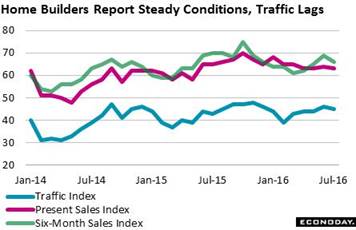 The housing market index, published by the nation's home builders and which offers an advance indication on new home sales, eased slightly in data for July. The composite index slipped 1 point to a 59 level that is still well over 50 to indicate growth, and substantial growth at that. The report's two sales components, present and 6-months out, have been in the mid-60s all year in contrast to the traffic component, which has been lagging in the mid-40s all year. Lack of traffic partly reflects lack of enthusiasm among the young buyers, that is first-time buyers. Likely factors behind their apathy, which has held down the whole cycle by the way, are low wage growth along perhaps with the memory of the price collapse 10 years ago. The housing market index, published by the nation's home builders and which offers an advance indication on new home sales, eased slightly in data for July. The composite index slipped 1 point to a 59 level that is still well over 50 to indicate growth, and substantial growth at that. The report's two sales components, present and 6-months out, have been in the mid-60s all year in contrast to the traffic component, which has been lagging in the mid-40s all year. Lack of traffic partly reflects lack of enthusiasm among the young buyers, that is first-time buyers. Likely factors behind their apathy, which has held down the whole cycle by the way, are low wage growth along perhaps with the memory of the price collapse 10 years ago.
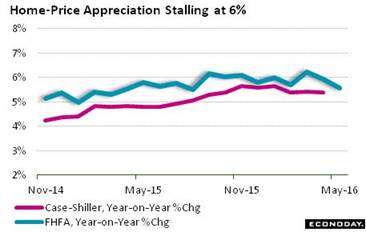 The latest price data on the housing sector have been mixed. Prices for resales have been holding steady, showing mid-single digit year-on-year appreciation. Price data on new home sales, though erratic, are also centered in the mid-single digits. The FHFA house price index has been anchored in mid-to-high single digits ever since breaking down from low double digits in 2014. The index, based on mortgage data handled by the agency, came in very soft in the latest report which is for the month of May. Prices rose only 0.2 percent for the weakest monthly showing since August last year and one of the weakest of the whole cycle. Year-on-year appreciation is sagging at recovery lows, unable to hold 6 percent and at 5.6 percent in May. Two regions in the Northeast -- New England and the Mid-Atlantic -- are the weakest with appreciation both below 4 percent. The two strongest regions are out West -- the Pacific and Mountain where gains are strong but not over the top, at 7.9 and 8.5 percent respectively. In perspective, even mid-single digit appreciation makes it one of the hottest areas of our slow growth, low inflation economy. The latest price data on the housing sector have been mixed. Prices for resales have been holding steady, showing mid-single digit year-on-year appreciation. Price data on new home sales, though erratic, are also centered in the mid-single digits. The FHFA house price index has been anchored in mid-to-high single digits ever since breaking down from low double digits in 2014. The index, based on mortgage data handled by the agency, came in very soft in the latest report which is for the month of May. Prices rose only 0.2 percent for the weakest monthly showing since August last year and one of the weakest of the whole cycle. Year-on-year appreciation is sagging at recovery lows, unable to hold 6 percent and at 5.6 percent in May. Two regions in the Northeast -- New England and the Mid-Atlantic -- are the weakest with appreciation both below 4 percent. The two strongest regions are out West -- the Pacific and Mountain where gains are strong but not over the top, at 7.9 and 8.5 percent respectively. In perspective, even mid-single digit appreciation makes it one of the hottest areas of our slow growth, low inflation economy.
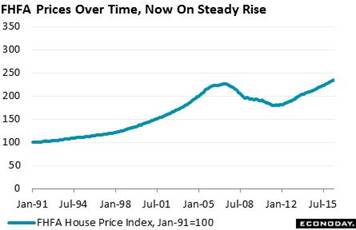 A bit now for the data geeks, the base year for the FHFA index is 1991, when the index equaled 100. The index is currently at 234, up 30 percent from its cycle low in March 2011. The index's prior cycle peak was in August 2006 at 224, a level, after 9 long years, it finally passed late last year. If the current trend continues, price appreciation will likely be wandering the flatlands, that is stuck in the mid-single digits. But that would be an improvement from the last cycle when in 2006, during the subprime onset, the year-on-year rate collapsed, falling from nearly 10 percent in January that year to under 3 percent by December. Watch in the current week for Case-Shiller data on Tuesday, July 26. This index, which tracks repeat transactions, has also been failing at the 6 percent line. A bit now for the data geeks, the base year for the FHFA index is 1991, when the index equaled 100. The index is currently at 234, up 30 percent from its cycle low in March 2011. The index's prior cycle peak was in August 2006 at 224, a level, after 9 long years, it finally passed late last year. If the current trend continues, price appreciation will likely be wandering the flatlands, that is stuck in the mid-single digits. But that would be an improvement from the last cycle when in 2006, during the subprime onset, the year-on-year rate collapsed, falling from nearly 10 percent in January that year to under 3 percent by December. Watch in the current week for Case-Shiller data on Tuesday, July 26. This index, which tracks repeat transactions, has also been failing at the 6 percent line.
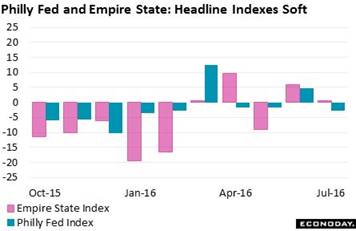 The two most closely watched advance indications on the factory sector are the Empire State and Philly Fed reports. These reports are unusual in that their headline indexes are not composites of differing components but are based on a single question on general business conditions, nothing specific in other words. Other indexes in the reports do measure specific things, like new orders for instance, and can often be telling a different story than the headline indexes. This may be the case right now as the headlines in these reports have been struggling to build momentum after emerging from the deep in March. In perhaps some contrast, the new orders indexes for the two reports have been popping higher including a solid 11.8 performance in July for the Philly Fed. And for my money, strength in new orders far outweighs lack of strength in the assessment of general conditions, if you know what I mean. The two most closely watched advance indications on the factory sector are the Empire State and Philly Fed reports. These reports are unusual in that their headline indexes are not composites of differing components but are based on a single question on general business conditions, nothing specific in other words. Other indexes in the reports do measure specific things, like new orders for instance, and can often be telling a different story than the headline indexes. This may be the case right now as the headlines in these reports have been struggling to build momentum after emerging from the deep in March. In perhaps some contrast, the new orders indexes for the two reports have been popping higher including a solid 11.8 performance in July for the Philly Fed. And for my money, strength in new orders far outweighs lack of strength in the assessment of general conditions, if you know what I mean. 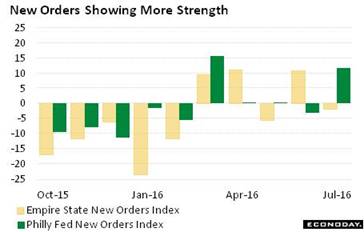 These indications, by the way, are being confirmed by the manufacturing PMI, a national report published by Markit Economics whose flash data for July came in on the strong side, both at the headline level and for new orders. The report notes that strength in new orders is not being accompanied by strength in new export orders which are soft, an assessment that underscores the primary importance of domestic demand. These indications, by the way, are being confirmed by the manufacturing PMI, a national report published by Markit Economics whose flash data for July came in on the strong side, both at the headline level and for new orders. The report notes that strength in new orders is not being accompanied by strength in new export orders which are soft, an assessment that underscores the primary importance of domestic demand.
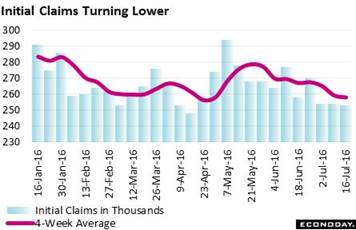 The best news all summer has been coming from the weekly jobless claims report where levels began to break lower at the beginning of June. And the news has been getting better and better as initial claims fell 1,000 in the July 16 week to a 253,000 level that was far below consensus. The 4-week average, down 1,250 to 257,750, is a solid 9,000 below the June 18 week, an important comparison that matches the sample weeks of the monthly employment reports. The indication? Another strong employment report for July. There is, however, one mystery in the report, and that's the absence so far this year of retooling layoffs in the auto sector. When summer retooling does take hold, claims appear certain to rise. The best news all summer has been coming from the weekly jobless claims report where levels began to break lower at the beginning of June. And the news has been getting better and better as initial claims fell 1,000 in the July 16 week to a 253,000 level that was far below consensus. The 4-week average, down 1,250 to 257,750, is a solid 9,000 below the June 18 week, an important comparison that matches the sample weeks of the monthly employment reports. The indication? Another strong employment report for July. There is, however, one mystery in the report, and that's the absence so far this year of retooling layoffs in the auto sector. When summer retooling does take hold, claims appear certain to rise.
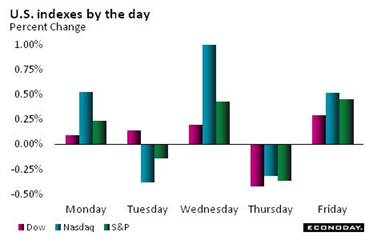 The stock market is making record highs, inch by inch and day by day at a methodical pace. The Dow posted three fractional gains in a row and three new records in a row before fading, ending just off the Wednesday record at 18,595 to finish at 18,570 for a weekly gain of 0.3 percent, not much but still a gain. The good news for the stock market is that there's plenty of money sitting in the bond market earning low rates, money that could shift quickly to stocks should the economy heat up and the profit outlook heat up with it. The bad news is that demand for bonds is getting a lift from risk, whether uncertainty during the presidential election or possible damage to exports, if any, from Brexit. The dollar also continues to climb, up 1.0 percent on the dollar index in the week which shaves year-to-date depreciation, which had been near 5 percent and a benefit to exporters, to only 1.4 percent at week's end. Treasury yields held steady in the week, at 0.70 percent for the 2-year and 1.57 percent for the 10-year. The stock market is making record highs, inch by inch and day by day at a methodical pace. The Dow posted three fractional gains in a row and three new records in a row before fading, ending just off the Wednesday record at 18,595 to finish at 18,570 for a weekly gain of 0.3 percent, not much but still a gain. The good news for the stock market is that there's plenty of money sitting in the bond market earning low rates, money that could shift quickly to stocks should the economy heat up and the profit outlook heat up with it. The bad news is that demand for bonds is getting a lift from risk, whether uncertainty during the presidential election or possible damage to exports, if any, from Brexit. The dollar also continues to climb, up 1.0 percent on the dollar index in the week which shaves year-to-date depreciation, which had been near 5 percent and a benefit to exporters, to only 1.4 percent at week's end. Treasury yields held steady in the week, at 0.70 percent for the 2-year and 1.57 percent for the 10-year.
| Markets at a Glance |
Year-End |
Week Ended |
Week Ended |
Year-To-Date |
Weekly |
|
2015 |
15-Jul-16 |
22-Jul-16 |
Change |
Change |
| DJIA |
17,425.03 |
18,516.55 |
18,570.85 |
6.6% |
0.3% |
| S&P 500 |
2,043.94 |
2,161.74 |
2,175.03 |
6.4% |
0.6% |
| Nasdaq Composite |
5,007.41 |
5,029.59 |
5,100.16 |
1.9% |
1.4% |
|
|
|
|
|
|
| Crude Oil, WTI ($/barrel) |
$37.40 |
$45.95 |
$44.23 |
18.3% |
-3.7% |
| Gold (COMEX) ($/ounce) |
$1,060.00 |
$1,329.00 |
$1,330.70 |
25.5% |
0.1% |
|
|
|
|
|
|
| Fed Funds Target |
0.25 to 0.50% |
0.25 to 0.50% |
0.25 to 0.50% |
0 bp |
0 bp |
| 2-Year Treasury Yield |
1.05% |
0.70% |
0.70% |
–35 bp |
0 bp |
| 10-Year Treasury Yield |
2.27% |
1.57% |
1.57% |
–70 bp |
0 bp |
| Dollar Index |
98.84 |
96.53 |
97.45 |
-1.4% |
1.0% |
Housing is only one plus of the early summer economy. Retail sales, don't forget, posted strong gains in June (up 0.7 percent ex-auto ex-gas) and June nonfarm payrolls surged 287,000 with this month's jobless claims pointing to another month of strength as well. And if the indications from new orders pan out, then the factory sector might even be joining the parade soon. Global demand appears to be only a secondary risk for a consumer-driven domestic-focused economy that may be building steam.
Two highlights will top the week, the first not likely to be much of a highlight at all with expectations uniformly calling for no action at the FOMC meeting. There is some uncertainty, however, to the second highlight: Friday's GDP report where Econoday's second-quarter consensus is calling for solid 2.6 percent growth led by standout strength in consumer spending. Home sales were the prior week's upbeat theme, raising expectations for strength in new home sales on Tuesday and pending home sales on Wednesday. But Wednesday's big news, aside from the FOMC announcement, will be durable goods where no better than mixed results are expected. The employment cost index will be posted on Friday along with GDP and expectations are calling for no more than moderate pressure, probably not enough to boost a still sagging inflation outlook. And expectations will round out the week, that is the final July reading on consumer sentiment which at mid-month, held down by the expectations component, took a definite Brexit dip.
Dallas Fed General Activity Index for July
Consensus Forecast: -12.0
Consensus Range: -16.0 to -2.0
The Dallas Fed general activity index has been deeply depressed reflecting low energy prices. Forecasters see the July index coming in at minus 12.0, deeply negative in what however would be an improvement from June's minus 18.3.
Case-Shiller, 20-City Adjusted Index for May
Consensus Forecast, Month-to-Month Change: +0.4%
Consensus Range: +0.3% to +1.3%
Case-Shiller, 20-City Unadjusted Index
Consensus Forecast, Year-on-Year Change: +5.6%
Consensus Range: +5.3% to +6.3%
Home price data have been flat this year including the closely watched Case-Shiller report where the 20-city adjusted index rose only 0.5 percent in April in what was the lowest result in 7 months. Forecasters see even slightly slower growth for May with the consensus at only 0.4 percent. Year-on-year, the index has been moving back from the 6.0 percent line, coming in at a year-on-year 5.4 percent in April. Forecasters are looking for 5.6 percent in May. Home-price appreciation, given weakness in wages and low returns for savings, is increasingly important to household wealth and consumer spending.
New Home Sales for June
Consensus Forecast, Annualized Rate: 562,000
Consensus Range: 540,000 to 571,000
Small sample sizes often make for enormous monthly swings in new home sales where underlying growth is positive, at nearly a double digit year-on-year pace. For June, forecasters see sales coming in at a 562,000 annualized rate in what would make for a 19 percent on-year rate and a 2.0 percent monthly gain from May. May's rate of 551,000 stands as the second best of the cycle with April's outsized 586,000 at the top. But home builders were giving price concessions to boost sales early in the spring with the median price, in contrast to the healthy gain in sales, barely showing any year-on-year growth at all. Lack of supply has been a major negative in the new home market though more units did enter the market during May.
Consumer Confidence Index for July
Consensus Forecast: 96.0
Consensus Range: 94.0 to 99.0
Reflecting only a limited impact from Brexit, the Conference Board's consumer confidence index is expected fall back to 96.0 in July following June's surprising jump to 98.0. Brexit did appear to have an effect on the consumer sentiment index, a separate report released earlier this month in which the July flash came in much lower than June with weakness centered in the expectations component, weakness that points to less confidence in the jobs outlook. Unlike sentiment, the confidence report offers details on buying plans and any weakness here would further hint at a Brexit impact, however temporary, on consumer spending.
Durable Goods Orders for June
Consensus Forecast, Month-to-Month Change: -1.3%
Consensus Range: -3.6% to +2.0%
Durable Goods Orders, Ex-Transportation
Consensus Forecast: +0.3%
Consensus Range: 0.0% to +0.9%
Durable goods orders have been up and down and a 1.3 percent dip is expected for June following a 2.3 percent drop in May. Capital goods data have been a key weakness in this report, underscoring lack of business investment in new equipment. Always a wildcard in this report is commercial aircraft where orders have been showing some new life after contracting earlier in the year. Vehicle orders have been only slightly stronger. Ex-transportation durable orders are expected to make the plus column, at 0.3 percent.
Pending Home Sales for June
Consensus Forecast, Month-to-Month Change: +1.3%
Consensus Range: +0.2% to +3.0%
Pending home sales fell back in May and are expected to bounce back in June with forecasters calling for a consensus 1.3 percent gain. Final sales of existing homes have been far from robust but, when smoothed out, have been rising gradually and convincingly. Helping to keep sales up have been limited gains in prices. Housing is looking like an increasing, though still only moderate, positive for the overall economy.
Federal Funds Rate Target for July 26 & 27 Meeting:
Consensus Forecast, Midpoint: 0.375%
Consensus Forecast, Range: 0.25% to 0.50%
The Federal funds rate target is firmly expected to remain unchanged at a midpoint of 0.375 percent between a range 0.25 to 0.50 percent, where they were set at the December FOMC and have yet to move. Economic data have been strengthening, especially employment and retail sales, but global risks, centered in Brexit, have firmed expectations that the Fed will not act at this meeting. The September meeting, however, is an open question, especially should the Brexit impact on the U.S. prove limited and the economy continues to build steam.
International Trade In Goods for June
Consensus Forecast, Month-to-Month Change: -$61.1 billion
Consensus Range: -$62.7 to -$60.2 billion
Imports of petroleum, due to this year's upswing in oil prices, have been inflating the nation's goods deficit. When excluding petroleum, goods imports have mostly been on the rise including for consumer goods which, though a subtraction in the national accounts, points squarely at business confidence in U.S. retail expectations. Imports for capital goods, however, have been weak in further evidence of weakness in business confidence. Pointing unmistakably at trouble in global demand is weakness in exports including, like on the import side, for capital goods.
Initial Jobless Claims for July 23 week
Consensus Forecast: 264,000
Consensus Range: 260,000 to 265,000
Initial jobless claims were expected to reverse prior declines and rise sharply in the July 16 week, which they didn't do. But forecasters, awaiting the onset of retooling layoffs in the auto sector, see the rise that didn't hit the prior week hitting the July 23 week, with the consensus at 264,000 which would be an 11,000 rise. Data throughout this report have been making new historical lows this summer.
Real GDP, 2nd Quarter, 1st Estimate, Annualized Rate
Consensus Forecast: +2.6%
Consensus Range: +2.2% to +3.4%
GDP Price Index
Consensus Forecast: +1.8%
Consensus Range: +1.0% to +2.1%
The first estimate for second-quarter GDP is expected to come in at plus 2.6 percent for a sizable gain from first quarter growth of 1.1 percent which was held down by severe weakness in nonresidential fixed investment. Retail sales rose sharply in the second quarter and are expected to feed strong gains for the consumer spending component, offsetting what is expected to be continued weakness in business investment, slowing in residential investment, and slowing in inventory accumulation. The GDP price index, reflecting energy prices, is expected to accelerate sharply, to plus 1.8 percent from 0.4 percent in the first quarter.
Employment Cost Index for 2nd Quarter
Consensus Forecast, Quarter-to-Quarter Change: +0.6%
Consensus Range: +0.5% to +0.9%
Strength in the employment cost index would signal to policy makers that wage inflation may finally be appearing. This report did show relative wage gains in the first quarter though pressure was still no more than moderate. Forecasters see a second straight 0.6 percent rise for the second quarter with the year-on-year rate, at only plus 1.9 percent in the first quarter, likely to get a boost from an easy comparison with last year's unusually weak second quarter.
Chicago PMI for July
Consensus Forecast: 54.0
Consensus Range: 52.0 to 57.0
The Chicago PMI is expected to come in at 54.0 in July, down from June's spike to 56.8. New orders surged in June as did backlog orders, both pointing to July gains for production and perhaps employment as well. This report, which is often volatile month to month, tracks both the manufacturing and non-manufacturing sectors of the Chicago economy.
Consumer Sentiment Index, July Final
Consensus Forecast: 90.6
Consensus Range: 89.5 to 94.8
The consumer sentiment flash for July offered the first evidence of a Brexit effect as the index fell 4.0 points to 89.5. Weakness was centered in the expectations component which posted one of its very weakest readings in two years. Forecasters see only a limited snap back for the final sentiment index, up 1.1 points to 90.6. Such a gain would point to only a brief effect from Brexit, at least initially, and no significant effect on July consumer spending.
|
