|
Janet Yellen sounded very hawkish at week's end, telling a Jackson Hole audience and everyone everywhere for that matter that the U.S. jobs market continues to strengthen and that, and this is a direct quote, "the case for an increase in the federal funds rate has strengthened in recent months." Yes, the presidential election may be just around the quarter but the September Federal Open Market Committee promises to be as "live" a meeting as any this year. And "live" will be an understatement if the August employment report can approach the strength of the 292,000 and 255,000 payroll gains in June and July. Markets, ending a sleepy August week, didn't show much life at all in reaction to Friday's comments from Yellen but this doesn't mean they won't show more life on Monday. Of the week's economic data, two reports stand out for their unusual strength, one from manufacturing and the other from housing.
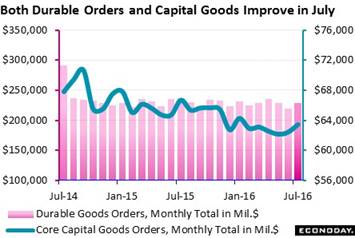 The breadth of its strength is what makes the durable goods report one of the best surprises of the entire year. The headline is sensational enough, a 4.4 percent surge in new orders that in dollar terms translates to a monthly gain of $9.7 billion for the nation's factory sector. A swing higher for aircraft exaggerates the gain excluding which, and also excluding a steady reading for autos, durable orders are still very solid, up a sizable 1.5 percent on the month. This follows two prior months of ex-transportation contraction of 0.3 and 0.5 percent. And very importantly, in fact key for FOMC policy makers, is that the strength includes core capital goods where orders jumped 1.6 percent to show sudden strength for business equipment and machinery. Monthly gains were posted by both primary and fabricated metals and also by computers, electronics, and electrical equipment. All these industries are part of the core capital goods group and are at the heart of the industrial economy, both national and global. The August durable goods report together with the prior week's strong showing for manufacturing in the industrial production report point to second-half possibilities for the U.S. factory sector and its potential contribution to the nation's growth. The breadth of its strength is what makes the durable goods report one of the best surprises of the entire year. The headline is sensational enough, a 4.4 percent surge in new orders that in dollar terms translates to a monthly gain of $9.7 billion for the nation's factory sector. A swing higher for aircraft exaggerates the gain excluding which, and also excluding a steady reading for autos, durable orders are still very solid, up a sizable 1.5 percent on the month. This follows two prior months of ex-transportation contraction of 0.3 and 0.5 percent. And very importantly, in fact key for FOMC policy makers, is that the strength includes core capital goods where orders jumped 1.6 percent to show sudden strength for business equipment and machinery. Monthly gains were posted by both primary and fabricated metals and also by computers, electronics, and electrical equipment. All these industries are part of the core capital goods group and are at the heart of the industrial economy, both national and global. The August durable goods report together with the prior week's strong showing for manufacturing in the industrial production report point to second-half possibilities for the U.S. factory sector and its potential contribution to the nation's growth.
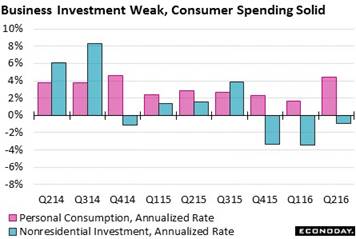 The contribution from nonresidential fixed investment, that is business investment, to second-quarter GDP was in fact no contribution at all but actually a subtraction, declining at a 0.9 percent annualized rate and shaving 0.3 percentage points from the quarter's paltry growth of 1.1 percent, based on updated data from the quarter. In contrast, consumer spending has been holding up GDP this whole cycle and grew at a very formidable 4.4 percent rate in the second quarter. So why is business investment so weak? Investment of course has been held down by deep contraction in the energy and mining sectors which is no surprise given two years of low oil and commodity prices. Yet other reasons, especially given how strong consumer demand is, are hard to pinpoint. Lack of confidence in the general outlook is one explanation as well perhaps as the need for businesses to keep their short-term profits up. But neither profits nor productivity will be getting any long-term help from this cycle's downturn in new equipment and new machinery, a downturn however that, based on the July durable goods report, may hopefully be easing. The contribution from nonresidential fixed investment, that is business investment, to second-quarter GDP was in fact no contribution at all but actually a subtraction, declining at a 0.9 percent annualized rate and shaving 0.3 percentage points from the quarter's paltry growth of 1.1 percent, based on updated data from the quarter. In contrast, consumer spending has been holding up GDP this whole cycle and grew at a very formidable 4.4 percent rate in the second quarter. So why is business investment so weak? Investment of course has been held down by deep contraction in the energy and mining sectors which is no surprise given two years of low oil and commodity prices. Yet other reasons, especially given how strong consumer demand is, are hard to pinpoint. Lack of confidence in the general outlook is one explanation as well perhaps as the need for businesses to keep their short-term profits up. But neither profits nor productivity will be getting any long-term help from this cycle's downturn in new equipment and new machinery, a downturn however that, based on the July durable goods report, may hopefully be easing.
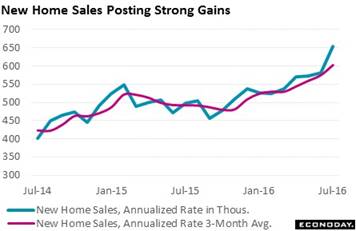 There is another surprise in the latest batch of data, and that's a surge in new home sales which jumped a monthly 12.4 percent in July to a 654,000 annualized rate and which follows cycle highs of 582,000 and 572,000 in the two prior months. And the order of sequence, that is the rise in monthly strength, makes for a nice upward slope on the graph and points to building momentum for the new home sector. But like durable goods, the new home sales report is always very volatile. In fact, the average monthly sales change during this cycle's up months is no less than 5.1 percent and on down months, a nerve-testing minus 5.7 percent. Not only this, but major revisions are routine. Plotting a 3-month average, as seen in the red line of the graph, helps to limit these effects and does confirm substantial strength. This average, currently at 603,000, has been at cycle highs all year and has climbed the last four months in a row. But the strength in sales has yet to be reflected in housing starts or permits or in related construction spending, all of which have been flat. Yet the sales gains do point to future strength for these readings as well as a rebound for residential investment in the GDP report, a component that held down second-quarter growth after a run of strong gains. There is another surprise in the latest batch of data, and that's a surge in new home sales which jumped a monthly 12.4 percent in July to a 654,000 annualized rate and which follows cycle highs of 582,000 and 572,000 in the two prior months. And the order of sequence, that is the rise in monthly strength, makes for a nice upward slope on the graph and points to building momentum for the new home sector. But like durable goods, the new home sales report is always very volatile. In fact, the average monthly sales change during this cycle's up months is no less than 5.1 percent and on down months, a nerve-testing minus 5.7 percent. Not only this, but major revisions are routine. Plotting a 3-month average, as seen in the red line of the graph, helps to limit these effects and does confirm substantial strength. This average, currently at 603,000, has been at cycle highs all year and has climbed the last four months in a row. But the strength in sales has yet to be reflected in housing starts or permits or in related construction spending, all of which have been flat. Yet the sales gains do point to future strength for these readings as well as a rebound for residential investment in the GDP report, a component that held down second-quarter growth after a run of strong gains.
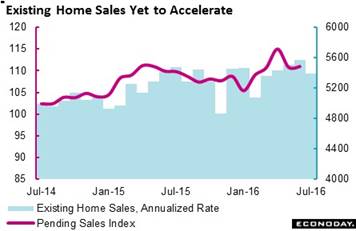 As buyers purchase and move into their new homes, they will of course need to sell their existing homes. And existing home sales need the boost, slowing to a 5.39 million annualized rate in July for a 3.2 percent drop on the month. Holding down sales has been lack of supply in the market, at a very thin 4.7 months at the current sales rate which, after peaking near 6.0 months this time last year, is now as low as it's been all cycle. The lack of punch in existing home sales has been signaled all along by the pending home sales index which tracks contract signings for existing homes. But forecasters see strength ahead for the pending index, looking for a consensus 0.6 percent gain in data to be released Tuesday, August 30. As buyers purchase and move into their new homes, they will of course need to sell their existing homes. And existing home sales need the boost, slowing to a 5.39 million annualized rate in July for a 3.2 percent drop on the month. Holding down sales has been lack of supply in the market, at a very thin 4.7 months at the current sales rate which, after peaking near 6.0 months this time last year, is now as low as it's been all cycle. The lack of punch in existing home sales has been signaled all along by the pending home sales index which tracks contract signings for existing homes. But forecasters see strength ahead for the pending index, looking for a consensus 0.6 percent gain in data to be released Tuesday, August 30.
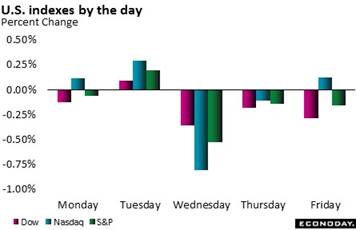 The lack of movement, any significant movement, even initial movement, to what are solid news-making headlines from no one less than Janet Yellen herself is perhaps explainable. Markets have been mostly flat this whole month. Out of the 20 closes so far this month, 12 have seen the Dow post a plus or minus change of 0.2 percent or less. The loss on Friday, following Yellen's headlines, was 0.3 percent which for this month is practically an outlier. There is still one week to go before the long Labor Day weekend after which trading desks will be fully staffed yet Friday's employment report for August, whatever the result, is guaranteed to cause a stir of some kind. The lack of movement, any significant movement, even initial movement, to what are solid news-making headlines from no one less than Janet Yellen herself is perhaps explainable. Markets have been mostly flat this whole month. Out of the 20 closes so far this month, 12 have seen the Dow post a plus or minus change of 0.2 percent or less. The loss on Friday, following Yellen's headlines, was 0.3 percent which for this month is practically an outlier. There is still one week to go before the long Labor Day weekend after which trading desks will be fully staffed yet Friday's employment report for August, whatever the result, is guaranteed to cause a stir of some kind.
| Markets at a Glance |
Year-End |
Week Ended |
Week Ended |
Year-To-Date |
Weekly |
|
2015 |
19-Aug-16 |
26-Aug-16 |
Change |
Change |
| DJIA |
17,425.03 |
18,552.57 |
18,395.40 |
5.6% |
-0.8% |
| S&P 500 |
2,043.94 |
2,183.87 |
2,169.04 |
6.1% |
-0.7% |
| Nasdaq Composite |
5,007.41 |
5,238.38 |
5,218.92 |
4.2% |
-0.4% |
|
|
|
|
|
|
| Crude Oil, WTI ($/barrel) |
$37.40 |
$48.39 |
$47.31 |
26.5% |
-2.2% |
| Gold (COMEX) ($/ounce) |
$1,060.00 |
$1,348.00 |
$1,324.30 |
24.9% |
-1.8% |
|
|
|
|
|
|
| Fed Funds Target |
0.25 to 0.50% |
0.25 to 0.50% |
0.25 to 0.50% |
0 bp |
0 bp |
| 2-Year Treasury Yield |
1.05% |
0.76% |
0.85% |
–20 bp |
9 bp |
| 10-Year Treasury Yield |
2.27% |
1.58% |
1.63% |
–64 bp |
5 bp |
| Dollar Index |
98.84 |
94.52 |
95.46 |
-3.4% |
1.0% |
Manufacturing may finally be coming alive for the 2016 economy while housing, driven by new home sales, may soon be accelerating. These would be additional pluses for a consumer-driven economy that may soon require, at least as far as the FOMC is concerned, a further withdrawal of stimulus -- in other words a September rate hike! By the way, odds in the Treasury market are about 1 in 3 right now for a hike in September and about 1 in 2 for a hike at the November FOMC. And if the August employment report proves solid, with say 200,000 nonfarm payroll growth, these odds could go up fast.
175,000 is Econoday's consensus for August nonfarm payroll growth which would follow July's 255,000 gain and June's outsized jump of 292,000. The high end estimate is 215,000 which would be well over 200,000 and more than enough to raise the odds for a September FOMC rate hike. Data going into Friday's report will offer the latest on existing homes with the pending home sales report and an August update on manufacturing with the ISM report, both on Tuesday. Construction spending will also be out on Tuesday and pent-up strength is expected.
Personal Income for July
Consensus Forecast, Month-to-Month Change: +0.4%
Consensus Range: +0.3% to +0.6%
Consumer Spending
Consensus Forecast: +0.3%
Consensus Range: +0.2% to +0.4%
PCE Price Index
Consensus Forecast: 0.0%
Consensus Range: 0.0% to +0.1%
Core PCE Price Index
Consensus Forecast: +0.1%
Consensus Range: +0.1% to +0.3%
Accelerating strength in consumer spending is not expected for July, which forecasters see coming in at plus 0.3 percent vs a 0.4 percent gain for June. But greater strength, at plus 0.4 percent, is expected for personal income in what would be a reversal of the undersized gains in the two prior months. Strength once again is not expected for either the PCE price index nor the core PCE price index where forecasters are calling for no change and a 0.1 percent gain.
Case-Shiller, 20-City Adjusted Index for June
Consensus Forecast, Month-to-Month Change: +0.1%
Consensus Range: -0.2% to +0.9%
Case-Shiller, 20-City Unadjusted Index
Consensus Forecast, Year-on-Year Change: +5.2%
Consensus Range: +4.8% to +5.5%
Home price data are turning lower including Case-Shiller where the 20-city adjusted index fell 0.1 percent in May. Only a very small monthly rebound is expected for June with the consensus at plus 0.1 percent. The outlook for the year-on-year rate is flat, unchanged at 5.2 percent. FHFA data for June were noticeably soft as have been more recent data from the new home and existing home sales reports.
Consumer Confidence Index for August
Consensus Forecast: 97.3
Consensus Range: 94.5 to 98.3
The Conference Board's consumer confidence index jumped 5 points in June and then held steady in July, dipping only slightly to 97.3. The jobs-hard-to-get reading fell sharply to accurately foreshadow the solid strength of the July employment report. Neither Brexit nor the presidential election have to yet to have a major impact on confidence. A negative has been the report's reading on inflation expectations which has been very low. Forecasters see the confidence index unchanged in August at 97.3.
ADP, Private Payrolls for August
Consensus Forecast: 175,000
Consensus Range: 145,000 to 190,000
ADP employment has been accurately predicting gains all year, including in July when its 165,000 estimate for private payrolls, though under the actual 217,000 gain, pointed to lower but still solid growth from the prior month. ADP's call for August is 175,000 in what would also be a solid gain.
Chicago PMI for August
Consensus Forecast: 55.2
Consensus Range: 53.0 to 56.3
The Chicago PMI posted solid back-to-back scores of 55.8 and 56.8 in July and June with 55.2 the consensus for August. New orders were very strong in June but not in July which does raise general downside risk for the August report. This report tracks both the manufacturing and non-manufacturing sectors of the Chicago economy.
Pending Home Sales Index for July
Consensus Forecast, Month-to-Month Change: +0.6%
Consensus Range: -1.8% to +1.4%
Pending home sales were weak in June and May in line with what proved to be a soft July for final sales of existing homes. But prices have been coming down and new home sales have been strong both of which point to further sales gains for existing homes. Forecasters see pending sales rising 0.6 percent in the month following June's 0.2 percent gain and May's steep 3.7 percent decline.
Total Vehicle Sales for August
Consensus Forecast, Annualized Rate: 17.1 million
Consensus Range: 17.0 to 17.5 million
Unit vehicle sales are expected to come down sharply from July's very strong 17.9 million annualized rate, to a consensus 17.1 million. The expected decline would point to month-to-month slowing for motor vehicles in the August retail sales report, a component that makes up 20 percent of total retail sales. Vehicle sales, unlike 2015, have not been a central strength of the 2016 economy.
Initial Jobless Claims for August 27 week
Consensus Forecast: 265,000
Consensus Range: 263,000 to 287,000
Initial jobless claims are expected to hold steady in the August 27 week, at a consensus 265,000 vs 261,000 in the prior week and in line with the 4-week average of 264,000. Readings throughout this report have been consistently low and pointing to low levels of layoffs and healthy conditions in the labor market.
Non-Farm Productivity, 2nd Estimate, Second Quarter
Consensus Forecast, Annualized Rate: -0.6%
Consensus Range: -0.7% to -0.3%
Unit Labor Costs
Consensus Forecast, Annualized Rate: +2.1%
Consensus Range: +1.9% to +3.8%
Second estimate for second-quarter non-farm productivity is expected to hold little changed, at a minus 0.6 percent annualized rate with unit labor costs also little changed, at plus 2.1 percent. Workers are producing more but it's taking them longer and longer to do it, largely reflecting reluctance among businesses to invest in new equipment. Expectations for faster GDP growth point to improvement in productivity for the third quarter.
ISM Manufacturing Index for August
Consensus Forecast: 52.2
Consensus Range: 51.3 to 53.0
The ISM manufacturing index is expected to hold steady at a moderate 52.2 in August in what, based at least on prior reports, could perhaps mask a much stronger gain for new orders. This component has been trending in the high 50s range which points to extended strength for other readings including production, which has in fact been strong in this report, and employment which however has been weak.
Construction Spending for June
Consensus Forecast, Month-to-Month Change: +0.6%
Consensus Range: +0.3% to +1.0%
Construction spending is expected to bounce back in June, up a consensus 0.6 percent following steep declines in the two prior months of minus 0.8 percent and minus 2.0 percent. Construction spending on non-housing has been soft but spending on housing has been steadily climbing. Recent strength in housing starts is a positive indication for this report.
Nonfarm Payrolls for July
Consensus Forecast: 175,000
Consensus Range: 125,000 to 215,000
Private Payrolls
Consensus Forecast: 179,000
Consensus Range: 100,000 to 195,000
Unemployment Rate
Consensus Forecast: 4.8%
Consensus Range: 4.8% to 4.9%
Average Hourly Earnings
Consensus Forecast: +0.2%
Consensus Range: 0.0% to +0.3%
Average Workweek
Consensus Forecast: 34.5 hours
Consensus Range: 34.4 to 34.5 hours
At a consensus 175,000 in August, nonfarm payrolls are expected to fall back from strong gains of 255,000 in July and 292,000 in June. But even at the lower level, growth would still be consistent with strength in the labor market. In another sign of strength, the unemployment rate is expected to dip 1 tenth to 4.8 percent but, in an offset, average hourly earnings are expected to slip 1 tenth to a modest 0.2 percent.
International Trade Balance for July
Consensus Forecast: -$41.3 billion
Consensus Range: -$43.5 to -$38.8 billion
The nation's trade deficit is expected to narrow sharply in July, to a consensus $41.3 billion vs June's $44.5 billion. Advanced data on July goods trade showed a large increase in exports together with a sizable decrease in imports. Note that this will be an early reading for quarterly net exports and may lead to adjustments in third-quarter GDP estimates.
Factory Orders for July
Consensus Forecast, Month-to-Month Change: +2.0%
Consensus Range: +0.2% to +2.8%
Factory orders are expected to rise 2.0 percent in July as the advance release of a 3.7 percent jump in the durables component is expected to be offset by oil-related price weakness for nondurables. A bounce higher for capital goods orders was a highlight of the durables report.
|
