|
The economy is on the move higher, at least most readings. Employment growth is sizable and continues to support the economy's central pillar which, you guessed it, is consumer spending. But there's one piece missing and that's inflation.
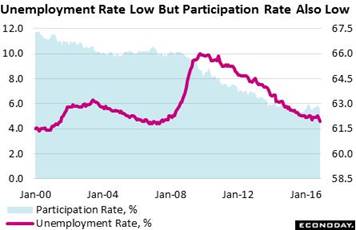 A positive for the outlook is the continuing growth of the labor market which, for nonfarm payrolls, rose 178,000 in November. This is right at 2016's average of 180,000 and is probably strong relative to what's left of the available labor force. And this is where the trouble starts for the November report as the labor force participation rate, after flirting with 63 percent in August, has fallen two months in a row and at 62.7 percent is back where it was in June. It was contraction in the labor market that made for strong improvement in the unemployment rate, down 3 tenths to 4.6 percent and now unquestionably at the Fed's long-term goal. We may now, based on the prevailing definitions, fairly consider ourselves to be at full employment (and inside what is supposed to be the inflation-flash zone by the way). The graph tracks the last two cycles for the unemployment rate along with the long-term decline in the participation rate, which peaked way up at 67.3 percent at the height of the dotcom bubble. A positive for the outlook is the continuing growth of the labor market which, for nonfarm payrolls, rose 178,000 in November. This is right at 2016's average of 180,000 and is probably strong relative to what's left of the available labor force. And this is where the trouble starts for the November report as the labor force participation rate, after flirting with 63 percent in August, has fallen two months in a row and at 62.7 percent is back where it was in June. It was contraction in the labor market that made for strong improvement in the unemployment rate, down 3 tenths to 4.6 percent and now unquestionably at the Fed's long-term goal. We may now, based on the prevailing definitions, fairly consider ourselves to be at full employment (and inside what is supposed to be the inflation-flash zone by the way). The graph tracks the last two cycles for the unemployment rate along with the long-term decline in the participation rate, which peaked way up at 67.3 percent at the height of the dotcom bubble.
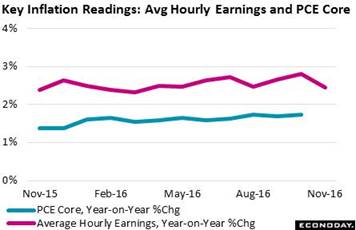 Lack of participation is only one oddity of the November report. Average hourly earnings, which should be going up during full employment, are going down, at least they did in November though just barely at a 0.1 percent monthly decline. This dip, the first of the year, not only makes a distant memory of a jump in October but it also pulls down the year-on-year rate very sharply, to 2.5 percent from a cycle high (but still subdued) 2.8 percent. The doves on the FOMC want to see inflation pressures actually building before hiking rates, not easing. Released earlier in the week was the October update for the Fed's target inflation rates, the PCE and PCE core (part of the personal income & outlays report). Unlike hourly earnings in November, the PCE price readings did move forward, but again that was data for October not November. Lack of participation is only one oddity of the November report. Average hourly earnings, which should be going up during full employment, are going down, at least they did in November though just barely at a 0.1 percent monthly decline. This dip, the first of the year, not only makes a distant memory of a jump in October but it also pulls down the year-on-year rate very sharply, to 2.5 percent from a cycle high (but still subdued) 2.8 percent. The doves on the FOMC want to see inflation pressures actually building before hiking rates, not easing. Released earlier in the week was the October update for the Fed's target inflation rates, the PCE and PCE core (part of the personal income & outlays report). Unlike hourly earnings in November, the PCE price readings did move forward, but again that was data for October not November.
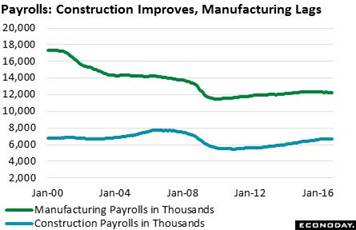 One of the positive surprises of the employment report was clearly signaled at mid-week with the Beige Book which highlighted a rise underway in construction. Construction payrolls rose 19,000 for a third solid gain in a row, a contrast however to factory payrolls which fell 4,000 for a fourth straight decline. The graph tracks the long-term path for both industries with construction, at 6.7 million, gaining more than 1 million jobs over the current cycle but still below the nearly 8 million peak of the prior cycle. Factory payrolls, at 12.3 million, are up not quite 1 million over the current cycle with the slope, though only marginally higher, still doing better than the extended decline of the prior cycle. One sector to watch for the holidays is retail, down 8,000 for a second straight decline and suggesting that stores haven't geared up as much as usual for the holiday shopping season, a factor however tied less perhaps to expectations for sales and more to growth in online shopping and perhaps a lower need for labor. One of the positive surprises of the employment report was clearly signaled at mid-week with the Beige Book which highlighted a rise underway in construction. Construction payrolls rose 19,000 for a third solid gain in a row, a contrast however to factory payrolls which fell 4,000 for a fourth straight decline. The graph tracks the long-term path for both industries with construction, at 6.7 million, gaining more than 1 million jobs over the current cycle but still below the nearly 8 million peak of the prior cycle. Factory payrolls, at 12.3 million, are up not quite 1 million over the current cycle with the slope, though only marginally higher, still doing better than the extended decline of the prior cycle. One sector to watch for the holidays is retail, down 8,000 for a second straight decline and suggesting that stores haven't geared up as much as usual for the holiday shopping season, a factor however tied less perhaps to expectations for sales and more to growth in online shopping and perhaps a lower need for labor.
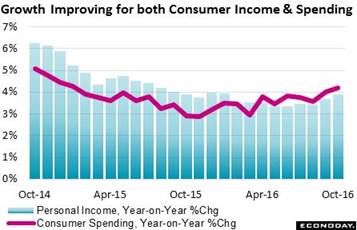 November was no doubt a very bad month for hourly earnings but October was definitely a very good month, at an unrevised 0.4 percent gain. Separate October data for personal income showed a very strong 0.6 percent monthly gain including a second straight 0.5 percent rise for the wages & salaries component. Year-on-year, personal income has been moving steadily to the 4 percent line with consumer spending moving higher in line and now just past the 4 percent line. November data, however, aren't pointing to continued gains as hourly earnings will pull down on income and as vehicle sales (we'll get to this in a minute) won't be giving any boost to spending. November was no doubt a very bad month for hourly earnings but October was definitely a very good month, at an unrevised 0.4 percent gain. Separate October data for personal income showed a very strong 0.6 percent monthly gain including a second straight 0.5 percent rise for the wages & salaries component. Year-on-year, personal income has been moving steadily to the 4 percent line with consumer spending moving higher in line and now just past the 4 percent line. November data, however, aren't pointing to continued gains as hourly earnings will pull down on income and as vehicle sales (we'll get to this in a minute) won't be giving any boost to spending.
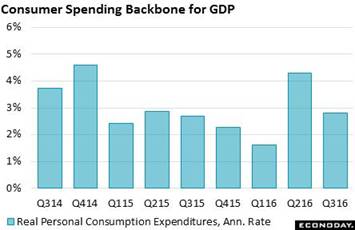 Looking at data month-to-month brings out volatility, suggesting that numbers for October and November are best averaged together. Having perspective is also very important as data going into the current quarter were mostly favorable. The second estimate for third-quarter GDP included a sizable upgrade for consumer spending, up 7 tenths to an annualized and inflation-adjusted 2.8 percent. This is down from the second-quarter's 4.3 percent rate but the average of these two are the best in nearly two years. Hourly earnings may have been weak in November but trends nevertheless point to only one thing: a consumer who has a job and is spending. Looking at data month-to-month brings out volatility, suggesting that numbers for October and November are best averaged together. Having perspective is also very important as data going into the current quarter were mostly favorable. The second estimate for third-quarter GDP included a sizable upgrade for consumer spending, up 7 tenths to an annualized and inflation-adjusted 2.8 percent. This is down from the second-quarter's 4.3 percent rate but the average of these two are the best in nearly two years. Hourly earnings may have been weak in November but trends nevertheless point to only one thing: a consumer who has a job and is spending.
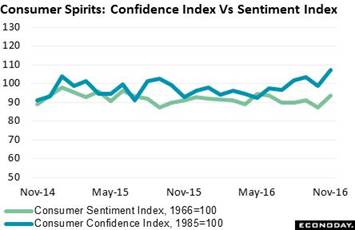 Moving now to the very present, readings on the consumer's assessment of conditions are shooting higher. The University of Michigan's consumer sentiment index for November jumped 6.6 points to a six-month high while the Conference Board's consumer confidence index jumped 6.3 points to 107.1 for its best reading of the cycle, since July 2007. An interesting pattern in the Conference Board's data is a big reduction in the sample's pessimism, that is wide declines in the proportion of respondents offering the most negative assessments. In contrast, the proportion of optimists, those offering the most positive assessments, shows only marginal improvement. Moving now to the very present, readings on the consumer's assessment of conditions are shooting higher. The University of Michigan's consumer sentiment index for November jumped 6.6 points to a six-month high while the Conference Board's consumer confidence index jumped 6.3 points to 107.1 for its best reading of the cycle, since July 2007. An interesting pattern in the Conference Board's data is a big reduction in the sample's pessimism, that is wide declines in the proportion of respondents offering the most negative assessments. In contrast, the proportion of optimists, those offering the most positive assessments, shows only marginal improvement.
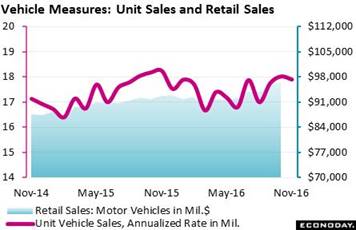 This lack of pessimism during November, however, didn't quite result in month-to-month strength for vehicle sales. At least this is true with unit sales where business sales and consumer sales however are clumped together which, as seen in the bulging area of the accompanying graph, can cloud what to expect for the retail sales report. Unit vehicle sales fell in November but only modestly to a 17.9 million annualized rate. Though the level is strong, the month-to-month comparison is not a signal of strength for the motor vehicle component of the government's retail sales report which had posted two very sharp gains in October and September, roughly $98 billion per month as seen on the graph. Yet even a small step back for vehicle sales in November won't diminish what represents a very strong vote of confidence by the consumer -- buying new wheels. This lack of pessimism during November, however, didn't quite result in month-to-month strength for vehicle sales. At least this is true with unit sales where business sales and consumer sales however are clumped together which, as seen in the bulging area of the accompanying graph, can cloud what to expect for the retail sales report. Unit vehicle sales fell in November but only modestly to a 17.9 million annualized rate. Though the level is strong, the month-to-month comparison is not a signal of strength for the motor vehicle component of the government's retail sales report which had posted two very sharp gains in October and September, roughly $98 billion per month as seen on the graph. Yet even a small step back for vehicle sales in November won't diminish what represents a very strong vote of confidence by the consumer -- buying new wheels.
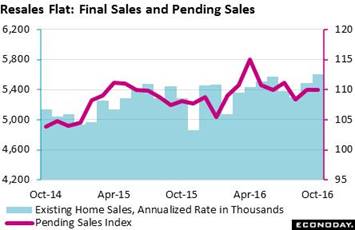 The ongoing rise in long-term interest rates (that is the big selloff underway in the bond market) isn't likely to increase mortgage banker activity. The average 30-year rate for conforming mortgages ($417,000 of less) was 3.77 percent in mortgage banker data for the week ended November 4. The latest data for the week of November 25 put the rate at 4.23 percent. That's more than 50 points in three weeks, a spike that has already pulled down refinancing activity and is very likely to begin pulling down purchase activity soon. Keep this in mind when looking at the accompanying graph which tracks resales, both contract signings for existing homes and final sales. Sales were already on the flat side going into November's mortgage-rate spike. The ongoing rise in long-term interest rates (that is the big selloff underway in the bond market) isn't likely to increase mortgage banker activity. The average 30-year rate for conforming mortgages ($417,000 of less) was 3.77 percent in mortgage banker data for the week ended November 4. The latest data for the week of November 25 put the rate at 4.23 percent. That's more than 50 points in three weeks, a spike that has already pulled down refinancing activity and is very likely to begin pulling down purchase activity soon. Keep this in mind when looking at the accompanying graph which tracks resales, both contract signings for existing homes and final sales. Sales were already on the flat side going into November's mortgage-rate spike.
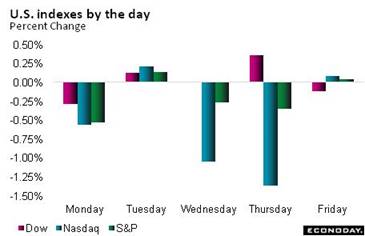 Oil was the week's big news, jumping $5-1/2 and over $51 on an OPEC production-cut agreement. Member adherence to supply cuts is always a question for OPEC while the demand side is a question in itself as the economic outlooks for Europe and Asia are no better than flat. The Dow, ending at 19,170, was little changed in the week but broader measures weakened including a sharp 2.7 percent decline in the Nasdaq in an indication perhaps of froth in technology shares. Rates held steady in the week, though nerves in the bond market are still touchy, while strength in the dollar eased slightly in what is welcome news for a factory sector growing touchy about a strong currency. Oil was the week's big news, jumping $5-1/2 and over $51 on an OPEC production-cut agreement. Member adherence to supply cuts is always a question for OPEC while the demand side is a question in itself as the economic outlooks for Europe and Asia are no better than flat. The Dow, ending at 19,170, was little changed in the week but broader measures weakened including a sharp 2.7 percent decline in the Nasdaq in an indication perhaps of froth in technology shares. Rates held steady in the week, though nerves in the bond market are still touchy, while strength in the dollar eased slightly in what is welcome news for a factory sector growing touchy about a strong currency.
| Markets at a Glance |
Year-End |
Week Ended |
Week Ended |
Year-To-Date |
Weekly |
|
2015 |
25-Nov-16 |
2-Dec-16 |
Change |
Change |
| DJIA |
17,425.03 |
19,152.14 |
19,170.63 |
10.0% |
0.1% |
| S&P 500 |
2,043.94 |
2,213.35 |
2,191.97 |
7.2% |
-1.0% |
| Nasdaq Composite |
5,007.41 |
5,398.92 |
5,255.65 |
5.0% |
-2.7% |
|
|
|
|
|
|
| Crude Oil, WTI ($/barrel) |
$37.40 |
$46.06 |
$51.59 |
37.9% |
12.0% |
| Gold (COMEX) ($/ounce) |
$1,060.00 |
$1,181.00 |
$1,177.20 |
11.1% |
-0.3% |
|
|
|
|
|
|
| Fed Funds Target |
0.25 to 0.50% |
0.25 to 0.50% |
0.25 to 0.50% |
0 bp |
0 bp |
| 2-Year Treasury Yield |
1.05% |
1.11% |
1.12% |
7 bp |
1 bp |
| 10-Year Treasury Yield |
2.27% |
2.36% |
2.40% |
13 bp |
4 bp |
| Dollar Index |
98.84 |
101.34 |
100.7 |
1.9% |
-0.6% |
Pulling discouraged workers back into the labor force has been a key reason the doves have been arguing against a rate hike this year. Based on the participation rate, however, discouraged workers aren't showing much encouragement. On firmer ground, the doves can argue for more patience based on the lack of wage pressures. But given prospects of future fiscal stimulus together with the ongoing strength of the consumer, a rate hike at the mid-month policy meeting is (in the language of matters like this) a probable certainty.
ISM non-manufacturing, a report that has shown consistent strength this year, opens the week on Monday and forecasters are expecting solid growth. But in a negative for GDP, data on Tuesday are expected to show a significant widening in October's trade gap. Factory orders are also out on Tuesday and here a rare burst of strength is expected. The week closes with two reports that have been pointing to strength, jobless claims on Thursday and an early December reading on consumer sentiment which forecasters see extending November's unusual strength.
ISM Non-Manufacturing Index for November
Consensus Forecast: 55.5
Consensus Range: 54.9 to 56.5
The ISM non-manufacturing report has been pointing to solid and steady conditions most of the year, including the last report for October where the composite index came in at 54.8. New orders and also business activity, both at 57.7, were highlights of the report but not employment which fell sharply to what however was a still respectable 53.1. The Econoday consensus for the November composite is 55.5.
International Trade Balance for October
Consensus Forecast: -$42.0 billion
Consensus Range: -$44.0 to -$39.0 billion
September's odd swing higher for soybean exports made a tough comparison for October's advance data on the nation's goods balance where the deficit widened by $5.5 billion to $62.0 billion. But there were positives in the October advance report including a gain for capital goods imports which is a favorable sign for business investment. The trade balance for October, which will include data on services, is expected to come in at $42.0 in October vs September's $36.4 billion.
Non-Farm Productivity, 2nd Estimate, Third Quarter
Consensus Forecast, Annualized Rate: +3.3%
Consensus Range: +2.9% to +3.3%
Unit Labor Costs
Consensus Forecast, Annualized Rate: +0.3%
Consensus Range: +0.0% to +1.3%
Non-farm productivity jumped out of its slump in the third quarter, boosted by a doubling in the rate of output growth together with a sharp slowing in the growth of hours worked. For labor costs, high output and low hours held down pressures. The second estimate for third-quarter productivity is expected to come in at 3.3 percent, vs 3.1 percent in the first estimate, with unit labor costs seen holding at plus 0.3 percent.
Factory Orders for October
Consensus Forecast, Month-to-Month Change: +2.7%
Consensus Range: +2.5% to +3.4%
Factory orders for October are expected to rise 2.7 percent in line with strong gains for durable goods, data for the latter released a week earlier and offering rare good news for the struggling factory sector. Factory shipments have been holding up but at the expense of unfilled orders which have contracted for four straight months.
Consumer Credit for October
Consensus Forecast: +$19.0 billion
Consensus Range: +$15.5 to +$19.0 billion
Consumer credit is expected to rise $19.0 billion in October in line with September's increase of $19.3 billion. Revolving credit has been climbing steadily this year but non-revolving credit remains the report's main source of growth, underpinned by student loans and also reflecting solid demand for vehicle financing.
Initial Jobless Claims for December 3 week
Consensus Forecast: 255,000
Consensus Range: 250,000 to 262,000
Initial jobless claims have been up and down the past several weeks and are expected to fall back 13,000 in the December 3 week to an in-trend 255,000. Initial claims as well as continuing claims have been tracking at historic lows all year and pointing to healthy conditions in the labor market.
Consumer Sentiment Index, Preliminary December
Consensus Forecast: 94.1
Consensus Range: 92.8 to 98.0
Consumer sentiment jumped in November following the November 8 election and forecasters see no retreat for the preliminary December index, to a consensus 94.1 vs a final November reading of 93.8 and a preliminary November score, which did not include the effects of the election, of 91.6.
Wholesale Inventories for October
Consensus Forecast, Month-to-Month Change: -0.4%
Consensus Range: -0.4% to +0.3%
Wholesale inventories are expected to fall 0.4 percent in October in line with the month's advance estimate. Over the last year, wholesale inventories have been flat, in balance with what have been soft sales for the wholesale sector.
|
