|
Confidence may be sky high but holiday spending really wasn't that great, unless you count cars and light trucks as gifts. The week's news as a whole is mixed, pointing to no year-end pop for the 2016 economy and perhaps to lack of momentum for the early 2017 economy.
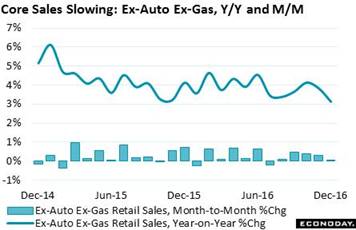 Core retail sales, which exclude both autos and gasoline, failed to post a gain in December. This reading did rise 0.3 percent in November but the two months taken together are a flop. The year-on-year rate for December fell 9 tenths to plus 3.1 percent for the thinnest performance in nearly 3 years and the weakest December of the economic cycle (going back to 2008). Traditional holiday categories like apparel stores, electronics & appliance stores, and department stores were all very weak. And there's also a stinging 0.8 percent drop in restaurant sales. The word stingy also applies here. Restaurant sales, at about 4 percent growth, have been slowing for the past year. Core retail sales, which exclude both autos and gasoline, failed to post a gain in December. This reading did rise 0.3 percent in November but the two months taken together are a flop. The year-on-year rate for December fell 9 tenths to plus 3.1 percent for the thinnest performance in nearly 3 years and the weakest December of the economic cycle (going back to 2008). Traditional holiday categories like apparel stores, electronics & appliance stores, and department stores were all very weak. And there's also a stinging 0.8 percent drop in restaurant sales. The word stingy also applies here. Restaurant sales, at about 4 percent growth, have been slowing for the past year.
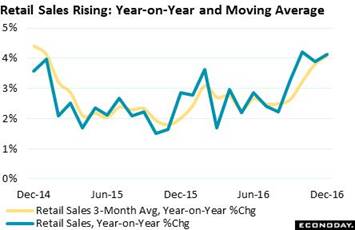 Not weak at all are two categories, however, that aren't really associated very much with holiday gift giving. Sales at gasoline stations, reflecting a price rise, jumped 2.0 percent but December's big news is a 2.4 percent surge in vehicle sales. After starting 2016 on a down note, vehicle sales accelerated sharply through the second half to end the year with a respectable gain (3.5 percent overall and 6.8 percent December to December). When including gas and autos back in the calculation, retail sales in fact proved very solid in December, up 0.6 percent on the month and, at 4.1 percent, adding 1 full percentage point to the year-on-year rate. Not weak at all are two categories, however, that aren't really associated very much with holiday gift giving. Sales at gasoline stations, reflecting a price rise, jumped 2.0 percent but December's big news is a 2.4 percent surge in vehicle sales. After starting 2016 on a down note, vehicle sales accelerated sharply through the second half to end the year with a respectable gain (3.5 percent overall and 6.8 percent December to December). When including gas and autos back in the calculation, retail sales in fact proved very solid in December, up 0.6 percent on the month and, at 4.1 percent, adding 1 full percentage point to the year-on-year rate.
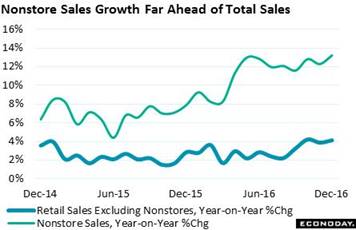 Some of the weakness at traditional stores is tied of course to e-commerce which by last count makes up an 8.4 percent and rising share of total retail sales. E-commerce is grouped in the non-stores component of the retail sales report and hasn't posted a monthly setback for the last 2 years. Non-store sales rose 1.3 percent in December for a year-on-year rate of 13.2 percent, among the very best showings and last exceeded in November 2011. Yet, taking in the whole and not just ecommerce or autos, there's more off notes than on notes in the December retail sales report. Consumer spirits may be very high and if this benefited retail sales in December, it was mostly isolated to vehicles. Some of the weakness at traditional stores is tied of course to e-commerce which by last count makes up an 8.4 percent and rising share of total retail sales. E-commerce is grouped in the non-stores component of the retail sales report and hasn't posted a monthly setback for the last 2 years. Non-store sales rose 1.3 percent in December for a year-on-year rate of 13.2 percent, among the very best showings and last exceeded in November 2011. Yet, taking in the whole and not just ecommerce or autos, there's more off notes than on notes in the December retail sales report. Consumer spirits may be very high and if this benefited retail sales in December, it was mostly isolated to vehicles.
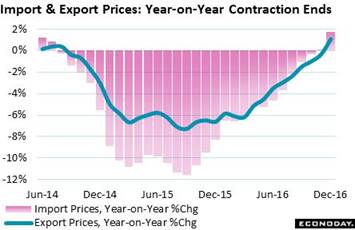 Inflation data are still soft but, where the comparison matters most, they are showing visible improvement. Import prices, reflecting a 7.9 percent monthly jump in oil, rose 0.4 percent in December while export prices, also benefiting from the rise in oil, increased 0.3 percent. In contrast to the monthly change, the year-to-year change is more dramatic, rising very sharply to 1.8 percent for imports and to 1.1 percent for exports. The gains here reflect easy comparisons with a year ago when oil prices were very weak, below $40, but comparisons don't diminish the importance of the move. This is the first time in 2-1/2 years that year-on-year rates for import and export prices are in the plus column together. With the promise of OPEC production cuts, year-on-year price readings may be seeing further improvement ahead as they test the Fed's 2 percent inflation policy line. Inflation data are still soft but, where the comparison matters most, they are showing visible improvement. Import prices, reflecting a 7.9 percent monthly jump in oil, rose 0.4 percent in December while export prices, also benefiting from the rise in oil, increased 0.3 percent. In contrast to the monthly change, the year-to-year change is more dramatic, rising very sharply to 1.8 percent for imports and to 1.1 percent for exports. The gains here reflect easy comparisons with a year ago when oil prices were very weak, below $40, but comparisons don't diminish the importance of the move. This is the first time in 2-1/2 years that year-on-year rates for import and export prices are in the plus column together. With the promise of OPEC production cuts, year-on-year price readings may be seeing further improvement ahead as they test the Fed's 2 percent inflation policy line.
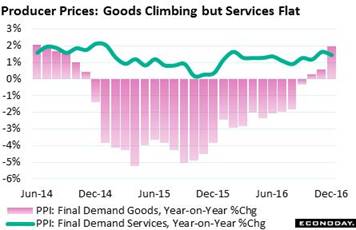 Similar results appear in the producer price report where the December headline rose 0.3 percent for a sizable lift in the year-on-year rate to 1.6 percent. Energy prices in this report rose a monthly 2.6 percent with food also higher, up 0.7 percent. Including energy and food and all other goods, prices rose 0.7 percent for a 1.9 percent rate. Offsetting this pressure, however, is softness in service prices which could only manage a 0.1 percent uptick on the month with this year-on-year rate at 1.5 percent. As seen in the graph, service prices (line) are stable and reliable compared to goods prices (columns). Similar results appear in the producer price report where the December headline rose 0.3 percent for a sizable lift in the year-on-year rate to 1.6 percent. Energy prices in this report rose a monthly 2.6 percent with food also higher, up 0.7 percent. Including energy and food and all other goods, prices rose 0.7 percent for a 1.9 percent rate. Offsetting this pressure, however, is softness in service prices which could only manage a 0.1 percent uptick on the month with this year-on-year rate at 1.5 percent. As seen in the graph, service prices (line) are stable and reliable compared to goods prices (columns).
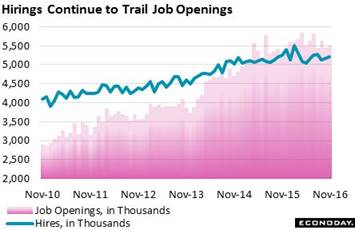 Jobs, jobs, jobs is the battlecry of the incoming Trump administration. But, based on the Job Openings and Labor Turnover Survey, there's already plenty of jobs out there, exactly 5.522 million of them back in November. This against only 5.160 million hires in the month, a comparison which has been lagging the last couple of years as employers find it difficult to fill slots. In theory, if each of those 5.522 million jobs were immediately filled, the number of unemployed would fall to 1.887 million for an unemployment rate of 1.2 percent. Widening out the definition of unemployment does soften the view of labor slack but even here the pool of available workers, at 13.2 million in December, is shrinking, down from 14.0 million as recently as September. Jobs, jobs, jobs is the battlecry of the incoming Trump administration. But, based on the Job Openings and Labor Turnover Survey, there's already plenty of jobs out there, exactly 5.522 million of them back in November. This against only 5.160 million hires in the month, a comparison which has been lagging the last couple of years as employers find it difficult to fill slots. In theory, if each of those 5.522 million jobs were immediately filled, the number of unemployed would fall to 1.887 million for an unemployment rate of 1.2 percent. Widening out the definition of unemployment does soften the view of labor slack but even here the pool of available workers, at 13.2 million in December, is shrinking, down from 14.0 million as recently as September.
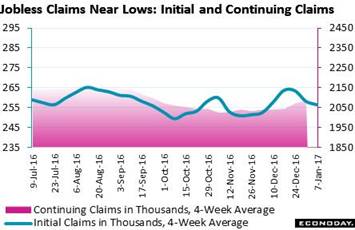 Unemployment claims are the other side of the labor market and they indicate that employers, who can't fill open positions, aren't letting anyone go. Both initial and continuing claims are back near record lows, tracking near 250,000 a week for initial claims and just over 2 million for continuing claims. The unemployment rate for insured workers (which excludes job quitters and those coming back into the workforce) is at 1.5 percent which is just off a record low. Unemployment claims are the other side of the labor market and they indicate that employers, who can't fill open positions, aren't letting anyone go. Both initial and continuing claims are back near record lows, tracking near 250,000 a week for initial claims and just over 2 million for continuing claims. The unemployment rate for insured workers (which excludes job quitters and those coming back into the workforce) is at 1.5 percent which is just off a record low.
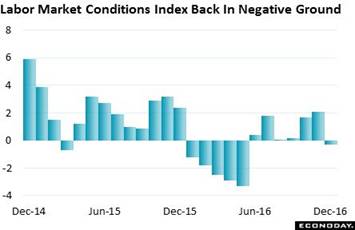 But not all the indications on the labor market are favorable. The labor market conditions index from the Federal Reserve itself just can't get going -- not even with steady payroll growth and low unemployment nor the recent rise in average hourly earnings. This index, an eclectic blend of 19 components that Fed officials warn us not to pay any attention to, fell to minus 0.3 in December for the first negative reading since May. Based on the Fed's own index, maybe there's more slack in the labor market than evident in the unemployment rate or in jobless claims, something that would push off wage inflation and could push back another rate hike. But not all the indications on the labor market are favorable. The labor market conditions index from the Federal Reserve itself just can't get going -- not even with steady payroll growth and low unemployment nor the recent rise in average hourly earnings. This index, an eclectic blend of 19 components that Fed officials warn us not to pay any attention to, fell to minus 0.3 in December for the first negative reading since May. Based on the Fed's own index, maybe there's more slack in the labor market than evident in the unemployment rate or in jobless claims, something that would push off wage inflation and could push back another rate hike.
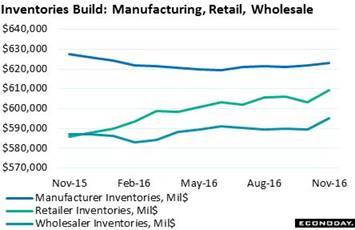 More two-way news comes from the week's inventory data. Business inventories rose an outsized 0.7 percent in November to more than offset a revised 0.1 percent draw in October. Both retailers and wholesalers posted large 1.0 percent builds in November with manufacturers at a 0.2 percent increase. Given weakness in total sales, up only 0.1 percent, the stock-to-sales ratio rose 1 notch to a less lean 1.38. Though rising inventories can be a big negative for future production and employment, they are always a positive for GDP where the fourth-quarter calculation will get a lift from November's build. Current estimates for fourth-quarter GDP, due to inventories but also to constructive gains in consumer spending, are running in the 2 to 3 percent range vs the third-quarter's 3.5 percent performance. More two-way news comes from the week's inventory data. Business inventories rose an outsized 0.7 percent in November to more than offset a revised 0.1 percent draw in October. Both retailers and wholesalers posted large 1.0 percent builds in November with manufacturers at a 0.2 percent increase. Given weakness in total sales, up only 0.1 percent, the stock-to-sales ratio rose 1 notch to a less lean 1.38. Though rising inventories can be a big negative for future production and employment, they are always a positive for GDP where the fourth-quarter calculation will get a lift from November's build. Current estimates for fourth-quarter GDP, due to inventories but also to constructive gains in consumer spending, are running in the 2 to 3 percent range vs the third-quarter's 3.5 percent performance.
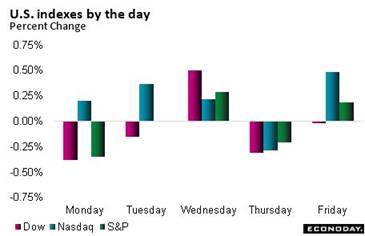 The Treasury market, in line with most thinking that new policies won't begin to show traction until 2018, is not pricing in any inflation runaway. The 10-year did spike about 80 points to 2.60 percent following the election but has since given back about half that to about 2.40 percent. Details of the stimulus programs have yet to emerge but they could hit the markets sooner than later judging by the tempo of events right now in Washington. The Treasury market is relatively tranquil, showing little change in the week and including a very strong non-dealer bid at the week's 10-year auction. The Dow never made much of an approach to 20,000 during the week, ending 0.3 percent lower at 19,891. The Treasury market, in line with most thinking that new policies won't begin to show traction until 2018, is not pricing in any inflation runaway. The 10-year did spike about 80 points to 2.60 percent following the election but has since given back about half that to about 2.40 percent. Details of the stimulus programs have yet to emerge but they could hit the markets sooner than later judging by the tempo of events right now in Washington. The Treasury market is relatively tranquil, showing little change in the week and including a very strong non-dealer bid at the week's 10-year auction. The Dow never made much of an approach to 20,000 during the week, ending 0.3 percent lower at 19,891.
| Markets at a Glance |
Year-End |
Week Ended |
Week Ended |
Year-To-Date |
Weekly |
|
2016 |
6-Jan-17 |
13-Jan-17 |
Change |
Change |
| DJIA |
19,762.60 |
19,963.80 |
19,885.73 |
0.6% |
-0.4% |
| S&P 500 |
2,238.83 |
2,276.98 |
2,274.64 |
1.6% |
-0.1% |
| Nasdaq Composite |
5,383.12 |
5,521.06 |
5,574.12 |
3.5% |
1.0% |
|
|
|
|
|
|
| Crude Oil, WTI ($/barrel) |
$53.71 |
$53.69 |
$52.54 |
-2.2% |
-2.1% |
| Gold (COMEX) ($/ounce) |
$1,152.50 |
$1,172.50 |
$1,197.70 |
3.9% |
2.1% |
|
|
|
|
|
|
| Fed Funds Target |
0.50 to 0.75% |
0.50 to 0.75% |
0.50 to 0.75% |
0 bp |
0 bp |
| 2-Year Treasury Yield |
1.21% |
1.21% |
1.20% |
–1 bp |
–1 bp |
| 10-Year Treasury Yield |
2.45% |
2.42% |
2.39% |
–6 bp |
–3 bp |
| Dollar Index |
102.26 |
102.19 |
101.24 |
-1.0% |
-0.9% |
The policy pace of the incoming administration appears to be double time, a contrast to the Federal Reserve's wait-and-see approach. And despite the surge in confidence readings, the post-election economic pace is definitely not double time, just more of the same at least for now. The slow pace should help the Fed buy time as the unknowns unfold.
A holiday shortened weeks starts Tuesday with the first indication on the 2017 factory sector, the Empire State index. Wednesday opens with consumer prices, where energy-related strength is expected, and also industrial production where sharp improvement is the call. Housing will see two indicators, the home builders' housing market index on Wednesday which has been soaring and housing starts & permits on Thursday which have been mixed. Initial jobless claims on Thursday will track the sample week of the January employment report while the Beige Book on Wednesday will offer the Fed's own assessment of ongoing economic activity. And there will be more news from the Fed, both Wednesday afternoon and Thursday evening as Janet Yellen tackles the topics of monetary policy and its conduct.
Empire State Index for January
Consensus Forecast: 8.0
Consensus Range: 4.5 to 11.3
January's advance data start with the Empire State report which, like an even stronger Philly Fed report, has been pointing to building momentum for the manufacturing sector. Strength has been led by new orders and also business expectations. Forecasters see the index posting a third straight month in the plus column, at 8.0.
Consumer Price Index for December
Consensus Forecast, Month-to-Month Change: +0.3%
Consensus Range: +0.2% to +0.5%
CPI Core, Less Food & Energy
Consensus Forecast, Month-to-Month Change: +0.2%
Consensus Range: +0.1% to +0.3%
Consumer prices have not been showing much traction, running just below a 2 percent yearly rate and only a little bit above 2 percent excluding food & energy. Monthly gains for both readings were only 0.2 percent in November and forecasters don't see much improvement for December, at a consensus 0.3 percent overall and 0.2 percent excluding food & energy. Low rates of consumer inflation will allow the Fed to be patient when raising rates this year.
Industrial Production for December
Consensus Forecast, Month-to-Month Change: +0.6%
Consensus Range: +0.4% to +1.1%
Manufacturing Production
Consensus Forecast, Month-to-Month Change: +0.3%
Consensus Range: +0.2% to +0.5%
Capacity Utilization Rate
Consensus Forecast: 75.4%
Consensus Range: 75.2% to 76.1%
The manufacturing component of the industrial production report fell back noticeably in November, down 0.1 percent with weakness spread evenly through the report. Utility output, pulled lower by warmer-than-usual temperatures, fell for a third straight month, though mining extended its rebound with a second straight strong gain. Forecasters see a bounce for manufacturing where the December call is for a 0.3 percent gain. The industrial production headline is expected to rise 0.6 percent after dropping 0.4 percent in November with capacity utilization see at 75.4 percent which would be well up from November's 75.0 percent.
Housing Market Index for January
Consensus Forecast: 69
Consensus Range: 67 to 71
The housing market index jumped an unusually strong 7 points to 70 in December, a new cycle high and pointing to momentum ahead for the new home market. Even before December's jump, the index had been showing outstanding strength reflecting strong sales expectations and also long delayed improvement in traffic. Traffic was December's highlight, rising to 53 for the first plus-50 expansionary score in 11 years in a tangible indication of rising demand. The Econoday consensus for January calls for only very little give back, down 1 point to 69.
Beige Book
Prepared for the Jan 31 & Feb 1 FOMC Meeting
The Beige Book will set the economic backdrop for the January 31 and February 1 FOMC meeting. The prior report, prepared for the December meeting, was little changed, describing economic activity as no better than modest to moderate with employment a plus but with inflation still lagging. Note that the structure of the Beige Book will change with the January release. The new format will summarize three core topics: overall economic activity, employment and wages, and prices.
Housing Starts for December
Consensus Forecast, Adjusted Annualized Rate: 1.200 million
Consensus Range: 1.100 to 1.275 million
Housing Permits
Consensus Forecast: 1.230 million
Consensus Range: 1.205 to 1.255 million
Housing starts are in a swirl of month-to-month volatility, falling 19 percent, surging 27 percent, and falling 10 percent in the last three months. A bounce back for December is expected, to a 1.200 million annualized rate and a 10.1 percent gain from November. Housing permits have been less volatile and are expected rise 2.4 percent to a 1.230 million rate. Year-on-year, starts and permits have been weak, in the negative mid-single digits.
Initial Jobless Claims for January 14 week
Consensus Forecast: 255,000
Consensus Range: 252,000 to 260,000
Week-to-week initial claims have been volatile during the holidays but still low and favorable. The January 14 week is the sample week for both the monthly payroll and household data and the results will offer an important gauge of what to expect for the January employment report. Forecasters see initial claims rising but only slightly to 255,000 from 247,000. If there's no change in the week, the 4-week average will fall a sizable and very favorable 7,000.
Philadelphia Fed Manufacturing Index for January
Consensus Forecast: 16.0
Consensus Range: 12.0 to 22.2
The Philadelphia Fed index has been strongly signaling a move higher for a still suffering factory sector. In the last report, the December index rose for a fifth straight month to a very strong 21.5 (since revised to 19.7 on updated seasonal adjustments). December is the highest reading since December 2014. Forecasters see some give back for the January index, at a consensus 16.0. New orders and general expectations have been two of the report's strongest details.
|
