|
China may be slowing and the global economy may be stalling but the U.S. economy continues to hum along. Strength is centered in the consumer who in turn is being supported by strong demand for labor which, based on the latest week's data, may be regaining momentum. Yet there are some aspects of the economy that are not showing increasing strength, whether the factory sector or the general inflation picture. How will the Federal Reserve sort out its assessments at the coming FOMC? A walk through the latest week's data may offer some clues.
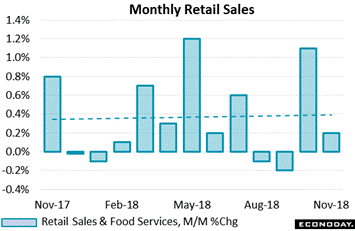 Sharp contraction in gasoline sales clouds November's retail sales report, showing only a subdued 0.2 percent headline increase that rises to a strong 0.5 percent when the 2.3 percent monthly plunge in gasoline sales is excluded. Retail sales data, unlike the industrial production report we'll get to later, measures goods not by volumes but in dollar terms. When the price of oil moves sharply, such as November's $20 plunge from $70 to $50, the price of gasoline quickly follows in line as do dollar totals at gasoline stations. And gasoline prices are continuing to come down this month as well, a factor that may also hold down December's retail headline. Sharp contraction in gasoline sales clouds November's retail sales report, showing only a subdued 0.2 percent headline increase that rises to a strong 0.5 percent when the 2.3 percent monthly plunge in gasoline sales is excluded. Retail sales data, unlike the industrial production report we'll get to later, measures goods not by volumes but in dollar terms. When the price of oil moves sharply, such as November's $20 plunge from $70 to $50, the price of gasoline quickly follows in line as do dollar totals at gasoline stations. And gasoline prices are continuing to come down this month as well, a factor that may also hold down December's retail headline.
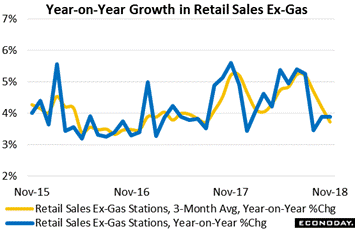 But for retail in general, what hurts gasoline stations is probably a positive for everyone else that could give a special boost to holiday shopping. And this could help bail out the seaon given what have been mixed indications so far from retailers. The graph tracks ex-gasoline sales on a year-to-year percentage basis and it isn't pointing to increasing strength, at just under 4 percent with the yellow line of the 3-month average slowing sharply to 3.7 percent. Momentum was strong at the end of last year and, after fizzling in the first quarter, then began to pick up through the bulk of 2018 before beginning again to fizzle. Slowing growth for two key discretionary categories – motor vehicles and restaurants – are behind much of this year-end slump. But for retail in general, what hurts gasoline stations is probably a positive for everyone else that could give a special boost to holiday shopping. And this could help bail out the seaon given what have been mixed indications so far from retailers. The graph tracks ex-gasoline sales on a year-to-year percentage basis and it isn't pointing to increasing strength, at just under 4 percent with the yellow line of the 3-month average slowing sharply to 3.7 percent. Momentum was strong at the end of last year and, after fizzling in the first quarter, then began to pick up through the bulk of 2018 before beginning again to fizzle. Slowing growth for two key discretionary categories – motor vehicles and restaurants – are behind much of this year-end slump.
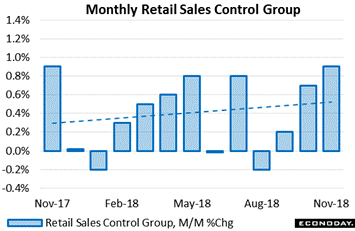 But vehicles and restaurants, not to mention gasoline stations, are excluded from what is actually the elusive strength of the November retail sales report. Control group sales are used to compute estimates for personal consumption expenditures and have an outsized effect on the consumer spending component of GDP. Absolutely spiking the last two months with 0.7 and 0.9 percentage gains, control group sales also exclude building materials which also fell in November. What the control group does include is the remaining balance of the retail report which was led in November by a 2.3 percent surge for nonstore retailers (where e-commerce is tracked), a 1.4 percent jump at electronics & appliance stores, a 1.2 percent gain for furniture, and an unusually strong 0.9 percent rise at health & personal care stores. Both general merchandise and its department-store subcomponent contributed useful 0.4 percent gains. All of these results, putting the definition of the control group aside, are in fact strongly positive indications for holiday spending. But vehicles and restaurants, not to mention gasoline stations, are excluded from what is actually the elusive strength of the November retail sales report. Control group sales are used to compute estimates for personal consumption expenditures and have an outsized effect on the consumer spending component of GDP. Absolutely spiking the last two months with 0.7 and 0.9 percentage gains, control group sales also exclude building materials which also fell in November. What the control group does include is the remaining balance of the retail report which was led in November by a 2.3 percent surge for nonstore retailers (where e-commerce is tracked), a 1.4 percent jump at electronics & appliance stores, a 1.2 percent gain for furniture, and an unusually strong 0.9 percent rise at health & personal care stores. Both general merchandise and its department-store subcomponent contributed useful 0.4 percent gains. All of these results, putting the definition of the control group aside, are in fact strongly positive indications for holiday spending.
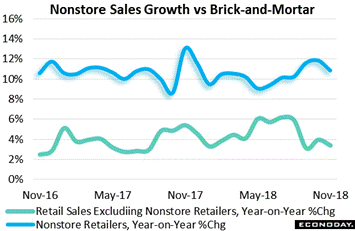
Discreet data for November's e-commerce are posted with a delay but looking at the total nonstore component, in which e-commerce is by far the dominant component, does illustrate the strength of the digital economy and the weakness of brick-and-mortar. The graph tracks year-on-year sales growth at nonstores, at 10.8 percent in November which follow rates at the 12 percent line the prior two months. Growth for all other retailers is far below in the distance, at 3.4 percent after peaking at the 6 percent line earlier in the year. Put them together, and total year-on-year retail sales managed only a 4.2 percent showing in November, down from 4.8 percent in October and a peak of 6.4 percent in May.
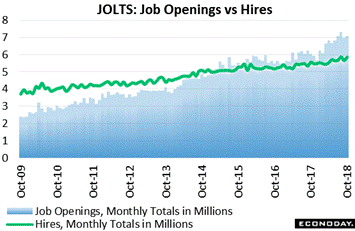 Mixed results were also the theme of the prior week's employment report where payroll growth slowed but in fact remained very solid. Showing more uniform strength are the latest on job openings and hires with both underscoring what is arguably a central risk to the economy: lack of available capacity in the labor market. Job openings totaled 7.079 million in November, up 1.7 percent vs 6.96 million in October and just shy of August's record of 7.293 million. Hires, which have been lagging openings for nearly four years, did rise 3.4 percent in October but, at 5.892 million, remain more than 1 million below openings. The risk of increasing scarcity of labor is highlighted by year-on-year rates, at a 16.8 percent increase for openings vs only a 5.2 percent increase in hires. This separation underscores a stubborn feature of the 2018 economy which is lack of quality labor, that employers are having a hard time finding the people they want. Mixed results were also the theme of the prior week's employment report where payroll growth slowed but in fact remained very solid. Showing more uniform strength are the latest on job openings and hires with both underscoring what is arguably a central risk to the economy: lack of available capacity in the labor market. Job openings totaled 7.079 million in November, up 1.7 percent vs 6.96 million in October and just shy of August's record of 7.293 million. Hires, which have been lagging openings for nearly four years, did rise 3.4 percent in October but, at 5.892 million, remain more than 1 million below openings. The risk of increasing scarcity of labor is highlighted by year-on-year rates, at a 16.8 percent increase for openings vs only a 5.2 percent increase in hires. This separation underscores a stubborn feature of the 2018 economy which is lack of quality labor, that employers are having a hard time finding the people they want.
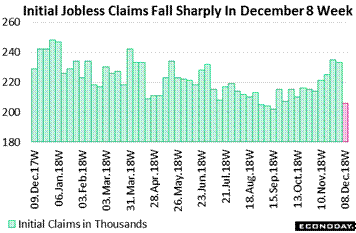 A more immediate indication of increasing labor market demand comes from what is a sudden and unexpected decline in jobless claims. Through October and November initial claims had been pivoting higher off historic lows but that's now apparently old news. In data for the December 8 week, claims fell a very sharp 27,000 to 206,000 for the best showing since the historic lows of mid-September. Though seasonal adjustments are always touchy late in the year, the break lower in initial claims does hint at a possible break higher for December's nonfarm payroll growth which in November totaled 155,000. Initial claims in the coming report, which will track the sample period of the monthly employment report, will be one of the week's mostly closely watched numbers. A more immediate indication of increasing labor market demand comes from what is a sudden and unexpected decline in jobless claims. Through October and November initial claims had been pivoting higher off historic lows but that's now apparently old news. In data for the December 8 week, claims fell a very sharp 27,000 to 206,000 for the best showing since the historic lows of mid-September. Though seasonal adjustments are always touchy late in the year, the break lower in initial claims does hint at a possible break higher for December's nonfarm payroll growth which in November totaled 155,000. Initial claims in the coming report, which will track the sample period of the monthly employment report, will be one of the week's mostly closely watched numbers.
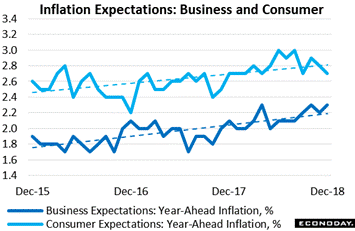 Year-end acceleration for the labor market would be a surprise for many as would any move higher in inflation where subdued results aren't surprising anybody any more. Jerome Powell has highlighted inflation expectations as the single most critical feature of all inflationary data and the latest results are mixed. Year-ahead inflation expectations for the business sector are up 1 tenth this month to 2.3 percent and back at expansion highs also hit in April and October of this year. But December's gain isn't dramatic and is not confirmed by last week's reading on the consumer sector from the University of Michigan which edged down 1 tenth to 2.7 percent. These results are modest at most yet the trends for each are on a gradual upward path, one that will help justify what looks very likely to be a rate hike at the coming FOMC. Year-end acceleration for the labor market would be a surprise for many as would any move higher in inflation where subdued results aren't surprising anybody any more. Jerome Powell has highlighted inflation expectations as the single most critical feature of all inflationary data and the latest results are mixed. Year-ahead inflation expectations for the business sector are up 1 tenth this month to 2.3 percent and back at expansion highs also hit in April and October of this year. But December's gain isn't dramatic and is not confirmed by last week's reading on the consumer sector from the University of Michigan which edged down 1 tenth to 2.7 percent. These results are modest at most yet the trends for each are on a gradual upward path, one that will help justify what looks very likely to be a rate hike at the coming FOMC.
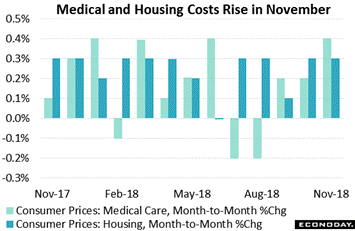 And there are tangible areas of traction in inflation. Housing, which is the main component in the CPI, held at trend with a moderate 0.3 percent rise, one showing acceleration in rents, while medical care, another large component, picked back up with a 0.4 percent increase. It's these two components that are behind the increase in the core rate, at only 0.2 percent but still an increase. Energy fell 2.2 percent in the month with gasoline down 4.2 percent reflecting the month's $20 oil drop. Sharp declines were also posted for communications at minus 1.1 percent, apparel down 0.9 percent, and transportation 0.8 percent lower in the month. Overall, consumer prices were unchanged in November with the year-on-year rate falling 3 tenths to 2.5 percent. And there are tangible areas of traction in inflation. Housing, which is the main component in the CPI, held at trend with a moderate 0.3 percent rise, one showing acceleration in rents, while medical care, another large component, picked back up with a 0.4 percent increase. It's these two components that are behind the increase in the core rate, at only 0.2 percent but still an increase. Energy fell 2.2 percent in the month with gasoline down 4.2 percent reflecting the month's $20 oil drop. Sharp declines were also posted for communications at minus 1.1 percent, apparel down 0.9 percent, and transportation 0.8 percent lower in the month. Overall, consumer prices were unchanged in November with the year-on-year rate falling 3 tenths to 2.5 percent.
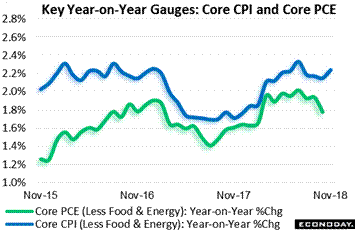 Yet the results for November consumer prices, however subdued, are in fact in line with the gradually rising trends evident in inflation expectations. The year-on-year rate for the core rate, as tracked by the blue line of the graph, did rise 1 tenth to 2.2 percent and points directly to a similar climb for the core PCE rate which fell to 1.8 percent back in October. PCE inflation rates are what the Federal Reserve tracks in its deliberations, preferring the amped up methodology in these indexes that generally shows a bit less inflation pressures as consumers, when prices rise, are presumed to move to lower priced substitutes, a shift that is not picked as quickly in the consumer price report. In any case, modest but steadily rising trends are likely to be the inflation verdict at the FOMC meeting. Yet the results for November consumer prices, however subdued, are in fact in line with the gradually rising trends evident in inflation expectations. The year-on-year rate for the core rate, as tracked by the blue line of the graph, did rise 1 tenth to 2.2 percent and points directly to a similar climb for the core PCE rate which fell to 1.8 percent back in October. PCE inflation rates are what the Federal Reserve tracks in its deliberations, preferring the amped up methodology in these indexes that generally shows a bit less inflation pressures as consumers, when prices rise, are presumed to move to lower priced substitutes, a shift that is not picked as quickly in the consumer price report. In any case, modest but steadily rising trends are likely to be the inflation verdict at the FOMC meeting.
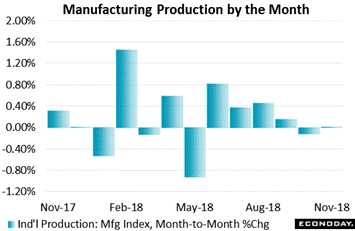 The FOMC doesn't usually break out the factory sector in its policy statement, pointing indirectly at the latest in business investment instead. Were the Fed to specifically highlight this sector, there very well would be less reason to hike rates. November's industrial production report did show a headline 0.6 percent gain that reflected, however, big jumps for utilities and mining which more than offset another flat performance at manufacturers. Utility output surged 3.3 percent following two months of soft results tied to hurricane disruptions while mining output, which sank sharply in October, rose 1.7 percent. Manufacturing, as tracked in the graph, couldn't muster much strength at all in November despite a jump for select hi-tech and a respectable gain for motor vehicles. Production of construction supplies, where shortages have been reported, posted a third straight month of contraction with production of business equipment, which had been strong, also down in the month. This latter decline underscores emerging warnings from the Fed that business investment, after spiking during the first half of the year on the big corporate tax cut, has been flattening out and with it, perhaps, manufacturing in general. The FOMC doesn't usually break out the factory sector in its policy statement, pointing indirectly at the latest in business investment instead. Were the Fed to specifically highlight this sector, there very well would be less reason to hike rates. November's industrial production report did show a headline 0.6 percent gain that reflected, however, big jumps for utilities and mining which more than offset another flat performance at manufacturers. Utility output surged 3.3 percent following two months of soft results tied to hurricane disruptions while mining output, which sank sharply in October, rose 1.7 percent. Manufacturing, as tracked in the graph, couldn't muster much strength at all in November despite a jump for select hi-tech and a respectable gain for motor vehicles. Production of construction supplies, where shortages have been reported, posted a third straight month of contraction with production of business equipment, which had been strong, also down in the month. This latter decline underscores emerging warnings from the Fed that business investment, after spiking during the first half of the year on the big corporate tax cut, has been flattening out and with it, perhaps, manufacturing in general.
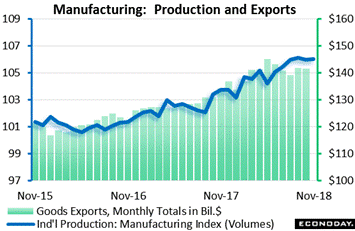 The industrial production report, which incidentally is one of the few indicators produced by the Fed, measures volumes which means, having no price component, is inflation adjusted by default. The vanishing strength of the manufacturing component is seen in the blue line of the graph which tracks the underlying index, holding at 106.0 in November. The green columns are nominal dollar totals for the nation's goods exports, that is exports produced by the nation's manufacturers. Both dollar exports and underlying production are showing a clear flattening the last several months and likely reflect ongoing tariff battles not to mention general slowing in global demand. How exports and manufacturing play out could prove the first battleground of the 2019 economy. The industrial production report, which incidentally is one of the few indicators produced by the Fed, measures volumes which means, having no price component, is inflation adjusted by default. The vanishing strength of the manufacturing component is seen in the blue line of the graph which tracks the underlying index, holding at 106.0 in November. The green columns are nominal dollar totals for the nation's goods exports, that is exports produced by the nation's manufacturers. Both dollar exports and underlying production are showing a clear flattening the last several months and likely reflect ongoing tariff battles not to mention general slowing in global demand. How exports and manufacturing play out could prove the first battleground of the 2019 economy.
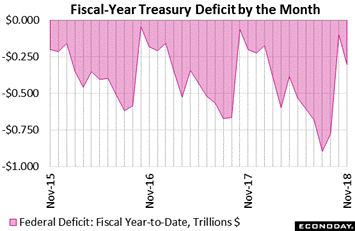 A battleground of increasing focus for general 2019 economic policy could well be the nation's deepening deficit, at $204.9 billion deficit in the month of November alone that, as tracked at the far right of the graph, brings the year-to-date deficit, two months into fiscal 2019, to $305.4 billion. This is a 51 percent increase vs a deficit of $201.8 billion two months into fiscal 2018. Receipts are up 3.4 percent so far in fiscal 2019 as a dip individual taxes is being offset by a rise in corporate tax receipts as well as a jump in excise taxes. Higher import tariffs are giving a boost to custom duties which, two months into the fiscal year, are up $5.5 billion from this time last year. An offset, however, is a $5.4 billion rise in net interest costs which reflect financing of the government's deepening red ink. Higher Medicare costs are the main factor driving up outlays which are up 18.4 percent overall in fiscal 2019. Defense and Social Security costs are also up. A battleground of increasing focus for general 2019 economic policy could well be the nation's deepening deficit, at $204.9 billion deficit in the month of November alone that, as tracked at the far right of the graph, brings the year-to-date deficit, two months into fiscal 2019, to $305.4 billion. This is a 51 percent increase vs a deficit of $201.8 billion two months into fiscal 2018. Receipts are up 3.4 percent so far in fiscal 2019 as a dip individual taxes is being offset by a rise in corporate tax receipts as well as a jump in excise taxes. Higher import tariffs are giving a boost to custom duties which, two months into the fiscal year, are up $5.5 billion from this time last year. An offset, however, is a $5.4 billion rise in net interest costs which reflect financing of the government's deepening red ink. Higher Medicare costs are the main factor driving up outlays which are up 18.4 percent overall in fiscal 2019. Defense and Social Security costs are also up.
 It's time for us to make our own assessments, of the markets of course. Stocks broke into 2018 in a fury, posting nearly double-digit gains by the end January. Then, however, the Federal Reserve began to raise its inflation assessment and by the end of February the early gains had all but disappeared. Fed policy and the outlook for rising interest rates would prove to be a steady negative for the stock market all year and was joined in March by tariffs and counter-tariffs which would prove a volatile negative, increasing and decreasing in intensity. Right now, the Dow looks to end 2019 with a 2.5 percent loss vs last year's 25.1 percent surge. The Nasdaq is still in the year-to-date plus column but not by much, at only 0.1 percent which would follow a 28.2 percent gain last year. The yield curve has flattened noticeably this year, opening at 52 basis points between the 2-year and 10-year Treasury yields in a spread that has narrowed now to 15 basis points. The dollar fell sharply last year but is up solidly this year, at a 5.6 percent gain for the dollar index. It's time for us to make our own assessments, of the markets of course. Stocks broke into 2018 in a fury, posting nearly double-digit gains by the end January. Then, however, the Federal Reserve began to raise its inflation assessment and by the end of February the early gains had all but disappeared. Fed policy and the outlook for rising interest rates would prove to be a steady negative for the stock market all year and was joined in March by tariffs and counter-tariffs which would prove a volatile negative, increasing and decreasing in intensity. Right now, the Dow looks to end 2019 with a 2.5 percent loss vs last year's 25.1 percent surge. The Nasdaq is still in the year-to-date plus column but not by much, at only 0.1 percent which would follow a 28.2 percent gain last year. The yield curve has flattened noticeably this year, opening at 52 basis points between the 2-year and 10-year Treasury yields in a spread that has narrowed now to 15 basis points. The dollar fell sharply last year but is up solidly this year, at a 5.6 percent gain for the dollar index.
| Markets at a Glance |
Year-End |
Week Ended |
Week Ended |
Year-To-Date |
Weekly |
|
2017 |
7-Dec-18 |
14-Dec-18 |
Change |
Change |
| DJIA |
24,719.22 |
24,388.95 |
24,100.51 |
-2.5% |
-1.2% |
| S&P 500 |
2,673.61 |
2,633.08 |
2,599.95 |
-2.8% |
-1.3% |
| Nasdaq Composite |
6,903.39 |
6,969.25 |
6,910.66 |
0.1% |
-0.8% |
|
|
|
|
|
|
| Crude Oil, WTI ($/barrel) |
$60.15 |
$52.51 |
$51.19 |
-14.9% |
-2.5% |
| Gold (COMEX) ($/ounce) |
$1,305.50 |
$1,254.70 |
$1,242.20 |
-4.8% |
-1.0% |
|
|
|
|
|
|
| Fed Funds Target |
1.25 to 1.50% |
2.00 to 2.25% |
2.00 to 2.25% |
75 bp |
0 bp |
| 2-Year Treasury Yield |
1.89% |
2.73% |
2.74% |
85 bp |
1 bp |
| 10-Year Treasury Yield |
2.41% |
2.86% |
2.89% |
48 bp |
3 bp |
| Dollar Index |
92.29 |
96.6 |
97.45 |
5.6% |
0.9% |
Consumer spending looks perhaps to get an overstated boost from the unusual strength of the retail sales control group, but wider indications are pointing to respectable results nevertheless. And there may be early indications of renewed strength coming from the labor market which could firm the Federal Reserve's determination to raise rates at the coming meeting. But there are plenty of indications of moderation in the economic data and based on actual inflation which has been decidedly soft, a period of less and less aggressive Fedspeak may be in store.
The federal funds projection, part of the quarterly FOMC forecasts, will not only dominate the week's news but will define the future framework of monetary policy, specifically how much, if at all, the Federal Reserve expects to raise rates next year. Housing data will dominate the pre-FOMC build up beginning on Monday with the housing market index which in the prior report posted one its most sudden and dramatic reversals on record. Posted on Tuesday will be housing starts and permits which have been falling the last six months followed Wednesday morning by existing home sales which, despite a rare gain in the prior report, are perhaps the year's biggest data disappointment of all. For Wednesday's FOMC statement, an incremental rate hike is the wide expectation with FOMC forecasts also published followed by Jerome Powell's press conference. Jobs data return to focus in Thursday's jobless claims data which, after falling back to historic lows, will track the sample week of the December employment report. Durable goods will open Friday's slate and are expected to show a sharp rebound followed at mid-morning by personal income and outlays where November's spending data will offer a revealing input for fourth-quarter GDP.
Empire State Index for December
Consensus Forecast: 21.0
Consensus Range: 18.0 to 24.0
At a consensus 21.0 vs 23.3 in November, strong and steady growth is the expectation for December's Empire State index. With both new orders and the 6-month outlook climbing, November extended what has been an impressive run for this report.
Housing Market Index for December
Consensus Forecast: 61
Consensus Range: 59 to 65
A lifeless rebound is the call for December's housing market index which is expected to recover only 1 point following November's sudden and shocking 8-point plunge to 60. All components fell sharply in November especially expectations for future sales.
Housing Starts for November
Consensus Forecast, Annualized Rate: 1.222 million
Consensus Range: 1.200 to 1.252 million
Building Permits
Consensus Forecast: 1.258 million
Consensus Range: 1.250 to 1.275 million
Housing starts and permits have been struggling this year with no improvement the expectation for November. Forecasters see November starts coming in at a 1.222 million annualized rate vs 1.228 million in October with permits seen at a 1.258 million rate vs 1.265 million (1.263 million initially reported and since revised).
Existing Home Sales for November
Consensus Forecast, Annualized Rate: 5.190 million
Consensus Range: 5.110 to 5.300 million
In the prior report for October, existing home sales posted their first gain since March but none is expected for November. The month's consensus is a 5.190 million annualized rate vs October's 5.220 million. Resales of both single-family homes and condos have been showing similar weakness this year.
Federal Funds Target for December 18 & 19 Meeting
Consensus Forecast, Midpoint: 2.375%
Consensus Range: 2.25% to 2.50%
Solid economic growth without, however, increasing inflation pressure is expected to be enough for FOMC policy makers to stick to their forecasts and raise the federal funds target one increment to a range between 2.25 and 2.50 percent with an implied target of 2.375 percent. The key to the meeting will be the quarterly FOMC projections and whether the three incremental rate hikes that have been penciled in for 2019 will be reduced or scratched out completely. Updates on the Fed's balance-sheet unwinding are also expected.
Initial Jobless Claims for December 15 week
Consensus Forecast: 221,000
Consensus Range: 212,000 to 226,000
Initial jobless claims dropped suddenly back to historic lows in the December 8 week, down 27,000 to 206,000 which sets up expectations for a bounce higher in the December 15 week to a consensus 221,000. The December 15 week will track the mid-month sample period of the monthly employment report and will offer key hints on what to expect for payroll growth and the unemployment rate in December.
Philadelphia Fed Manufacturing Index for December
Consensus Forecast: 17.5
Consensus Range: 11.2 to 22.0
A bounce back to a stronger rate of growth at 17.5 is the call for December's Philly Fed manufacturing index which in November missed expectations at 12.9. Growth in new orders slowed noticeably in November at the same time that backlog orders contracted, factors that may limit activity in December.
Index of Leading Economic Indicators for November
Consensus Forecast, Month-to-Month Change: 0.0%
Consensus Range: 0.0% to 0.1%
The consensus for November's index of leading economic indicators is no change vs a marginal 0.1 percent increase in October that was held down by a fall in the stock market and a rise in unemployment claims. Claims also look to be a negative in the November report along with weakness in the factory workweek.
Durable Goods Orders for November
Consensus Forecast, Month-to-Month Change: 1.5%
Consensus Range: -0.2% to 3.0%
Durable Goods Orders, Ex-Transportation
Consensus Forecast: 0.3%
Consensus Range: 0.2% to 0.7%
Durable Goods Orders, Core Capital Goods (Nondefense Ex-Aircraft)
Consensus Forecast: 0.3%
Consensus Range: 0.1% to 1.0%
Bounce back strength is the expectation for November durable goods orders where the consensus is calling for a 1.5 percent gain vs October's drop of 4.3 percent (revised from an initial 4.4 percent). Ex-transportation orders are expected to improve to a 0.3 percent increase vs a 0.2 percent increase in October (revised from an initial 0.1 percent). Capital goods orders have been weak, coming in unchanged in October after two prior declines. Expectations for core capital goods (nondefense ex-air) are calling for a November rebound to a 0.3 percent gain.
Real GDP: 3rd Quarter, 3rd Estimate, Annualized Rate
Consensus Forecast: 3.5%
Consensus Range: 3.3% to 3.6%
Real Consumer Spending, Annualized Rate
Consensus Forecast: 3.6%
Consensus Range: 3.5% to 3.6%
GDP Price Index
Consensus Forecast: 1.7%
Consensus Range: 1.7% to 1.7%
The third estimate for third-quarter GDP is expected to come in at the 3.5 percent rate of both the first and second estimates. Consumer spending is expected to hold at 3.6 percent of the second estimate. A favorable inventory build was a major positive in the third quarter with residential investment and especially net exports both weaknesses. The GDP price index is seen unchanged at 1.7 percent.
Personal Income for November
Consensus Forecast, Month-to-Month Change: 0.3%
Consensus Range: 0.2% to 0.4%
Consumer Spending
Consensus Forecast, Month-to-Month Change: 0.3%
Consensus Range: 0.2% to 0.4%
PCE Price Index
Consensus Forecast, Month-to-Month Change: 0.1%
Consensus Range: 0.0% to 0.1%
PCE Price Index
Consensus Forecast, Year-on-Year Change: 1.8%
Consensus Range: 1.8% to 2.0%
Core PCE Price Index
Consensus Forecast, Month-to-Month Change: 0.2%
Consensus Range: 0.2% to 0.2%
Core PCE Price Index
Consensus Forecast, Year-on-Year Change: 1.9%
Consensus Range: 1.8% to 1.9%
Personal income is seen rising 0.3 percent in November while consumer spending, which has been strong, is expected to also increase 0.3 percent. The core PCE price index, which excludes both food and energy, is seen posting a 0.1 percent monthly rise for a year-on-year rate of 1.8 percent. The consensus for the overall PCE price index is 0.2 percent for a year-on-year rate of 1.9 percent.
Consumer Sentiment Index, Final December
Consensus Forecast: 97.5
Consensus Range: 95.5 to 98.0
Expected to hold at the preliminary score, Econoday's consensus for the final consumer sentiment index for December is expected to come in at 97.5. Current conditions firmed solidly in the preliminary December report in what was a favorable indication for holiday spending.
|
