|
However much optimism encourages the hope that the US and China will still reach an amicable agreement, realism may suggest that the tariffs which have been put in place, the latest as well those the US first imposed in March 2018, are now a fixed and permanent component of the global economy. Yet how the new round of trade actions will affect future trade and future economic growth is of course unknown. The week's run of economic data was rich in trade data which we'll assess one by one, offering a description of conditions at the time when US-China talks (whether temporarily or not) broke down. But before breaking down trade, let's first focus on central bank policy and more specificaly expectations for central bank policy which are turning dovish on a global scale.

The Reserve Bank of New Zealand cut its policy rate during the week, joining the Bank of India this year in an outright downshift to accommodation. New Zealand's overnight cash rate (OCR) moved from 1.75 percent to a new record low of 1.50 percent, in line with expectations. This rate had been on hold since a 25 basis point cut in late 2016 but officials had advised at their previous meeting in March that the next move would likely be lower. The statement noted that global economic growth has weakened since the middle of last year and that domestic growth has also slowed. Although officials consider employment to be near its maximum sustainable level, they expect labour market tightness to moderate over 2019 and, as a result, project inflationary pressures to remain subdued. Headline CPI inflation fell to 1.3 percent in the three months to March, well below the mid-point of the RBNZ's target range of 1.0 to 3.0 percent.
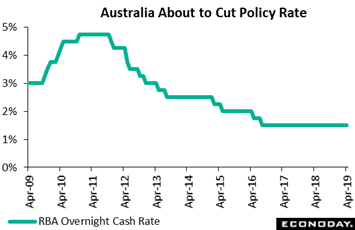 Although the Reserve Bank of Australia made no changes at its May meeting, the text of the statement makes it clear that an upcoming cut in rates is a possibility. The bank, as expected, held its main policy rate unchanged at a record low 1.50 percent. This rate was last changed in August 2016 when it was cut by 25 basis points. The statement again characterized the outlook for the global economy as "reasonable" but argued that downside risks have increased. Turning to the domestic outlook, officials once again noted strong labour market conditions and a "welcome" pick-up in wage growth but also acknowledged that weakness in household incomes and the ongoing "adjustment" in housing markets had impacted consumer spending. Officials noted that recent inflation data had been weaker than they expected and suggest that inflationary pressures remain subdued across much of the economy. This weakness prompted them to revise down their near term forecasts for underlying inflation from 2.0 percent to 1.75 percent in 2019 and from 2.25 percent to 2.0 percent in 2020. Officials still see spare capacity in the economy and believe further improvement in employment will be needed for inflation to hold on target. If this improvement does not take place and inflation doesn't show life in the coming months, it seems likely that officials may well vote for a rate cut. Although the Reserve Bank of Australia made no changes at its May meeting, the text of the statement makes it clear that an upcoming cut in rates is a possibility. The bank, as expected, held its main policy rate unchanged at a record low 1.50 percent. This rate was last changed in August 2016 when it was cut by 25 basis points. The statement again characterized the outlook for the global economy as "reasonable" but argued that downside risks have increased. Turning to the domestic outlook, officials once again noted strong labour market conditions and a "welcome" pick-up in wage growth but also acknowledged that weakness in household incomes and the ongoing "adjustment" in housing markets had impacted consumer spending. Officials noted that recent inflation data had been weaker than they expected and suggest that inflationary pressures remain subdued across much of the economy. This weakness prompted them to revise down their near term forecasts for underlying inflation from 2.0 percent to 1.75 percent in 2019 and from 2.25 percent to 2.0 percent in 2020. Officials still see spare capacity in the economy and believe further improvement in employment will be needed for inflation to hold on target. If this improvement does not take place and inflation doesn't show life in the coming months, it seems likely that officials may well vote for a rate cut.
 But when it comes to stimulus, there are no ifs ands or buts for the Bank of Japan which published minutes of its March meeting during the week. Members of the Monetary Policy Board (MPB) left policy settings unchanged at the meeting, keeping the short-term rate for excess reserves at minus 0.1 percent and retaining the target level for the 10-year government bond yield at around zero percent. Members also concluded that maintaining the BoJ's purchases of government bonds at an annual pace of Y80 trillion would be appropriate to meet their 10-year yield target. The policy settings retained at the March meeting were also left unchanged at the BoJ's subsequent policy meeting held in late April. Officials' assessment of the domestic outlook, however, appears less certain than before. Although the MPB still expects the economy to continue "expanding moderately" and inflation to increase "gradually" towards their target level of 2.0 percent, they also argued that there are "high uncertainties" facing the outlook for both economic activity and prices. In response to this uncertainty, the MPB at their April meeting decided that it needs to make clearer that it will "persistently continue with powerful monetary easing". Yes, that's very clear enough. But when it comes to stimulus, there are no ifs ands or buts for the Bank of Japan which published minutes of its March meeting during the week. Members of the Monetary Policy Board (MPB) left policy settings unchanged at the meeting, keeping the short-term rate for excess reserves at minus 0.1 percent and retaining the target level for the 10-year government bond yield at around zero percent. Members also concluded that maintaining the BoJ's purchases of government bonds at an annual pace of Y80 trillion would be appropriate to meet their 10-year yield target. The policy settings retained at the March meeting were also left unchanged at the BoJ's subsequent policy meeting held in late April. Officials' assessment of the domestic outlook, however, appears less certain than before. Although the MPB still expects the economy to continue "expanding moderately" and inflation to increase "gradually" towards their target level of 2.0 percent, they also argued that there are "high uncertainties" facing the outlook for both economic activity and prices. In response to this uncertainty, the MPB at their April meeting decided that it needs to make clearer that it will "persistently continue with powerful monetary easing". Yes, that's very clear enough.
 Whether this accommodative spirit is justified by slowing or contraction in global trade data is the question we'll now turn to by looking at the week's trade reports from the major economies. March trade data out of the US were mixed, headlined by a comparatively moderate $50.0 billion monthly deficit. Exports improved in the month though they did get a boost from price-related increases for petroleum-based products including industrial supplies. Exports of services were flat and exports capital goods including aircraft were down. Both of these are usually central areas of US strength. And year-on-year growth in total exports, as tracked in the red line of the graph, slowed to 2.3 percent. This reading broke higher to 8.6 percent in March 2017 then peaked at 10.1 percent in February last year before trending lower. Also trending lower are the blue columns of year-on-year import growth, which was at 2.1 percent in March after having, however, dipped to minus 0.5 percent in February in what was the first negative showing since September 2016. Whether tariffs or the risks of tariffs are to blame for the downturns in trends is unknown but one conclusion is clear: cross-border trade in the US is not accelerating. Whether this accommodative spirit is justified by slowing or contraction in global trade data is the question we'll now turn to by looking at the week's trade reports from the major economies. March trade data out of the US were mixed, headlined by a comparatively moderate $50.0 billion monthly deficit. Exports improved in the month though they did get a boost from price-related increases for petroleum-based products including industrial supplies. Exports of services were flat and exports capital goods including aircraft were down. Both of these are usually central areas of US strength. And year-on-year growth in total exports, as tracked in the red line of the graph, slowed to 2.3 percent. This reading broke higher to 8.6 percent in March 2017 then peaked at 10.1 percent in February last year before trending lower. Also trending lower are the blue columns of year-on-year import growth, which was at 2.1 percent in March after having, however, dipped to minus 0.5 percent in February in what was the first negative showing since September 2016. Whether tariffs or the risks of tariffs are to blame for the downturns in trends is unknown but one conclusion is clear: cross-border trade in the US is not accelerating.
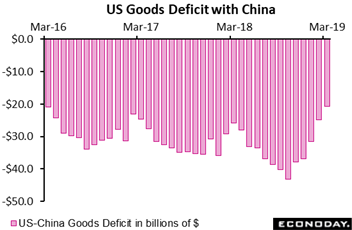 Another certainty is that US trade with China has been drying up which, putting questions of growth aside, is a definite plus for GDP. The US goods deficit with China totaled $20.8 billion in March, a level last approached in March 2016 and a 5-year low. The US-China deficit has come down in each of the last five reports and is less than half of October's peak at $43.1 billion. For calculating GDP, it's not the level of the deficit that counts, it's the direction the deficit is going that counts and the improvement with China is a definite plus. Improvement in net exports represented 1/3 of the first quarter's 3.2 percent US growth rate (and a contribution that is not likely to be revised away given March's results). But more times than not over the last two years, trade has had a negative pull on GDP and at times a very sizable pull including a 2 point negative contribution in the third quarter of last year. What should we expect for the second quarter? The latest round of tariff actions will be a factor for May, trade data for which won't be published until late June. Until then, anecdotal reports will have to suffice including possible early indications in the coming week's manufacturing reports from the New York and Philadelphia Feds. Another certainty is that US trade with China has been drying up which, putting questions of growth aside, is a definite plus for GDP. The US goods deficit with China totaled $20.8 billion in March, a level last approached in March 2016 and a 5-year low. The US-China deficit has come down in each of the last five reports and is less than half of October's peak at $43.1 billion. For calculating GDP, it's not the level of the deficit that counts, it's the direction the deficit is going that counts and the improvement with China is a definite plus. Improvement in net exports represented 1/3 of the first quarter's 3.2 percent US growth rate (and a contribution that is not likely to be revised away given March's results). But more times than not over the last two years, trade has had a negative pull on GDP and at times a very sizable pull including a 2 point negative contribution in the third quarter of last year. What should we expect for the second quarter? The latest round of tariff actions will be a factor for May, trade data for which won't be published until late June. Until then, anecdotal reports will have to suffice including possible early indications in the coming week's manufacturing reports from the New York and Philadelphia Feds.
 Tracking the unfolding tariff effect on China's economy will also have to depend on anecdotal reports initially, especially the CLFP and Caixin manuafcturing reports. Official data for April trade were posted in the latest week showing a narrowing in China's goods surplus to $13.84 billion in March, which was far short of expectations for $39 billion and well under the $32.67 billion surplus in March. Exports fell 2.7 percent on the year in April with weakness broad-based across major trading partners. Exports to the US fell 13.2 percent on the year in April after increasing 3.7 percent in March, while year-on-year growth in exports to the European Union slowed from 23.8 percent to 6.2 percent. Exports to Japan also weakened, down 16.4 percent on the year after increasing 9.6 percent previously. However much China's economy has been growing so far this year, acceleration isn't coming from trade. Tracking the unfolding tariff effect on China's economy will also have to depend on anecdotal reports initially, especially the CLFP and Caixin manuafcturing reports. Official data for April trade were posted in the latest week showing a narrowing in China's goods surplus to $13.84 billion in March, which was far short of expectations for $39 billion and well under the $32.67 billion surplus in March. Exports fell 2.7 percent on the year in April with weakness broad-based across major trading partners. Exports to the US fell 13.2 percent on the year in April after increasing 3.7 percent in March, while year-on-year growth in exports to the European Union slowed from 23.8 percent to 6.2 percent. Exports to Japan also weakened, down 16.4 percent on the year after increasing 9.6 percent previously. However much China's economy has been growing so far this year, acceleration isn't coming from trade.
 Year-on-year trends in German goods trade appear similar to the US trends, that is declining rates of growth for both imports and exports. But Germany, unlike the US, runs a trade surplus which came in at an adjusted €20.0 billion in March, up from €18.7 billion in February. And despite this year's concern over German manufacturing, exports proved very strong in March totaling a record €112.7 billion. Year-on-year growth also improved but modestly, to 3.0 percent from February's 2.9 percent. Annual export growth is coming off a peak in July last year at 10.1 percent and actually fell into marginal contraction in November last year. What to expect for the second quarter may not be promising, at least that's the indication from manufacturing orders which slumped in the first quarter and were down 6.1 percent year-on-year in March and a 2-year low. Net exports pulled down Germany's third-quarter performance and were neutral in the fourth-quarter and, based on the trade data, look to have been neutral in the first-quarter as well. How Germany does in a global trade war will be of special interest. Year-on-year trends in German goods trade appear similar to the US trends, that is declining rates of growth for both imports and exports. But Germany, unlike the US, runs a trade surplus which came in at an adjusted €20.0 billion in March, up from €18.7 billion in February. And despite this year's concern over German manufacturing, exports proved very strong in March totaling a record €112.7 billion. Year-on-year growth also improved but modestly, to 3.0 percent from February's 2.9 percent. Annual export growth is coming off a peak in July last year at 10.1 percent and actually fell into marginal contraction in November last year. What to expect for the second quarter may not be promising, at least that's the indication from manufacturing orders which slumped in the first quarter and were down 6.1 percent year-on-year in March and a 2-year low. Net exports pulled down Germany's third-quarter performance and were neutral in the fourth-quarter and, based on the trade data, look to have been neutral in the first-quarter as well. How Germany does in a global trade war will be of special interest.
 Unlike Germany and the US, rates of trade growth are accelerating in the UK though import growth is outstripping growth in exports. Exports jumped 10.2 percent on the year in March for the best showing since June last year while imports, however, rose 12.0 percent for a third straight double-digit showing. The UK goods deficit did narrow on a monthly basis, from £14.43 billion in February to £13.65 billion in March and this marked a second successive reduction in the red ink. Yet current levels remain historically very high. For GDP, trade has been a pronounced negative cutting first-quarter growth in half which came in at a year-on-year 1.8 percent and equating with a nominal deficit of £18.34 billion, almost double the £9.44 billion recorded in the previous quarter, and, at some 3.4 percent of nominal GDP, the largest deficit in more than 50 years. But the deterioration was largely due to imports of unspecified goods which include non-monetary gold and so muddies the picture. Unlike Germany and the US, rates of trade growth are accelerating in the UK though import growth is outstripping growth in exports. Exports jumped 10.2 percent on the year in March for the best showing since June last year while imports, however, rose 12.0 percent for a third straight double-digit showing. The UK goods deficit did narrow on a monthly basis, from £14.43 billion in February to £13.65 billion in March and this marked a second successive reduction in the red ink. Yet current levels remain historically very high. For GDP, trade has been a pronounced negative cutting first-quarter growth in half which came in at a year-on-year 1.8 percent and equating with a nominal deficit of £18.34 billion, almost double the £9.44 billion recorded in the previous quarter, and, at some 3.4 percent of nominal GDP, the largest deficit in more than 50 years. But the deterioration was largely due to imports of unspecified goods which include non-monetary gold and so muddies the picture.
 Like the UK, France also runs a deficit which totaled €5.32 billion in March vs a €4.13 billion shortfall in February. But the deterioration masked a monthly 1.1 percent rise in exports that was offset, however, by a 3.6 percent jump in imports. Overseas sales were supported mainly by strength in aeronautical products while imports were boosted by a surge in fuel supplies. France's first quarter gap stood at €13.69 billion, a 10.6 percent increase versus fourth quarter 2018 which helps explain why total net exports subtracted 0.3 percentage points from the nation's first quarter GDP. Like the UK, France also runs a deficit which totaled €5.32 billion in March vs a €4.13 billion shortfall in February. But the deterioration masked a monthly 1.1 percent rise in exports that was offset, however, by a 3.6 percent jump in imports. Overseas sales were supported mainly by strength in aeronautical products while imports were boosted by a surge in fuel supplies. France's first quarter gap stood at €13.69 billion, a 10.6 percent increase versus fourth quarter 2018 which helps explain why total net exports subtracted 0.3 percentage points from the nation's first quarter GDP.
 Australia has an enviable trade profile, showing flat growth for imports and double-digit growth for exports which, however, is nevertheless slowing. Exports of goods and services rose a year-on-year 12.0 percent in March which is down from 20 percent peaks in October and November last year. On a monthly basis, the value of exports fell 1.8 percent in March, slowing from growth of 0.6 percent in February. Slowing or not, Australia is still enjoying strong growth in exports of rural goods and is posting a strong net surplus overall, at A$4.949 billion in March vs A$5.140 billion in February. Australia has an enviable trade profile, showing flat growth for imports and double-digit growth for exports which, however, is nevertheless slowing. Exports of goods and services rose a year-on-year 12.0 percent in March which is down from 20 percent peaks in October and November last year. On a monthly basis, the value of exports fell 1.8 percent in March, slowing from growth of 0.6 percent in February. Slowing or not, Australia is still enjoying strong growth in exports of rural goods and is posting a strong net surplus overall, at A$4.949 billion in March vs A$5.140 billion in February.
 Exports in Canada had also been growing at a double-digit pace but have slowed this year to the low single digits, at 1.8 percent in March. Yet at C$49.9 billion in March, exports increased in 9 of 11 goods sectors for a monthly increase of 3.2 percent. Imports in March totaled C$52.3 billion, rising in 8 of 11 sections, with consumer goods increasing 6.7 percent. Sales to the U.S., Canada's main trading partner, were up 1.1 percent, mainly on higher exports of motor vehicles and crude oil, while imports fell 0.4 percent, primarily on lower purchases of aircraft. Canada's trade surplus with the US widened from C$3.0 billion in February to C$3.6 in March while its deficit with non-US partners deepened from C$6.4 billion in February to a record C$6.8 in March. Exports in Canada had also been growing at a double-digit pace but have slowed this year to the low single digits, at 1.8 percent in March. Yet at C$49.9 billion in March, exports increased in 9 of 11 goods sectors for a monthly increase of 3.2 percent. Imports in March totaled C$52.3 billion, rising in 8 of 11 sections, with consumer goods increasing 6.7 percent. Sales to the U.S., Canada's main trading partner, were up 1.1 percent, mainly on higher exports of motor vehicles and crude oil, while imports fell 0.4 percent, primarily on lower purchases of aircraft. Canada's trade surplus with the US widened from C$3.0 billion in February to C$3.6 in March while its deficit with non-US partners deepened from C$6.4 billion in February to a record C$6.8 in March.
 The latest week was the weakest of the year for the global stock markets which had been rallying strongly. The reason for the rally was simply the accommodative stance of global banks which had offset slowing rates of global growth and global trade not to mention uncertainty over the US-China trade talks. Once the talks took their negative turn in the week, losses were substantial including a weekly drop of 4.5 percent for the Shanghai composite and a 2.3 percent dip for the Dow industrials. Year-to-date gains are still very strong for both, at 17.9 and 11.0 percent respectively, though year-on-year change tells a different story. The Shanghai composite had finally emerged into positive ground on this basis back in April but is once again underwater and sizably so, at 7.4 percent on Friday's close. The Dow emerged from the year-on-year negative column in February but may be heading there again, slowing in the week from the high single digits to the mid-single digits on Friday at 4.9 percent. And perhaps continuing to limit interest in the stock market is the strong interest investors are showing for bonds including US Treasuries where the 10-year yield is at 2.47 percent which, despite an accelerating US government deficit, is 50 basis points below this time last year. The latest week was the weakest of the year for the global stock markets which had been rallying strongly. The reason for the rally was simply the accommodative stance of global banks which had offset slowing rates of global growth and global trade not to mention uncertainty over the US-China trade talks. Once the talks took their negative turn in the week, losses were substantial including a weekly drop of 4.5 percent for the Shanghai composite and a 2.3 percent dip for the Dow industrials. Year-to-date gains are still very strong for both, at 17.9 and 11.0 percent respectively, though year-on-year change tells a different story. The Shanghai composite had finally emerged into positive ground on this basis back in April but is once again underwater and sizably so, at 7.4 percent on Friday's close. The Dow emerged from the year-on-year negative column in February but may be heading there again, slowing in the week from the high single digits to the mid-single digits on Friday at 4.9 percent. And perhaps continuing to limit interest in the stock market is the strong interest investors are showing for bonds including US Treasuries where the 10-year yield is at 2.47 percent which, despite an accelerating US government deficit, is 50 basis points below this time last year.
The only major economy that didn't post trade data this last week was Japan which in an April release showed a 2.4 percent year-on-year decline in March exports, the fourth such drop in a row and reflecting a downturn among Japan's Asian trading partners. The rundown we had in the week showed areas of slowing in the US, China, Germany and perhaps Australia and Canada as well. Whether global trade slows on net or actually contracts looks to be the major story of the 2019 global economy. And other developments, such as inward acceleration for domestic services, may prove related stories.
**Jeremy Hawkins and Brian Jackson contributed to this article
The coming week will be a busy one but not on Monday or Friday which, for high level economic data at least, will be quiet. Tuesday's global session opens with German CPI where strength is expected followed by the UK labour market report and Eurozone industrial production where for the latter no bounce back is the call. Wednesday's session will be focused on China which will release fixed asset investment, industrial production and also retail sales in data for April. This data batch in the month of March proved strong. German GDP will follow later on Wednesday as will US retail sales and US industrial production, both of which are expected to show a mix of flat to respectable results. A sleeper on Wednesday will be May's Empire State manufacturing report out the US which could offer the first clues on US tariff actions as could Thursday's manufacturing report from the Philadelphia Fed.
German CPI for Preliminary April (Tue 02:00 EDT; Tue 06:00 GMT; Tue 08:00 CEST)
Consensus Forecast, Month-to-Month: 2.0%
Consensus Forecast, Year-over-Year: 2.1%
After rising a monthly 0.4 percent in March at a yearly 1.3 percent pace, the consensus for German consumer prices in April is calling for acceleration to a 1.0 percent gain on the month and 2.1 percent on the year. Energy was up in March while food was down.
UK Labour Market Report for April (Tue 04:30 EDT; Tue 08:30 EDT; Tue 09:30 BST)
ILO Unemployment Rate
Consensus Forecast: 3.9%
Average Weekly Earnings
Consensus Forecast, Year-over-Year: 3.3%
The ILO unemployment rate is expected to hold steady in April at 3.9 percent following a strong March report. Average hourly earnings including bonuses are expected to slip 1 tenth to a year-on-year 3.4 percent.
Eurozone Industrial Production for March (Tue 05:00 EDT; Tue 09:00 GMT; Tue 11:00 CEST)
Consensus Forecast, Month-to-Month: -0.3%
Consensus Forecast, Year-over-Year: -0.7%
Eurozone Industrial production proved much less weak than expected in February, edging down a monthly 0.2 percent with the consensus for March at a decrease of 0.3 percent. Year-on-year, forecasters are looking for deeper contraction at minus 0.7 percent following minus 0.3 percent in February.
China: Fixed Asset Investment for April (Tue 22:00 EDT; Wed 02:00 GMT; Wed 10:00 CST)
Consensus Forecast, Year-over-Year: 6.4%
Fixed asset investment rose at an as-expected 6.3 percent on the year in March for a 2 tenths gain from January/February. Forecasters see April fixed asset investment rising 6.4 percent.
China: Industrial Production for April (Tue 22:00 EDT; Wed 02:00 GMT; Wed 10:00 CST)
Consensus Forecast: 6.3%
Industrial production in March easily beat expectations at an 8.5 percent year-on-year rise and showing broad-based strength. Forecasters see April production at a 6.3 percent yearly pace.
China: Retail Sales for April (Tue 22:00 EDT; Wed 02:00 GMT; Wed 10:00 CST)
Consensus Forecast: 8.6%
Retail sales in April are expected to rise a year-on-year 8.6 percent vs what was unexpected strength in March at 8.7 percent. Gains in March were wide and included particularly strong growth for home improvements.
German GDP First-Quarter Flash (Wed 02:00 EDT; Wed 06:00 GMT; Wed 08:00 CEST)
Consensus Forecast, Quarter-on-Quarter: 0.4%
Consensus Forecast, Year-over-Year: 0.7%
The first-quarter flash estimate for German First-quarter is 0.4 percent quarter-on-quarter growth and year-over-year growth of 0.7 percent. This would compare with no quarterly change in the fourth quarter and a yearly growth rate of 0.6 percent.
US Retail Sales for April (Wed 08:30 EDT; Wed 12:30 GMT)
Consensus Forecast: 0.3%
Consensus Range: -0.1% to 0.6%
Retail Sales Ex-Autos
Consensus Forecast: 0.7%
Consensus Range: 0.2% to 0.9%
Retail Sales Ex-Autos & Gas
Consensus Forecast: 0.4%
Consensus Range: 0.0% to 0.7%
Retail Sales Control Group (Ex-Food Services, Ex-Autos, Ex-Gas, Ex-Building Materials)
Consensus Forecast: 0.4%
Consensus Range: 0.0% to 0.4%
Mixed acceleration is what forecasters see for April retail sales, at a headline consensus increase of 0.3 percent vs what was a much stronger-than-expected 1.6 percent jump in March. Unit vehicle sales were slowed sharply in April which looks to give a strong relative boost to ex-auto sales which are expected to rise 0.7 percent. Ex-autos & less gasoline are expected at 0.4 percent with the control group also at 0.4 percent.
Canada: CPI for April (Wed 08:30 EDT; Wed 12:30 GMT)
Consensus Forecast, Month-to-Month: 0.3%
Consensus Forecast, Year-over-Year: 1.9%
April Consumer prices in Canada are expected at a monthly 0.3 percent gain for a yearly 1.9 percent rate. The CPI in March rose an as-expected 0.7 percent on the month with the yearly rate of 1.9 percent also coming in at expectations.
US: Empire State Index for May (08:00 EDT; 12:30 GMT)
Consensus Forecast: 9.9
Consensus Range: 5.0 to 11.0
May's Empire State report could offer the first indications on the immediate effects of US tariff hikes against China. Forecasters see the Empire State index holding steady at 9.9 vs a solid 10.1 in May.
US Industrial Production for April (Wed 09:15 EDT, Wed 13:15 GMT)
Consensus Forecast, Month-to-Month Change: 0.0%
Consensus Range: -0.5% to 0.4%
US Manufacturing Production
Consensus Forecast, Month-to-Month Change: 0.1%
Consensus Range: -0.1% to 0.3%
US Capacity Utilization Rate
Consensus Forecast: 78.8%
Consensus Range: 78.6% to 79.1%
Manufacturing production in the US has been very weak, showing no change in March after sharp declines of 0.3 and 0.5 percent in the prior two months but with only a 0.1 percent gain the consensus for April. Forecasters see headline industrial production in April showing no change with capacity utilization also showing no change at 78.8 percent.
US Housing Starts for April (Thu 08:30 EDT, Thu 12:30 GMT)
Consensus Forecast, Annualized Rate: 1.200 million
Consensus Range: 1.160 to 1.230 million
Building Permits
Consensus Forecast: 1.290 million
Consensus Range: 1.269 to 1.300 million
Significant improvement is the forecast for April housing starts and permits which in March came in far below expectations in what was another unwelcome set back for the US housing sector. Starts in April are expected to come in at a 1.200 million annual pace vs March's 1.139 million. The consensus for permits is 1.290 million vs 1.280 million in March (revised from an initial 1.269 million).
US: Philadelphia Fed Manufacturing Index for May (Thu 08:30; Thu 12:15 GMT)
Consensus Forecast: 9.3
Consensus Range: 5.8 to 10.0
In what may offer early indications on US tariffs against China, the Philadelphia Fed's manufacturing index for May expected to firm to 9.3 vs 8.5 in an April report that showed special strength for new orders.
|
