|
Equities fared extremely well in 2013 despite off and on worries about momentum for the U.S.
and global economies and the potential impact of Fed tapering of QE. But the New Year started on the downside for stocks. On the economic indicator front, news was mixed but leaning net positive.
 Stocks dipped this past week—primarily on a moderately sizeable sell-off the first day of trading in the New Year. However, the week got off to a slow start with most indexes little changed, although the Dow hit a record high with a modest gain. Markets were slow and thin ahead of the New Year’s holiday. Stocks dipped this past week—primarily on a moderately sizeable sell-off the first day of trading in the New Year. However, the week got off to a slow start with most indexes little changed, although the Dow hit a record high with a modest gain. Markets were slow and thin ahead of the New Year’s holiday.
Moderate gains were seen Tuesday, resulting in indexes reaching record levels and the S&P 500 showing its biggest annual gain (29.6 percent) since 1997. The Dow had its biggest increase (26.5 percent) since 1995. Underlying the daily boost to stocks were improvements in consumer confidence and the Case-Shiller house price index.
 After the Wednesday holiday, stocks sold off Thursday on profit taking and investors waiting to sell in the new tax year. The Dow fell 0.8 percent while the S&P 500 declined 0.9 percent. This was despite economic news being favorable for the day, notably two manufacturing indexes and construction outlays. After the Wednesday holiday, stocks sold off Thursday on profit taking and investors waiting to sell in the new tax year. The Dow fell 0.8 percent while the S&P 500 declined 0.9 percent. This was despite economic news being favorable for the day, notably two manufacturing indexes and construction outlays.
Friday was mixed but mostly little changed with little economic news.
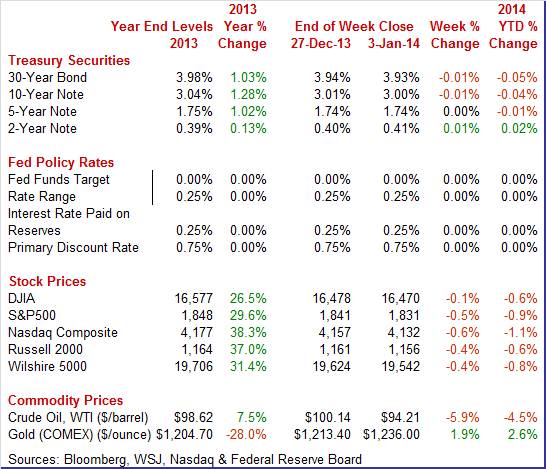
Equities were down this past week. The Dow was down 0.1 percent; the S&P 500, down 0.5 percent; the Nasdaq, down 0.6 percent; the Russell 2000, down 0.4 percent; and the Wilshire 5000, down 0.4 percent.
 For 2013 on an end-of-year over end-of-year basis, major indexes were up as follows: the Dow, up 26.5 percent; the S&P 500, up 29.6 percent; the Nasdaq, up 38.3 percent; the Russell 2000, up 37.0 percent; and the Wilshire 5000, up 31.4 percent. For 2013 on an end-of-year over end-of-year basis, major indexes were up as follows: the Dow, up 26.5 percent; the S&P 500, up 29.6 percent; the Nasdaq, up 38.3 percent; the Russell 2000, up 37.0 percent; and the Wilshire 5000, up 31.4 percent.
Clearly, it was a banner year for stocks and several factors came into play. Economic news wavered but was mostly positive—especially with the consumer showing better-than-expected strength. Housing grew steadily until late in the year. Manufacturing oscillated.
 But despite consternation about whether the Fed would taper its latest bond buying programs, the Fed’s QE strategy worked. The key effects actually had impact. Obviously, interest rates were exceptionally low. But the Fed’s strategy to change risk preferences actually worked. With rates so low, there was essentially no return on safe assets. Investors had to shift to riskier assets, including stocks. Now the question is how fast will the Fed taper and later unwind and eventually raise interest rates. Most within the Fed say it will be a very slow process. This bodes well for the economy and equities although there is a diversity of opinion on how much equity growth will ease from a very robust 2013. But despite consternation about whether the Fed would taper its latest bond buying programs, the Fed’s QE strategy worked. The key effects actually had impact. Obviously, interest rates were exceptionally low. But the Fed’s strategy to change risk preferences actually worked. With rates so low, there was essentially no return on safe assets. Investors had to shift to riskier assets, including stocks. Now the question is how fast will the Fed taper and later unwind and eventually raise interest rates. Most within the Fed say it will be a very slow process. This bodes well for the economy and equities although there is a diversity of opinion on how much equity growth will ease from a very robust 2013.
 For the year-to-date, major indexes are down as follows: the Dow, down 0.6 percent; the S&P 500, down 0.9 percent; the Nasdaq, down 1.1 percent; the Russell 2000, down 0.6 percent; and the Wilshire 5000, down 0.8 percent. For the year-to-date, major indexes are down as follows: the Dow, down 0.6 percent; the S&P 500, down 0.9 percent; the Nasdaq, down 1.1 percent; the Russell 2000, down 0.6 percent; and the Wilshire 5000, down 0.8 percent.
For the month of December, major indexes are up as follows: the Dow, up 3.0 percent; the S&P 500, up 2.4 percent; the Nasdaq, up 2.9 percent; the Russell 2000, up 1.8 percent; and the Wilshire 5000, up 2.6 percent.
For the fourth quarter of 2013, major indexes are up as follows: the Dow, up 9.3 percent; the S&P 500, up 9.9 percent; the Nasdaq, up 10.7 percent; the Russell 2000, up 8.4 percent; and the Wilshire 5000, up 9.6 percent.
Weekly percent change column reflects percent changes for all components except interest rates. Interest rate changes are reflected in simple differences.
 Treasury yields ended the week little changed despite moderate volatility during the week. Treasury yields ended the week little changed despite moderate volatility during the week.
Rates dipped at the start of the week as traders saw attractive yields with rates near two-year highs. Many saw that those yields had already priced in Fed taper and an improving economy. But rates jumped moderately on Tuesday on stronger consumer confidence and higher home prices—both of which were seen as letting the Fed taper. Also, banks bolstered their balance sheets before year end, with usage of the Fed’s test reverse repo facility surging.
 After the Wednesday holiday, yields dropped Thursday despite mostly favorable economic news. Momentum had swung on whether the economy would be strong enough for the Fed to complete taper by the end of 2014. With little economic news, rates were little changed Friday.. After the Wednesday holiday, yields dropped Thursday despite mostly favorable economic news. Momentum had swung on whether the economy would be strong enough for the Fed to complete taper by the end of 2014. With little economic news, rates were little changed Friday..
For this past week Treasury rates were down as follows: 3-month T-bill, unchanged; the 2-year note, up 1 basis point; the 5-year note, unchanged; the 7-year note, down 1 basis point; the 10-year note, down 1 basis point; and the 30-year bond, down 1 basis point.
For 2013, Treasury rates were changed as follows: 3-month T-bill, up 2 basis points; the 2-year note, up 13 basis points; the 5-year note, up 102 basis points; the 7-year note, up 127 basis points; the 10-year note, up 128 basis points; and the 30-year bond, up 103 basis points.
 The price of crude fell sharply this past week. The spot price of West Texas Intermediate fell almost a dollar a barrel on Monday as traders saw oil as oversold, especially given that U.S. inventories were near a record high on a seasonal basis. The price of crude fell sharply this past week. The spot price of West Texas Intermediate fell almost a dollar a barrel on Monday as traders saw oil as oversold, especially given that U.S. inventories were near a record high on a seasonal basis.
 After little change Tuesday and a holiday Wednesday, WTI dropped a little over $3 per barrel on worries that the Fed would continue to cut monetary stimulus by tapering QE purchases. Crude fell another buck and a quarter on news from a holiday delayed report on petroleum stocks, indicating gains in inventories of distillates. WTI posted its largest weekly loss in 19 months. After little change Tuesday and a holiday Wednesday, WTI dropped a little over $3 per barrel on worries that the Fed would continue to cut monetary stimulus by tapering QE purchases. Crude fell another buck and a quarter on news from a holiday delayed report on petroleum stocks, indicating gains in inventories of distillates. WTI posted its largest weekly loss in 19 months.
Net for the week, the spot price for West Texas Intermediate dropped $5.93 per barrel to settle at $94.21.
Net for 2013 on an end of year basis, the spot price for West Texas Intermediate increased $6.92 per barrel to settle at $98.62 for a 7.5 percent gain.
Data for the close of 2013 show moderately strong forward momentum going into the New Year.
 Construction seems to be the hot sector of the economy—at least for now. Outlays have seen a string of strong monthly increases, including a 1.0 percent jump in November, following a 0.9 percent gain the month before. Construction seems to be the hot sector of the economy—at least for now. Outlays have seen a string of strong monthly increases, including a 1.0 percent jump in November, following a 0.9 percent gain the month before.
The November increase was led by the nonresidential and residential components. Private nonresident outlays surged 2.7 percent, following a rise of 0.5 percent in October.
Private residential construction posted a 1.9 percent rebound in November after a 0.4 percent dip the month before. Both the new single-family and new multifamily subcomponents rose notably. New single-family home outlays increased 1.8 percent, following a decline of 0.4 percent in October. New multifamily spending advanced 0.9 percent after a 3.4 percent jump the month before. Residential outlays excluding new home outlays rebounded 2.2 percent, following a dip of 1.3 percent the month before.
Public outlays declined 1.8 percent but followed a sizeable 3.1 percent boost in October.
Total construction spending was up 5.9 percent on a year-ago basis in November. compared to 7.2 percent the month before.
Overall, the construction sector is doing its part to boost fourth quarter growth for the overall economy. The latest construction numbers add to the argument that GDP growth will be healthy in the fourth quarter. However, there are signs of softening ahead in construction in the housing sector.
 Despite a rise in pending home sales in the latest report, the housing sector appears to be leveling off in coming months. Pending home sales posted a fractional gain of 0.2 percent in November, a weaker-than-expected result but one that nevertheless ends five straight months of declines going all the way back to June. The year-on-year rate, at minus 1.6 percent, is weak but at least steady. Despite a rise in pending home sales in the latest report, the housing sector appears to be leveling off in coming months. Pending home sales posted a fractional gain of 0.2 percent in November, a weaker-than-expected result but one that nevertheless ends five straight months of declines going all the way back to June. The year-on-year rate, at minus 1.6 percent, is weak but at least steady.
The two strongest regions were mixed with the South up 2.3 percent in the month but the Midwest down 3.1 percent. The two weakest regions are also mixed with the West up 1.8 percent but the Northeast down 2.7 percent.
Final sales of existing homes have been one of 2013's biggest economic disappointments, sliding through the second half of the year as rising mortgage rates, low supply of homes on the market, and high home prices have held down sales. And the latest report doesn't point to much improvement ahead. The pending home sales index has declined a cumulative 8.6 percent since the recent peak in May 2013.
 Thanks in part to limited supply, home price momentum was solid and steady going into year-end. The Case-Shiller adjusted home price index for October showed a gain of 1.0 percent for the 20-city index. This matched September's gain and compares with gains of 0.9 and 0.6 percent in the two prior months. The year-on-year gain of 13.6 percent was up 3 tenths for the best rate of the recovery. Thanks in part to limited supply, home price momentum was solid and steady going into year-end. The Case-Shiller adjusted home price index for October showed a gain of 1.0 percent for the 20-city index. This matched September's gain and compares with gains of 0.9 and 0.6 percent in the two prior months. The year-on-year gain of 13.6 percent was up 3 tenths for the best rate of the recovery.
Gains swept all 20 cities for a 3rd month in a row, led in October by Miami at plus 1.9 percent and followed by Atlanta and Detroit, both at 1.8 percent. Year-on-year rates were strongest out West with several above 20 percent.
While the housing sector may see some slowing ahead, manufacturing appears to be on a mild upswing based on the latest national manufacturing surveys.
Manufacturing growth picked up slightly in the latter half of December based on Markit's PMI which came in at 55.0 for final December, the best reading since January and up from 54.4 at mid-month and compared to 54.7 in final November. New orders at 56.1—up from 54.5 in November—also were solid and sustainable. New export orders were soft but positive, steady at 51.4, while total backlog orders were climbing, at 52.8 which is solid for this reading. In a positive for the jobs outlook, December got a boost from employment which rose nearly 2 points to 54.0 to indicate the best rate of monthly growth since March.
 Turning to the ISM report, the nation's manufacturing sector rose solidly into year-end based on the ISM composite index which held steady, at 57.0 in December versus 57.3 in November. This is well into positive territory. Turning to the ISM report, the nation's manufacturing sector rose solidly into year-end based on the ISM composite index which held steady, at 57.0 in December versus 57.3 in November. This is well into positive territory.
The news is good for coming months as the report was led by new orders which rose 6 tenths for a 5th straight plus 60 reading at 64.2. This was the best rate of monthly growth since April 2010.
Production was also very strong, at 62.2 for a 6th straight plus 60 reading. The strength in production is giving employment a noticeable lift, up 4 tenths to 56.9 which was the best reading since June 2011.
The readings in these two reports are just about right—not unsustainably high which could trigger a reversal. The manufacturing sector, after sputtering a bit at mid-year, is once again at the forefront of the economy. However, a recent regional survey for December was not so favorable.
 Texas factory activity decelerated in December but was in positive territory for the eighth month in a row, according to business executives responding to the Texas Manufacturing Outlook Survey. The production index, a key measure of state manufacturing conditions, fell from 16.9 to 7.1, indicating output grew at a slower pace than in November. Texas factory activity decelerated in December but was in positive territory for the eighth month in a row, according to business executives responding to the Texas Manufacturing Outlook Survey. The production index, a key measure of state manufacturing conditions, fell from 16.9 to 7.1, indicating output grew at a slower pace than in November.
Other measures of current manufacturing activity reflected slower or no growth. The new orders index came in near zero, suggesting demand was largely unchanged from November after seven months of increases. The shipments index also fell to around zero, coming in at 0.7, after rising to 14.8 last month. The capacity utilization index declined 8 points to 8.6.
Perceptions of broader business conditions were more optimistic in December. The general business activity index posted its seventh consecutive positive reading and edged up to 3.1 but fell a little short of expectations for 4.0. The company outlook index also posted its seventh positive reading in a row and shot up 7.5 points to 15.5, its highest level in nearly two years.
However, expectations regarding future business conditions were notably more optimistic in December. The index of future general business activity spiked 16 points to 22.8, reaching its highest reading in nearly three years. The index of future company outlook rose to 24.1, a 21-month high. Indexes for future manufacturing activity also pushed further into positive territory.
Overall, national manufacturing activity is showing a mild strengthening. The Dallas Fed survey showed deceleration in December but regional surveys often show variances from short-term national trends. And even the Dallas report was favorable regarding future business conditions. It appears that manufacturing is on a moderate upswing.
 The latest Conference Board report showed improvement in consumer confidence but it was a mixed report. Consumers are not particularly optimistic about the future but they are giving very strong scores to current conditions. The consumer confidence index rose a strong 6.1 points in December to 78.1. The present situation component rose 2.7 points to 76.2 which is the highest level for this reading of the whole recovery. The expectations component did rise more than 8 points but from a very soft November to 79.4 which is still well below a recent peak of 91.1 in June. The latest Conference Board report showed improvement in consumer confidence but it was a mixed report. Consumers are not particularly optimistic about the future but they are giving very strong scores to current conditions. The consumer confidence index rose a strong 6.1 points in December to 78.1. The present situation component rose 2.7 points to 76.2 which is the highest level for this reading of the whole recovery. The expectations component did rise more than 8 points but from a very soft November to 79.4 which is still well below a recent peak of 91.1 in June.
The gain in the present situation includes another monthly best, for the jobs-hard-to-get subcomponent which fell a sizable 1.6 percentage points to 32.5 percent. This is a closely watched reading and will lift expectations for strength in the December employment report.
Among the subcomponents on the expectations side, employment shows strong improvement with the spread narrowing sharply between pessimists and optimists with the pessimists still leading. The income subcomponent is not showing much improvement, with slightly more seeing a decrease ahead than an increase.
 Growth slowed this month in the Chicago economy but from unsustainably high rates of growth in November and October. The Chicago PMI slowed to 59.1 versus 63.0 and 65.9 in the two prior months. Aside from November and October, the December reading is the best since March last year. Growth slowed this month in the Chicago economy but from unsustainably high rates of growth in November and October. The Chicago PMI slowed to 59.1 versus 63.0 and 65.9 in the two prior months. Aside from November and October, the December reading is the best since March last year.
Order growth was strong but did slow with new orders at 60.7, down from notably high 68.8 and 74.3 in the two prior months but still above September's 58.9. These were all very strong rates of monthly growth for new orders which have been on the plus 50 side to show growth every month since November last year. And backlog orders are piling up at 58.3 for a 3rd straight monthly build.
This report, which covers all major sectors of the Chicago economy, showed overall strength despite the deceleration.
Based on the latest data in recent weeks, the fourth quarter is sizing up to be somewhat strong. Manufacturing is picking up steam. Housing currently is strong in terms of construction and prices but there may be softening ahead. And the consumer is gaining confidence and spending more. The recovery continues and would grow even more if employment gained more strength.
The marquee report this week is the December jobs report out on Friday. The warm up act is ADP’s private employment report on Wednesday. The payroll numbers will likely play more of a role in how fast or not the Fed continues to taper. The Fed has already discounted its earlier 6.5 percent threshold for policy reconsideration. The Fed’s minutes of the December 17-18 FOMC meeting will hint at where the Fed is headed at the January 28-29 policy meeting.
Factory orders in October were down to flat with a headline 0.9 percent decline and with the ex-transportation reading unchanged. The October total followed a 1.8 percent boost in September while excluding transportation slipped 0.1 percent for the earlier month. For October, the orders data were broadly weak showing a big decline for defense goods, a decline in core capital goods, and a third straight decline for consumer goods. The breakdown between durable goods and non-durable goods showed declines for each.
Factory orders Consensus Forecast for November 13: +1.6 percent
Range: +1.3 to +2.6 percent
The composite index from the ISM non-manufacturing survey indicated a slowing in this sector, posting in November at 59.3, compared to 55.4 the prior month. Still, growth is positive. But monthly growth in new orders remained very solid, at 56.4 for only a small dip from October. Strength in orders points to strength in general activity in the months ahead.
ISM non-manufacturing composite index Consensus Forecast for December 13: 54.8
Range: 53.9 to 55.1
The U.S. international trade gap improved in October and for the right reason—exports were up. The October trade gap narrowed to $40.6 billion from $43.0 billion in September. Exports rebounded 1.8 percent after slipping 0.1 percent in September. Imports rose 0.4 percent in October, following a 1.6 percent increase the month before. The shrinking of the trade shortfall was led by goods excluding petroleum which narrowed to $39.3 billion from $41.8 billion in September. The petroleum deficit nudged down to $19.6 billion from $19.9 billion in September. The services surplus improved to $19.6 billion from $19.4 billion.
International trade balance Consensus Forecast for November 13: -$39.9 billion
Range: -$42.5 billion to -$38.9 billion
ADP private payroll employment gained 215,000 in November. This compares to the government estimate for growth in private payroll jobs of 196,000 for November.
ADP private payrolls Consensus Forecast for December 13: 205,000
Range: 130,000 to 218,000
The Minutes of the December 17-18 FOMC meeting are scheduled for release at 2:00 p.m. ET. With the December 18, 2013 FOMC decision to begin tapering asset purchases in January 2014, the focus of the minutes will be if there are any hints on the path of future tapering.
Consumer credit outstanding rose a sharp $18.2 billion in October and, in a positive indication on the consumer, included a rare gain for revolving credit. In a welcome sign for retailers, revolving credit rose $4.3 billion for the first gain since May, a gain that hinted at consumer willingness to borrow and spend going into the holidays. Non-revolving credit increased $13.9 billion reflecting both strength for vehicle loans but also further gains for the student loan component which is being inflated by government acquisitions from private lenders.
Consumer credit Consensus Forecast for November 13: +$14.2 billion
Range: +$6.3 billion to +$20.0 billion
Initial jobless claims, clouded by holiday volatility, were little changed in the December 28 week, down 2,000 to 339,000. In an offset, the prior week is revised 3,000 higher to 341,000. The 4-week average was not favorable, up a steep 8,500 to a 357,250 level that is more than 30,000 above the level in late November.
Jobless Claims Consensus Forecast for 1/4/14: 331,000
Range: 305,000 to 355,000
Nonfarm payroll employment in November advanced 203,000, following an increase of 200,000 for October and after a gain of 175,000 for September. Private payrolls expanded 196,000 after gaining 214,000 in October. The unemployment rate dropped to 7.0 percent from 7.3 percent in October. The November number was the lowest in five years. Wage growth posted at 0.2 percent, following a 0.1 percent rise in October. The average workweek nudged up to 34.5 hours from 34.4 hours.
Nonfarm payrolls Consensus Forecast for December 13: 200,000
Range: 120,000 to 225,000
Private payrolls Consensus Forecast for December 13: 189,000
Range: 120,000 to 220,000
Unemployment rate Consensus Forecast for December 13: 7.0 percent
Range: 6.9 to 7.1 percent
Average workweek Consensus Forecast for December 13: 34.5 hours
Range: 34.4 to 34.6 hours
Average hourly earnings Consensus Forecast for December 13: +0.2 percent
Range: +0.1 to +0.3 percent
Wholesale inventories opened the quarter with a very sharp 1.4 percent rise in October, above a 1.0 percent rise in sales but still enough in line to keep the stock-to-sales ratio unchanged for a third month at 1.18. This ratio was up from a recent low of 1.17 in June and July. Inventories and sales of autos continue to swing wildly in the wholesale sector reflecting heavy activity. Auto inventories jumped 2.7 percent in the month while sales fell 4.5 percent to raise the stock-to-sales ratio very steeply to 1.45. But this may reverse in November given that month's extraordinarily strong vehicle sales at the retail level. Data on factory inventories, released last week with the factory orders report, shows only an incremental build in October in line with an incremental increase in sales.
Wholesale inventories Consensus Forecast for November 13: +0.5 percent
Range: +0.1 to +0.8 percent
R. Mark Rogers is the author of The Complete Idiot’s Guide to Economic Indicators, Penguin Books.
He can also be found on a weekly broadcast talking about the U.S. economy, the easiest way to find him is by going to iTunes and searching for "Simply Economics."
Econoday Senior Writer Mark Pender contributed to this article.
|
