|
While there was other economic news, the focus was on the December employment report. Payroll growth was anemic while the unemployed rate dropped, but for the wrong reason.
 Most major indexes were up for the week but with the Dow being an exception. Most major indexes were up for the week but with the Dow being an exception.
However, the week got off to a negative start. An unexpectedly weak non-manufacturing ISM reported tugged down on indexes. But on Tuesday, stocks rallied due in part to bargain hunting following the pullback during the first few trading days of the New Year. Stocks also were lifted by the November international trade release that indicated the trade deficit narrowed by much more than anticipated. The Dow rallied more than 100 points for the day—the first triple digit gain for 2014.
 At mid-week, equities were mixed. The ADP private payroll report was somewhat better than expected while the FOMC minutes drew little market reaction. The minutes largely reflected the complexity that the Fed faces not just during taper but during unwinding the balance sheet. Thursday also was mixed and little changed. Jobless claims came in essentially as expected. Traders stood on the sidelines ahead of the Friday jobs report. At mid-week, equities were mixed. The ADP private payroll report was somewhat better than expected while the FOMC minutes drew little market reaction. The minutes largely reflected the complexity that the Fed faces not just during taper but during unwinding the balance sheet. Thursday also was mixed and little changed. Jobless claims came in essentially as expected. Traders stood on the sidelines ahead of the Friday jobs report.
Except for the Dow, bad news was good news on Friday. Payroll job growth was anemic as the 74,000 rise in payroll employment came in below the consensus lower bound. The soft gain for December led markets to believe that the Fed would take a more cautious approach to tapering its bond buying programs.
Equities were mostly up this past week. The S&P 500 was up 0.6 percent; the Nasdaq, up 1.0 percent; the Russell 2000, up 0.7 percent; and the Wilshire 5000, up 0.7 percent. The Dow slipped 0.2 percent;
For the year-to-date, major indexes are mixed as follows: the Dow, down 0.8 percent; the S&P 500, down 0.3 percent; the Nasdaq, unchanged; the Russell 2000, up 0.1 percent; and the Wilshire 5000, down 0.2 percent.
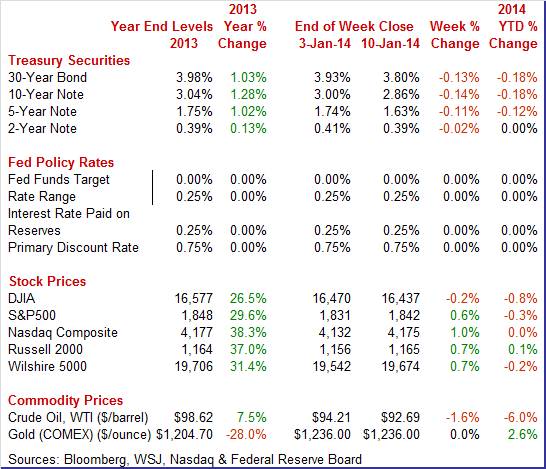
Weekly percent change column reflects percent changes for all components except interest rates. Interest rate changes are reflected in simple differences.
 The week’s movement in Treasury yields can be summarized by daily movement on Wednesday and Friday—both labor market related. Yields firmed Wednesday after a better-than-expected ADP private payroll number. This led to belief in a moderately healthy payroll number to be released with the Friday jobs report. The week’s movement in Treasury yields can be summarized by daily movement on Wednesday and Friday—both labor market related. Yields firmed Wednesday after a better-than-expected ADP private payroll number. This led to belief in a moderately healthy payroll number to be released with the Friday jobs report.
However, rates fell significantly Friday after the anemic employment situation report for December. Traders interpreted the report to suggest that the Fed will go slowly on further taper moves.
For this past week Treasury rates were down as follows: 3-month T-bill, down _2 basis points; the 2-year note, down 2 basis points; the 5-year note, down 11 basis points; the 7-year note, down 15 basis points; the 10-year note, down 14 basis points; and the 30-year bond, down 13 basis points.
 Trading for spot WTI was quiet this past week except for Wednesday. At mid-week, the spot price for West Texas Intermediate fell a buck and a quarter. This was due to inventories of gasoline and distillates jumping more than twice as much as analysts forecast for the week ended January 3. Wednesday’s price was the lowest in six weeks. WTI firmed slightly Friday after the jobs report suggested that the Fed will taper cautiously. Trading for spot WTI was quiet this past week except for Wednesday. At mid-week, the spot price for West Texas Intermediate fell a buck and a quarter. This was due to inventories of gasoline and distillates jumping more than twice as much as analysts forecast for the week ended January 3. Wednesday’s price was the lowest in six weeks. WTI firmed slightly Friday after the jobs report suggested that the Fed will taper cautiously.
Net for the week, the spot price for West Texas Intermediate declined $1.52 per barrel to settle at $92.69.
The big news was a lousy jobs report.
 Not tapering likely is back on the Fed’s table for the next policy meeting—yes, not tapering further. Total payroll jobs in December grew a meager 74,000, following a revised increase of 241,000 for November (originally up 203,000) and after an unrevised gain of 200,000 for October. Expectations for December were for a 200,000 increase. The net revisions for October and November were up 38,000. Private payrolls gained 87,000 after rising 226,000 in November. Expectations were for a 189,000 boost in December. Not tapering likely is back on the Fed’s table for the next policy meeting—yes, not tapering further. Total payroll jobs in December grew a meager 74,000, following a revised increase of 241,000 for November (originally up 203,000) and after an unrevised gain of 200,000 for October. Expectations for December were for a 200,000 increase. The net revisions for October and November were up 38,000. Private payrolls gained 87,000 after rising 226,000 in November. Expectations were for a 189,000 boost in December.
 The unemployment rate declined to 6.7 percent from 7.0 percent in November. This is the first time the unemployment rate has fallen below 7 percent in 60 months. The rate declined due to a sharp drop in the labor force. Household employment rose 143,000 in December but the labor force dropped 347,000. The unemployment rate declined to 6.7 percent from 7.0 percent in November. This is the first time the unemployment rate has fallen below 7 percent in 60 months. The rate declined due to a sharp drop in the labor force. Household employment rose 143,000 in December but the labor force dropped 347,000.
Looking at a broader measure of underemployment, the labor market did not show improvement in December. The Labor Department’s “U-6” measure—which includes underemployed as well as unemployed—was unchanged at 13.1 percent. And the median duration of unemployment edged up to 17.1 weeks from 17.0 weeks in November.
Turning back to the payroll portion of the report, goods-producing jobs declined by 3,000 after a 51,000 boost in November.  Construction dropped 16,000 in December, following a 19,000 increase the month before. The monthly swings in this subcomponent can be affected by large seasonal factors this time of year. Manufacturing jobs advanced 9,000 after a 31,000 gain in November. Construction dropped 16,000 in December, following a 19,000 increase the month before. The monthly swings in this subcomponent can be affected by large seasonal factors this time of year. Manufacturing jobs advanced 9,000 after a 31,000 gain in November.
Private service-providing jobs increased 90,000, following a 175,000 boost in November. Employment in retail trade rose by 55,000 in December. In December, wholesale trade added 15,000 jobs. Employment in professional and business services continued to trend up in December (+19,000). Temporary help services added 40,000 jobs in December, while employment in accounting and bookkeeping services declined by 25,000.
Government contracted by 13,000 after rising 15,000 in November.
Wage growth came in a modest 0.1 percent, following a 0.2 percent rise in November. Analysts projected a 0.2 percent gain. The average workweek nudged down to 34.4 hours from 34.5 hours. The median forecast was for 34.5 hours.
Looking ahead, a positive in this report was a 0.4 percent boost in production worker hours in manufacturing which suggests a healthy gain in December’s manufacturing component in industrial production. However, the private wages & salaries component in personal income is likely to be soft as private aggregate earnings declined 0.2 percent in December.
The December jobs report was decidedly weaker than expected and the decline in the unemployment rate was actually a negative due to the basis for the dip. The big question is whether the latest employment report was an aberration or not. Other employment data have been more favorable, including ADP and various surveys. Some economists suggest that atypically cold weather weighed on job growth—which also would imply a sluggish January. In terms of public policy, the latest jobs report raises questions on whether the Fed should taper further at the end of the month and whether Congress should extend unemployment benefits.
 Consumers are modestly optimistic about the economy, based on expansion of consumer credit. Consumer credit rose $12.3 billion in November—a solid gain. Details showed a rare back-to-back gain for revolving credit, up a modest $0.5 billion but following a $4.0 billion gain in October which was the third largest gain of the whole recovery. The last time revolving credit rose 2 months in a row was back in January and February of last year. Consumers are modestly optimistic about the economy, based on expansion of consumer credit. Consumer credit rose $12.3 billion in November—a solid gain. Details showed a rare back-to-back gain for revolving credit, up a modest $0.5 billion but following a $4.0 billion gain in October which was the third largest gain of the whole recovery. The last time revolving credit rose 2 months in a row was back in January and February of last year.
Non-revolving credit once again showed a sizable gain, at $11.9 billion reflecting both strength for vehicle loans but also further gains for the student loan component which is being inflated by government acquisitions from private lenders.
The revolving credit component of this report is not quite on fire but it does point to consumer willingness to spend and borrow at the beginning of the holiday shopping season.
 Exports rose and imports fell making for a sharply narrower-than-expected trade deficit of $34.3 billion in November versus the Econoday consensus for $39.9 billion. This was the lowest monthly deficit since October 2009. More good news came from the revision to October where the gap narrowed to $39.3 billion compared to the initial estimate for $40.6 billion. Exports rose and imports fell making for a sharply narrower-than-expected trade deficit of $34.3 billion in November versus the Econoday consensus for $39.9 billion. This was the lowest monthly deficit since October 2009. More good news came from the revision to October where the gap narrowed to $39.3 billion compared to the initial estimate for $40.6 billion.
The goods gap narrowed by $4.9 billion in November, to $53.9 billion versus $58.8 billion, at the same time that the services surplus widened slightly, to $19.7 billion vs $19.5 billion.
 Much of the improvement in the goods gap, about $4.3 billion, was due to a smaller petroleum gap, at $15.2 billion versus October's $19.5 billion. This reflects both a monthly dip in oil prices but also a dip in volume as domestic crude production is on the rise. Much of the improvement in the goods gap, about $4.3 billion, was due to a smaller petroleum gap, at $15.2 billion versus October's $19.5 billion. This reflects both a monthly dip in oil prices but also a dip in volume as domestic crude production is on the rise.
Exports rose 0.9 percent in November to $194.9 billion led by higher exports for industrial supplies, commercial aircraft, and capital goods excluding autos. Imports fell 1.4 percent with contraction in industrial supplies, which includes the decline in crude oil, as well as declines in foods/feeds/beverages and consumer goods.
The latest report on international trade adds to the recent run of mostly strong economic data and will raise estimates for fourth-quarter GDP growth. However, the Fed will not have the advance report on fourth GDP for its January 28-29 FOMC meeting as GDP is released the next day after the policy decision.
 Overall, the fourth quarter was moderately strong. But it may have ended on a soft note—not just according to employment but also reflecting the ISM non-manufacturing report. Overall, the fourth quarter was moderately strong. But it may have ended on a soft note—not just according to employment but also reflecting the ISM non-manufacturing report.
New orders moved suddenly into reverse for ISM's non-manufacturing sample, pulling down the index which fell 9 tenths to 53.0. New orders, the leading indicator in this report, fell to 49.4 from 56.4 in November. This is the first sub-50 reading for new orders, which had been especially strong through much of the second half of last year, since July 2009.
But coincidental and lagging indications are positive including a steady reading for business activity and a big bounce back for employment, up 3.3 points to 55.8.
The December 17-18 FOMC meeting saw plenty of debate about when to taper asset purchases and how fast cut its asset purchase programs. At the latest FOMC meeting, most participants saw tapering just after the meeting as appropriate (planned start of taper in January). However, “several” participants did not want to reduce asset purchases yet as unemployment was seen as still elevated. Also, some wanted larger taper than voted for ($10 billion reduction in monthly purchases split evenly between Treasuries and mortgage-backed securities). Of those in favor of tapering, a modest cut was preferred by many. Regarding thresholds for policy debate (6.5 percent unemployment rate and 2.5 percent expected inflation), most wanted no change in the language. The Fed clearly debated the costs of continuing quantitative easing. Most were concerned that additional asset purchases will add to the difficulty of unwinding. Also, most see the impact of QE declining as purchases continue. Additional purchases were seen as adding to the risk of balance sheet losses in the future. The debate began to warm up on a potential new policy tool—reverse repos. Some saw usefulness in raising the reverse repo rate while others did not see its usefulness in exit strategy. Still, most FOMC participants see exceptionally low fed funds rates in coming years.
Economic news was mixed but mostly negative with a very disappointing jobs report and sluggish ISM non-manufacturing indicator. But this time of year, weather can play a role in distorting trends despite seasonal adjustment procedures (which are not perfect). The bottom line is that the Fed is likely to be soaking in every notable indicator between now and the January 28-29 policy meeting before deciding on the next taper move.
This week sees a variety of key indicators. The retail sales report is the headliner and will indicate how the holiday sales season played out. Housing has been oscillating—with pending existing home sales notably soft. Homebuilders will weigh in with the housing market index and also housing starts. Manufacturing has been picking up steam and December industrial production posts this week.
The U.S. Treasury monthly budget report showed the deficit dropping to $135.2 billion in November versus $172.1 billion in November last year. Two months into the government's fiscal year, the deficit is down 22 percent, benefiting from last year's payroll tax hike along with declines in spending including spending on defense which was down 10 percent during the first two months of fiscal 2014. Looking ahead, the month of December typically shows a deficit. Over the past 10 years, the average deficit for December has been $22.7 billion and $61.7 billion over the past 5 years. The December 2012 deficit came in at $1.2 billion.
Treasury Statement Consensus Forecast for December 13: +$44.0 billion
Range: +44.0 billion to +$49.0 billion.
The NFIB Small Business Optimism Index improved to 92.5 in November versus October's 91.6. Plans to increase employment led the month's gain with current job openings also showing an increase. Still, small businesses increased employment by only 0.05 workers per firm in the month, which is half the rate of October. In a negative for November, small business owners are now expressing specific concern over the cost and availability of insurance as ObamaCare begins to unroll.
NFIB Small Business Optimism Index Consensus Forecast for December 13: 93.5
Range: 92.8 to 94.0
Retail sales in November jumped 0.7 percent, following a rise of 0.6 percent the month before. Autos were a big part of the November boost, gaining 1.8 percent after a 1.1 percent increase in October. Excluding autos, sales increased 0.4 percent after advancing 0.5 percent in October. But gasoline prices tugged down on this measure. Gas station sales dropped 1.1 percent in November, following a 0.4 percent decrease the month before. Excluding both autos and gasoline, sales jumped 0.6 percent in November, matching the October pace. In the core, strength was seen in furniture & home furnishings, electronics & appliance stores, building materials & garden equipment, nonstore retailers, and food services & drinking places.
Retail sales Consensus Forecast for December 13: 0.0 percent
Range: -0.5 to +0.3 percent
Retail sales excluding motor vehicles Consensus Forecast for December 13: +0.4 percent
Range: 0.0 to +0.8 percent
Less motor vehicles & gasoline Consensus Forecast for December 13: +0.3 percent
Range: +0.1 to +0.6 percent
Import prices in November posted at minus 0.6 percent for a second straight month and at only plus 0.1 percent for export prices following a 0.6 percent decline in October. Year-on-year rates show negative readings for the fourth straight month for both, at minus 1.5 percent for import prices and at minus 1.6 percent on the export side. Petroleum was the key negative factor for a second straight month on the import side, falling 3.5 percent in November following a 3.2 percent monthly decline in October. Excluding petroleum, import prices showed gains for the two months but only very small ones, 0.1 percent for both November and October.
Import prices Consensus Forecast for December 13: +0.4 percent
Range: -0.5 to +0.7 percent
Export prices Consensus Forecast for December 13: +0.1 percent
Range: -0.2 to +0.2 percent
Business inventories in October gained 0.7 percent and were roughly in line with a 0.5 percent rise in business sales that left the stock-to-sales ratio unchanged at 1.29. Inventories among retailers rose 0.8 percent in October, also roughly in line with a 0.5 percent rise in retail sales during the month with the stock-to-sales ratio in the sector unchanged at 1.42. Retail inventories of vehicles jumped in the month but so did sales. As already noted, the strong retail sales report for November—which showed strength across most components—points to easing inventory pressure for November.
Business inventories Consensus Forecast for November 13: +0.3 percent
Range: +0.2 to +0.7 percent
The producer price index in November PPI edged down 0.1 percent, following a decline of 0.2 percent in October. The core rate, which excludes both food and energy, eased to a 0.1 percent rise after gaining 0.2 in October. At the headline level, weakness was led by energy which decreased 0.4 percent, following a decrease of 1.5 percent in October. Gasoline prices declined 0.7 percent in November after a drop of 3.8 percent in October. Food prices also were sluggish, posting at unchanged after rebounding rebounded 0.8 percent October. Leading the rise within the core, prices for light motor trucks increased 0.6 percent. Higher prices for agricultural machinery and equipment also contributed to the advance in the finished core index. Tugging down on the core was a 0.8 percent drop in prices for passenger cars and a 0.5 percent decrease for computers.
PPI Consensus Forecast for December 13: +0.4 percent
Range: -0.1 to +0.7 percent
PPI ex food & energy Consensus Forecast for December 13: +0.1 percent
Range: 0.0 to +0.2 percent
The Empire State manufacturing index came in barely above zero in the December report, at 0.98 for the third flat reading in a row with the new orders index at minus 3.54 following the prior month's minus 5.53. Unfilled orders extended their long run of contraction and at a very steep minus 24.10. Shipments, however, expanded, at 7.66 versus November's minus 0.53. Other readings were also weak including a speeding up of delivery times, which indicates that capacity in the supply chain is loose, with inventories showing a major contraction, one that likely points to an intentional draw as manufacturers in the region prepare for weakness ahead.
Empire State Manufacturing Survey Consensus Forecast for January 13: 3.30
Range: -1.00 to 7.00
The Beige Book is in preparation for the January 28-29 FOMC meeting. Again, focus is likely on the labor market—especially after the disappointing jobs report for December.
The consumer price index in November posted a flat reading after dipping 0.1 percent in October. The CPI excluding food and energy firmed to 0.2 percent, following a rise of 0.1 percent the prior month. The energy component pulled down on overall inflation as energy slipped 1.0 percent, following a drop of 1.7 percent in October. Gasoline declined 1.6 percent after falling 2.9 percent the month before. Food price inflation was 0.1 percent in November, matching the pace in October. Within the core, increases in the indexes for shelter and airline fares accounted for most of the increase, with the indexes for recreation and for used cars and trucks also rising. The indexes for apparel, for household furnishings and operations, and for new vehicles all declined in November.
CPI Consensus Forecast for December 13 +0.3 percent
Range: +0.1 to +0.4 percent
CPI ex food & energy Consensus Forecast for December 13: +0.1 percent
Range: 0.0 to +0.2 percent
Initial jobless claims fell 15,000 in the January 4 holiday week to 330,000. But in an offset, the prior week was revised 6,000 higher to 345,000. Though the 4-week average was down a sharp 9,750 to 349,000, it was still trending nearly 20,000 higher than the month-ago comparison. Continuing claims, reported with a 1-week lag, were also trending higher, up 50,000 in the December 28 week to 2.865 million. The 4-week average of 2.872 million was more than 75,000 higher than the month-ago comparison.
Jobless Claims Consensus Forecast for 1/11/14: 327,000
Range: 315,000 to 338,000
The general business conditions index of the Philadelphia Fed's Business Outlook Survey for December posted at 7.0 in December to show a slightly better monthly rate of growth than November's 6.5 reading. New orders were very solid, at 15.4 on top of 11.8 in November to point to rising activity in general conditions in the months ahead. Shipments were also strong, at 13.3 for a big gain from November's 5.6. But the increase in output did not do much for employment which was flat though in the plus column at 2.2.
Philadelphia Fed survey Consensus Forecast for January 13: 8.7
Range: 2.0 to 10.0
The NAHB housing market index in December shot back up 4 points to 58 to match the recovery best first posted in August, ending 3 months of slowing. The report said December's gain reflected a release of demand that was held down by uncertainty tied to the government shutdown in October. The December breakdown shows gains across all three components led by a 6 point jump in present sales to 64 which is a new recovery best for this reading. Sales 6 months out were at 62, which is up 2 points from November but still 6 points short of August's peak at 68. Traffic continues to lag noticeably though it is up 3 points to 44.
NAHB housing market index Consensus Forecast for January 13: 57.5
Range: 55.0 to 60.0
Housing starts surged in November—and this time it was not just the multifamily component. Housing starts in November jumped 22.7 percent after rising 1.8 percent in October. The November starts annualized level of 1.091 million units was up 29.6 percent on a year-ago basis. September starts were 0.873 million and October was 0.889 million. The gain in starts was led by the multifamily component which increased 26.8 percent after dipping 2.0 percent in October. The single-family component also was strong in November, jumping 20.8 percent after a 3.8 percent increase the month before. Permits declined but after a strong October. This time strength is in the single-family component. Permits decreased 3.1 percent in November after gaining 6.7 percent the month before. The 1.007 million pace was up 7.9 percent on the year.
Housing starts Consensus Forecast for December 13: 0.985 million-unit rate
Range: 0.915 million to 1.050 million-unit rate
Housing permits Consensus Forecast for December 13: 1.015 million-unit rate
Range: 0.970 million to 1.045 million-unit rate
Industrial production for November surged on utilities output but manufacturing was quite healthy for the month. Overall industrial production jumped 1.1 percent, following a 0.1 percent rise in October. The November index level passed its pre-recession peak. Turning to major components, manufacturing jumped 0.6 percent, following a rise of 0.5 percent in October. Motor vehicles played a key role in boosting November manufacturing output. Motor vehicle assemblies jumped to an annualized pace of 11.61 million units from 11.10 million in October. Nonetheless, output was quite healthy elsewhere. Excluding motor vehicles, manufacturing increased 0.5 percent after gaining 0.6 percent in October. Capacity utilization for total industry jumped to 79.0 percent from 78.2 percent in October. Analysts anticipated 78.4 percent.
Industrial production Consensus Forecast for December 13: +0.3 percent
Range: -0.1 to +0.8 percent
Manufacturing production component Consensus Forecast for December 13: +0.3 percent
Range: -0.2 to +0.4 percent
Capacity utilization Consensus Forecast for December 13: 79.1 percent
Range: 78.8 to 79.3 percent
The Reuter's/University of Michigan's consumer sentiment index was unchanged at 82.5 for final December versus mid-month. But it was the comparison with final November's 75.1 that pointed to an especially good month for consumer spending in December. And there was also some momentum in the comparison between early December and later December, and it was in the current conditions component which rose to 98.6 from 97.9 earlier in the month and from 88.0 in final November. The latest was the best reading since July. Weakness in the latest report came in the less immediate component of expectations, which slipped 6 tenths from mid-month to 72.1. But decidedly favorable was the comparison with November's 66.8.
Consumer sentiment Consensus Forecast for preliminary January 13: 83.5
Range: 80.0 to 88.0
The Labor Department’s Job Openings and Labor Turnover Survey indicated that were 3.925 million job openings on the last business day of October, little changed from September's 3.883 million. The hires rate (3.3 percent) and separations rate (3.1 percent) were also little changed in October. The number of openings was little changed for total private and government. The number of job openings increased in arts, entertainment, and recreation and in the Midwest region and was little changed in the remaining industries and regions. There were 4.249 million total separations in October, compared to 4.477 million in September. The number of total separations fell for total private but rose for government. In October, the quits rate was unchanged at 1.7 percent for total nonfarm. The layoffs and discharges rate fell in October to 1.1 percent.
JOLTS job openings Consensus Forecast for November 13: 3.930 million
Range: 3.900 million to 3.970 million
R. Mark Rogers is the author of The Complete Idiot’s Guide to Economic Indicators, Penguin Books.
He can also be found on a weekly broadcast talking about the U.S. economy, the easiest way to find him is by going to iTunes and searching for "Simply Economics."
Econoday Senior Writer Mark Pender contributed to this article.
|
