|
With little economic news this past week in the U.S., markets focused on disappointing corporate news, overseas announcements, and moving funds to safety after a robust 2013.
 Too little economic news can rattle markets—especially if the little amount of news is negative. For this week, the big news (and negative) was from overseas. After being closed Monday, stocks were actually up for the most part on Tuesday. The International Monetary Fund boosted its forecast for global growth this year on expected improvement in the economies of the U.S. and the U.K. The Dow slipped on declines in Verizon and Johnson & Johnson. But broader markets were led up by Delta and Alcoa. Too little economic news can rattle markets—especially if the little amount of news is negative. For this week, the big news (and negative) was from overseas. After being closed Monday, stocks were actually up for the most part on Tuesday. The International Monetary Fund boosted its forecast for global growth this year on expected improvement in the economies of the U.S. and the U.K. The Dow slipped on declines in Verizon and Johnson & Johnson. But broader markets were led up by Delta and Alcoa.
Wednesday was mostly positive but the Dow eased on disappointing results from IBM. Leading other indexes were Netflix, SanDisk, and United Technologies.
 Thursday saw mixed results with U.S. indicators as jobless claims slipped but soft numbers were seen in FHFA house prices, existing home sales, and leading indicators. But what really tugged down on equities was news from China. China’s January flash manufacturing PMI slid to a six month low of 49.6 from 50.5 the month before. This offset somewhat net favorable readings coming out of Europe. The data from China continued to push down on stocks globally on Friday. Additionally, investors simply chose to move to safety after a robust 2013—holding on to gains. Thursday saw mixed results with U.S. indicators as jobless claims slipped but soft numbers were seen in FHFA house prices, existing home sales, and leading indicators. But what really tugged down on equities was news from China. China’s January flash manufacturing PMI slid to a six month low of 49.6 from 50.5 the month before. This offset somewhat net favorable readings coming out of Europe. The data from China continued to push down on stocks globally on Friday. Additionally, investors simply chose to move to safety after a robust 2013—holding on to gains.
By the end of the week, U.S. stocks dropped the most since June, coming in as the worst week for key indexes since 2012.
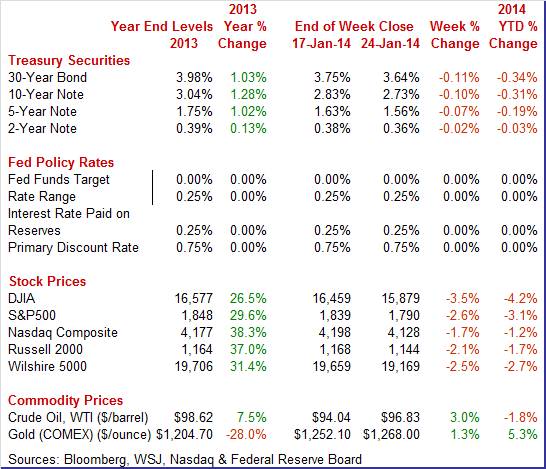
Equities were down this past week. The Dow was down 3.5 percent; the S&P 500, down 2.6 percent; the Nasdaq, down 1.7 percent; the Russell 2000, down 2.1 percent; and the Wilshire 5000, down 2.5 percent.
For the year-to-date, major indexes are down as follows: the Dow, down 4.2 percent; the S&P 500, down 3.1 percent; the Nasdaq, down 1.2 percent; the Russell 2000, down 1.7 percent; and the Wilshire 5000, down 2.7 percent.
Weekly percent change column reflects percent changes for all components except interest rates. Interest rate changes are reflected in simple differences.
 During a relatively slow week, Treasury bond yields fell the most on Thursday on news of contraction in the China manufacturing sector. Weakness continued Friday with flight to safety from equities both days. During a relatively slow week, Treasury bond yields fell the most on Thursday on news of contraction in the China manufacturing sector. Weakness continued Friday with flight to safety from equities both days.
For this past week Treasury rates were down as follows: the 2-year note, down 2 basis points; the 5-year note, down 7 basis points; the 7-year note, down 8 basis points; the 10-year note, down 10 basis points; and the 30-year bond, down 11 basis points. The 3-month T-bill was unchanged.
 With a holiday shortened week, the biggest daily moves in crude were Tuesday and Wednesday. The spot price of West Texas Intermediate rose almost a dollar a barrel Tuesday on trader speculation that government data on inventories would show a drop in distillate fuels on Wednesday. Wednesday numbers showed a drop in distillates. Also, traders saw the East Coast storm as boosting demand, resulting in a jump in crude by about $1-3/4 per barrel for the day. With a holiday shortened week, the biggest daily moves in crude were Tuesday and Wednesday. The spot price of West Texas Intermediate rose almost a dollar a barrel Tuesday on trader speculation that government data on inventories would show a drop in distillate fuels on Wednesday. Wednesday numbers showed a drop in distillates. Also, traders saw the East Coast storm as boosting demand, resulting in a jump in crude by about $1-3/4 per barrel for the day.
Net for the week, the spot price for West Texas Intermediate gained $2.79 per barrel to settle at $96.83.
Based on indicator news from this past week, the fourth quarter likely was strong overall but it may have ended on a soft note.
 The housing sector is not showing much strength lately. Sales of existing homes bounced back in December from a very weak November but not by much, at plus 1.0 percent for a slightly lower-than-expected annual rate of 4.87 million units. The housing sector is not showing much strength lately. Sales of existing homes bounced back in December from a very weak November but not by much, at plus 1.0 percent for a slightly lower-than-expected annual rate of 4.87 million units.
Lack of supply is still an issue—holding back sales. The outlook for future sales is not good, at least based on available supply of homes on the market which fell sharply to 4.6 months from 5.1 months in November.
Rising prices are another negative for the sales outlook, up 1.3 percent for the median to $198,000. This puts the median year-on-year rate at 9.9 percent. Higher home prices are bringing more sellers from being under water and are motivating buyers to not wait.
All cash buyers are king in the home sector, making up a steady 32 percent of existing home sales. In contrast, first-time buyers are on the decline, at 27 percent vs 28 percent in November. Weakness in first-time buyers reflects both rising mortgage rates and the still soft jobs market.
 The housing market may be losing some momentum based on the latest home prices. According to the FHFA, home prices rose a modest 0.1 percent on a seasonally adjust basis, following a 0.5 percent rise the prior month. The November HPI is the 22nd consecutive monthly price increase in the purchase-only, seasonally adjusted index. The housing market may be losing some momentum based on the latest home prices. According to the FHFA, home prices rose a modest 0.1 percent on a seasonally adjust basis, following a 0.5 percent rise the prior month. The November HPI is the 22nd consecutive monthly price increase in the purchase-only, seasonally adjusted index.
Five of nine Census regions showed gains in the latest month while three declined and one was unchanged.
The year-on-year rate for November posted at 7.6 percent, following 8.1 percent in October.
December was a solid month for the manufacturing sector but the early indications were mixed on January including the latest Markit flash PMI at 53.7 and down 1.3 points from final December and down 7 tenths against the December flash which both signal slowing growth in composite activity.
New orders were down 2.0 points against the final December reading to 54.1 which is the slowest pace since October. Export orders, down 2.5 points to 48.9, are below 50 for the first time since September. A reading below 50 indicates outright contraction. Backlog orders also showed contraction, at 49.5 for the first sub-50 reading for this index since August.
Early regional data for January also are mixed.
 Overall activity in the manufacturing sector in the Kansas City Fed District rebounded moderately in January, and factories' production expectations continued to climb higher. Still, the numbers were sluggish and mixed. Overall activity in the manufacturing sector in the Kansas City Fed District rebounded moderately in January, and factories' production expectations continued to climb higher. Still, the numbers were sluggish and mixed.
Many contacts blamed winter weather issues for the slowdown in December, citing lost production days, delays in supply shipments, and lower customer demand. Production also declined slightly in January, for similar reasons, but was expected to rise strongly heading forward.
The month-over-month composite index was 5 in January, up from minus 3 in December and similar to the reading of 6 in November. The composite index is an average of the production, new orders, employment, supplier delivery time, and raw materials inventory indexes. Manufacturing activity increased at both durable and nondurable goods-producing plants, with the exception of food, beverage, and aerospace products. Most other month-over-month indexes also rose in January. The production index edged higher from minus 13 to minus 8, and the shipments, new orders, and order backlog indexes all rebounded from last month.
 The fourth quarter was healthy but the recovery may be losing some momentum in early 2014. The index of leading economic indicators softened a bit in December, up only 0.1 percent, but it followed a very strong and upwardly November at plus 1.0 percent. The fourth quarter was healthy but the recovery may be losing some momentum in early 2014. The index of leading economic indicators softened a bit in December, up only 0.1 percent, but it followed a very strong and upwardly November at plus 1.0 percent.
Positives in December included further strength for credit conditions which points to a long awaited rise in borrowing. The report's yield spread was once again the leading component, in a counter-intuitive signal as the spread increase was due to a rise in long rates instead of a decline in short rates. The spread component was responsible for a 0.31 percentage point contribution.
Manufacturing orders were mostly positive with a gain in the ISM new orders component more than offset by declines in imputed components for capital goods and consumer goods. The stock market is another positive.
On the negative side were unemployment claims which, however, have since been coming down and look to be a positive for the January report. Building permits were a negative as was consumer expectations which, in a negative for the outlook, have been falling further so far this month.
Other readings include a slowing in the coincident index, to plus 0.2 percent from November's 0.4 percent, and a rise in the lagging index to plus 0.3 percent from no change in November.
The latest economic news suggests that housing is leveling off in the near term while manufacturing is mixed but still somewhat positive.
There is a lot on the calendar this week. But the focus will be on Wednesday’s FOMC decision to taper faster or slower. Housing is the next emphasis as this sector has slowed. Recently, home prices have decelerated according to FHFA and we get Case-Shiller’s version this week. Existing home sales were sluggish last week and we get another view with new home sales. Manufacturing has been the recent source of economic momentum and durables orders will be a key update.
New home sales fell 2.1 percent in a deceptive November reading where the 464,000 annual sales rate exceeded what were solid expectations but looked soft against a sharply upward revised October, now at 474,000 versus an initial reading of 444,000. Underscoring the October revision was an even sharper upward revision to September, to 403,000 from 354,000. One factor favoring sellers is supply which was very thin at 4.3 months at the current sales rate versus 4.5 months in October. New homes on the market fell 12,000 in the month to 167,000.
New home sales Consensus Forecast for December 13: 450 thousand-unit annual rate
Range: 420 thousand to 471 thousand-unit annual rate
The Dallas Fed general business activity index for December posted its seventh consecutive positive reading and edged up to 3.1 but fell a little short of expectations for 4.0. The company outlook index also posted its seventh positive reading in a row and shot up 7.5 points to 15.5, its highest level in nearly two years. The production index, a key measure of state manufacturing conditions, fell from 16.9 to 7.1, indicating output grew at a slower pace than in November. Other measures of current manufacturing activity reflected slower or no growth. The new orders index came in near zero, suggesting demand was largely unchanged from November after seven months of increases. The shipments index also fell to around zero, coming in at 0.7, after rising to 14.8 last month. The capacity utilization index declined 8 points to 8.6.
Dallas Fed general business activity index Consensus Forecast for January 14: 5.0
Range: 0.0 to 7.2
Durable goods orders in November rebounded a sharp 3.4 percent, following a 0.7 percent dip in October. The transportation component jumped a monthly 8.3 percent after a drop of 3.5 percent in October. Excluding transportation, durables gained 1.2 percent in November, following a rise of 0.7 percent the month before. Outside of transportation, gains were seen in fabricated metals, machinery, and "other." Decreases were seen primary metals and electrical equipment. Numbers reflect revisions from the more recent total factory orders report.
New orders for durable goods Consensus Forecast for December 14: +1.6 percent
Range: -2.0 percent to +3.5 percent
New orders for durable goods, ex-trans., Consensus Forecast for December 14: +0.7 percent
Range: +0.2 percent to +1.5 percent
The S&P/Case-Shiller 20-city home price index (SA) for October showed a gain of 1.0 percent for the 20-city index. This matched September's gain and compares with gains of 0.9 and 0.6 percent in the two prior months. The year-on-year gain of 13.6 percent was up 3 tenths for the best rate of the recovery. Gains swept all 20 cities for a 3rd month in a row, led in October by Miami at plus 1.9 percent and followed by Atlanta and Detroit, both at 1.8 percent. Year-on-year rates were strongest out West with several above 20 percent.
The S&P/Case-Shiller 20-city HPI (SA, m/m) Consensus Forecast for November 13: +0.8 percent
Range: +0.4 to +1.0 percent
The S&P/Case-Shiller 20-city HPI (NSA, m/m) Consensus Forecast for November 13: +0.2 percent
Range: -0.1 to +0.2 percent
The S&P/Case-Shiller 20-city HPI (NSA, y/y) Consensus Forecast for November 13: +13.7 percent
Range: +12.2 to +14.1 percent
The Conference Board's consumer confidence index rose a strong 6.1 points in December to 78.1. The present situation component rose 2.7 points to 76.2 which was the highest level for this reading of the whole recovery. The expectations component rose more than 8 points but from a very soft November to 79.4 which is still well below a recent peak of 91.1 in June.
Consumer confidence Consensus Forecast for January 14: 79.0
Range: 75.5 to 81.0
The Richmond Fed manufacturing index was unchanged in December at 13 to indicate a very solid monthly growth rate. In the two prior months, the index was dead flat at 1 and zero. Employment growth, in what is a rarity for a manufacturing report, was the standout factor in the month, rising to 14 vs 6 in November. Shipments are also very strong while capacity utilization is up. New orders are coming in this month but at a reading of 10, they show less monthly growth than November's 15. Inventory growth is slowing which reflects rising rates of production while price pressures remain quiet.
Richmond Fed manufacturing index Consensus Forecast for January 14: 10
Range: 7 to 15
The FOMC announcement at 2:00 p.m. ET for the _ FOMC policy meeting is expected to leave policy rates unchanged. The big issues will be whether the Fed will taper asset purchases further and whether there are changes to guidance.
GDP growth for the third quarter was revised up sharply in the Commerce Department’s third estimate for the quarter. But this time demand numbers were bumped up and the inventory number was little revised. Real GDP was revised up to 4.1 percent annualized, compared to the 3.6 percent second estimate and 2.5 percent in the second quarter. The upward revision was largely due to stronger PCEs growth, a boost in the estimate for intellectual property, slightly higher exports, and slightly lower imports. Demand numbers were raised. Final sales of domestic product were revised up to 2.5 percent, compared to the second estimate of 1.9 percent and 2.1 percent in the second quarter. Final sales to domestic purchasers (which exclude net exports) were bumped up to 2.3 percent versus the second estimate of 1.8 percent and 2.1 percent in the second quarter. The GDP price index was unrevised at an annualized pace of 2.0 percent, compared second quarter growth of 0.6 percent.
Real GDP Consensus Forecast for advance estimate Q4 13: +3.0 percent annual rate
Range: +2.2 to +4.2 percent annual rate
GDP price index Consensus Forecast for advance estimate Q4 13: +1.2 percent annual rate
Range: +0.9 to +2.1 percent annual rate
Initial jobless claims posted at lower-than-expected 326,000 in the January 18 week. The 4-week average was down 3,750 to 331,500 which is more than 10,000 lower than the month-ago comparison to offer an indication of strength for the January employment report. But in a partial offset, continuing claims are not coming down. Continuing claims, which are reported with a 1-week lag, rose 34,000 in the January 11 week to 3.056 million for a second straight reading over 3.0 million. Continuing claims had held below 3.0 million through the second half of last year. The 4-week average is up 31,000 in the week to 2.939 million which is the highest reading since August.
Jobless Claims Consensus Forecast for 1/25/14: 327,000
Range: 310,000 to 340,000
The pending home sales index posted a fractional gain of 0.2 percent in November, a weaker-than-expected result but one that nevertheless ended five straight months of declines going all the way back to June. The year-on-year rate, at minus 1.6 percent, is weak but at least steady.
Pending home sales Consensus Forecast for December 13: -0.5 percent
Range: -2.5 to +1.0 percent
Personal income in November rebounded 0.2 percent, following a 0.1 percent dip in October. But the important wages and salaries component improved to a 0.4 percent gain in November after rising 0.1 percent the month before. Tugging down on personal income was the proprietors' income category which fell 1.3 percent after a 1.7 percent boost in October. The swing was in the farm subcomponent. Spending also accelerated a bit, jumping 0.5 percent after a 0.4 percent boost in October. No surprise, the latest gain was led by durables (largely motor vehicles) up 1.9 percent, following a 1.0 percent increase in October. Nondurables declined 0.4 percent after a 0.4 percent decrease in October. Lower gasoline prices likely played a role in November. Services jumped 0.6 in November, following a 0.3 percent rise the prior month. Inflation was non-existent. Headline inflation was unchanged on the month for both November and October. Core inflation rose 0.1 percent in each of the latest two months. On a year-ago basis, overall PCE price inflation posted at 0.9 percent in November, compared to 0.7 percent in October. Core inflation came in at 1.1 percent in both November and October.
Personal income Consensus Forecast for December 13: +0.2 percent
Range: 0.0 to +0.4 percent
Personal consumption expenditures Consensus Forecast for December 13: +0.2 percent
Range: +0.1 to +0.4 percent
PCE price index Consensus Forecast for December 13: +0.2 percent
Range: +0.1 to +0.3 percent
Core PCE price index Consensus Forecast for December 13: +0.1 percent
Range: +0.1 to +0.2 percent
The employment cost index was up 0.4 percent in the third quarter. The year-on-year rate, at plus 1.9 percent, has now been under 2 percent for 8 straight quarters. The wage component was especially soft in the latest report, up only 0.3 percent for the lowest increase since just after the recession, in first quarter 2009. The year-on-year rate, at plus 1.6 percent, was the lowest since fourth-quarter 2011. The benefit component held up the composite in the latest quarter, jumping 0.7 percent for a 2.2 percent year-on-year rate.
Employment cost index Consensus Forecast for Q4 13: +0.4 percent
Range: +0.2 to +0.8 percent
The Chicago PMI in December slowed to 59.1 versus 63.0 and 65.9 in the two prior months. Nonetheless, aside from November and October, the December reading is the best since March last year. Order growth was strong but did slow with new orders at 60.7, down from notably high 68.8 and 74.3 in the two prior months but still above September's 58.9. These are all very strong rates of monthly growth for new orders which have been on the plus 50 side to show growth every month since November last year. And backlog orders are piling up at 58.3 for a 3rd straight monthly build.
Chicago PMI Consensus Forecast for January 14: 59.5
Range: 56.0 to 61.2
The Reuter's/University of Michigan's consumer sentiment index for early January was down 3.4 points to 95.2. The expectations component of the report was also down, 1.2 points lower to 70.9. This reading has been flat for nearly two years, often hovering in the high 60s area and unable approach 80 which is a level consistent with strong economic growth.
Consumer sentiment Consensus Forecast for final January 14: 81.0
Range: 79.4 to 84.0
R. Mark Rogers is the author of The Complete Idiot’s Guide to Economic Indicators, Penguin Books.
He can also be found on a weekly broadcast talking about the U.S. economy, the easiest way to find him is by going to iTunes and searching for "Simply Economics."
Econoday Senior Writer Mark Pender contributed to this article.
|
