|
For a second month in a row, the payroll portion of the jobs report fell significantly below expectations. However, equities ended the week mostly up as many investors believed the jobs report was better than face value.
 Most major indexes ended the week up but with small caps being the exception. Most major indexes ended the week up but with small caps being the exception.
However, the week got off to mostly negative start as a disappointing ISM manufacturing report pushed stocks down sharply. Also, many traders saw declines in shares as a possible correction. The S&P 500 had its worst daily drop since June. Stocks rebounded partially on Tuesday, largely on bargain hunting. Also, factory orders fell less than expected and were somewhat positive after taking out the volatile transportation component (largely aircraft).
 At mid-week, stocks declined after ADP private payroll job growth fell below some analysts expectations, offsetting a mildly favorable ISM non-manufacturing report. Stocks rallied Thursday after a drop in new jobless claims boosted confidence in the economy while earnings results buoyed investors’ morale. Equities gained further on Friday on belief that severe weather was a key reason behind weak job growth in January. At mid-week, stocks declined after ADP private payroll job growth fell below some analysts expectations, offsetting a mildly favorable ISM non-manufacturing report. Stocks rallied Thursday after a drop in new jobless claims boosted confidence in the economy while earnings results buoyed investors’ morale. Equities gained further on Friday on belief that severe weather was a key reason behind weak job growth in January.
Equities mostly were up this past week. The Dow was up 0.6 percent; the S&P 500, up 0.8 percent; the Nasdaq, up 0.5 percent; the Russell 2000, down 1.3 percent; and the Wilshire 5000, up 0.5 percent.
For the year-to-date, major indexes are down as follows: the Dow, down 4.7 percent; the S&P 500, down 2.8 percent; the Nasdaq, down 1.2 percent; the Russell 2000, down 4.0 percent; and the Wilshire 5000, down 2.5 percent.
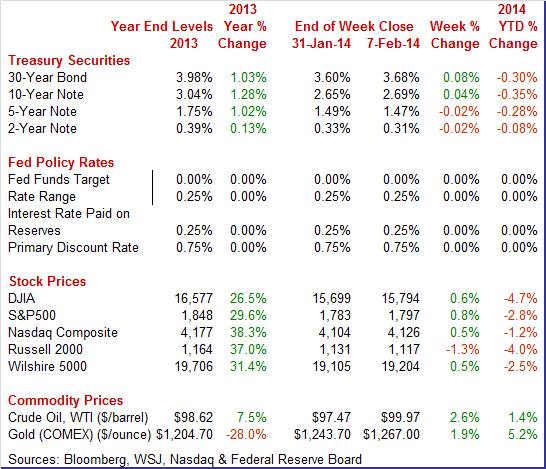
Weekly percent change column reflects percent changes for all components except interest rates. Interest rate changes are reflected in simple differences.
 Treasury yields ended the week mixed. Treasury yields ended the week mixed.
After a quiet Monday, most yields eased slightly with short rates the exceptions. The one-month and three-month bill rates jumped on concern about the Treasury hitting the latest debt ceiling later this month. Money market funds are cutting back on exposure on T-bills.
Rates firmed Wednesday as traders positioned themselves ahead of the Friday report on January jobs. Yields gained further on Thursday after a stronger-than-expected decline in initial jobless claims. Rates fell back Friday after a disappointing jobs report—notably for payroll jobs.
For this past week Treasury rates were mixed as follows: 3-month T-bill, up 7 basis points; the 2-year note, down 2 basis points; the 5-year note, down 2 basis points; the 7-year note, unchanged; the 10-year note, up 4 basis points; and the 30-year bond, up 8 basis points.
 After minor daily volatility the first four trading days of the week, the spot price of West Texas Intermediate jumped at the close of the week. WTI increased just over two dollars per barrel on Friday. The surge was due to tighter North Sea supplies as well as increases in prices for heating oil and gasoline. Prices gained lift from atypically cold weather and also a dip in the unemployment rate. After minor daily volatility the first four trading days of the week, the spot price of West Texas Intermediate jumped at the close of the week. WTI increased just over two dollars per barrel on Friday. The surge was due to tighter North Sea supplies as well as increases in prices for heating oil and gasoline. Prices gained lift from atypically cold weather and also a dip in the unemployment rate.
Net for the week, the spot price for West Texas Intermediate gained $2.50 per barrel to settle at $99.97.
The latest news showed two key sectors struggling in the first quarter—the consumer and manufacturing. There was modestly positive news for housing and non-manufacturing sectors.
 The employment situation disappointed again on the payroll side. Total payroll jobs in January rose 113,000, following a revised increase of 75,000 for December and after a revised rise of 274,000 for November. Expectations were for a 181,000 boost. The net revisions for November and December were up 34,000. Private payrolls advanced 142,000 after rising 89,000 in December. The consensus called for a 182,000 gain in January. The employment situation disappointed again on the payroll side. Total payroll jobs in January rose 113,000, following a revised increase of 75,000 for December and after a revised rise of 274,000 for November. Expectations were for a 181,000 boost. The net revisions for November and December were up 34,000. Private payrolls advanced 142,000 after rising 89,000 in December. The consensus called for a 182,000 gain in January.
The household portion of the employment report was more positive. The unemployment rate slipped to 6.6 percent from 6.7 percent in December. This is the lowest unemployment rate in five years. The labor force actually rebounded a sharp 523,000 in January after dropping 347,000 the month before. Household employment spiked 638,000, following a 143,000 rise in December. The household survey has a much smaller sample size than the payroll survey and is more volatile on a monthly basis.
 Turning back to the payroll portion of the report, goods-producing jobs rebounded 76,000 after dipping 13,000 in December. Construction jobs gained 48,000 in January after decreasing 22,000 the month before. Manufacturing advanced 21,000, following a rise of 8,000 in December. Mining added 7,000 jobs after edging up 1,000 in December. Turning back to the payroll portion of the report, goods-producing jobs rebounded 76,000 after dipping 13,000 in December. Construction jobs gained 48,000 in January after decreasing 22,000 the month before. Manufacturing advanced 21,000, following a rise of 8,000 in December. Mining added 7,000 jobs after edging up 1,000 in December.
Private service-providing jobs increased a slower 66,000 in January, following a 102,000 increase in December. Sporting goods, hobby, book & music stored pared 22,000, following an 8,000 rise in December. Retail trade jobs fell 13,000 after a 63,000 boost in December. On the positive side, professional & business services gained 36,000 after a 4,000 rise in December. Also, leisure & hospitality gained 24,000, following an increase of 20,000 the month before.
Government jobs fell 29,000 in January after declining 14,000 the month before. The latest decline largely reflected cuts at the U.S. Postal Service and in local government education.
Wage growth posted at 0.2 percent, following no change in December. Analysts projected a 0.2 percent gain. The average workweek was unchanged at 34.4 hours, matching expectations.
Looking ahead to the personal income report from the payroll survey, private aggregate weekly earnings rose 0.3 percent in January suggesting a moderate rise in private wages & salaries. Production worker hours in manufacturing were down 0.2 percent for the month, indicating a sluggish manufacturing component for January industrial production.
Overall, the employment report points to a soft first quarter. However, there is some uncertainty over how much weather weighed on job growth.
The Fed will get to see one more employment situation before its March 18-19 FOMC meeting.
 Vehicle sales fell only slightly in January, to a 15.2 million annual rate versus 15.4 million in December—translating into a 1.0 percent dip after a December decline of 6.2 percent. The recent peak in total sales was in November at a 16.4 million unit pace and a 7.7 percent jump. Vehicle sales fell only slightly in January, to a 15.2 million annual rate versus 15.4 million in December—translating into a 1.0 percent dip after a December decline of 6.2 percent. The recent peak in total sales was in November at a 16.4 million unit pace and a 7.7 percent jump.
Weakness in January was centered in imports, especially import cars where the rate fell to 2.2 million from 2.5 million. On the positive side, total sales of North American-made vehicles, boosted by strength in light trucks, rose to 12.1 million from 11.9 million. These results, which point at most to only slight weakness for the motor vehicle component of the January retail sales report, are not that bad given how atypically cold January proved to be, making car shopping more difficult.
 Consumer credit surged $18.8 billion in December and included a very large $5.0 billion rise for revolving credit. The revolving credit component has been mostly flat this recovery but the December gain is the largest since May and the 3rd largest rise of the whole recovery. Consumer credit surged $18.8 billion in December and included a very large $5.0 billion rise for revolving credit. The revolving credit component has been mostly flat this recovery but the December gain is the largest since May and the 3rd largest rise of the whole recovery.
Up $13.8 billion, the non-revolving component continues to be driven by the government's acquisition of student loans. But the gain here also reflects the solid pace of motor vehicle sales.
The gain for revolving credit points to less reluctance among consumers to use their credit cards and hints at strength for holiday retail sales.
Manufacturing is not getting off to a good start in the first quarter. Growth in composite activity slowed a bit in January for Markit's US manufacturing sample where the PMI posted a final January reading of 53.7, unchanged from the flash reading at mid-month and down 1.3 points from final December.
Weakness in order readings was the key negative in the January report. Monthly growth in new orders slowed 2.1 points from final December to 53.9 which, nevertheless, is a respectable rate. The other two order readings in the sample, however, moved below 50 and into contraction in the month with new export orders at 48.4 for a 3.0 point loss and backlog orders down 3.6 points to 49.2.
 Turning to the ISM manufacturing survey, the composite index signaled very significant slowing in composite growth for January, at 51.3 for a sharp 5.2 point decline from December. This is the lowest reading since May 2013 and the sharpest monthly drop since May 2011. Turning to the ISM manufacturing survey, the composite index signaled very significant slowing in composite growth for January, at 51.3 for a sharp 5.2 point decline from December. This is the lowest reading since May 2013 and the sharpest monthly drop since May 2011.
The bad news is centered, unfortunately, in new orders which are down a very steep 13.2 points to 51.2. This is one of the largest monthly declines on record. If there is solace, it's that the plus-50 rate of 51.3 rate still points to monthly growth, just at a much slower pace than December.
The two national manufacturing surveys for January are consistent with the weak production worker hours seen in the employment situation report for the month.
 Polar vortex or not, growth in the bulk of the economy picked back up in January, up 1.0 point to 54.0 for the composite index. The component for business activity rose 2 points to 56.3 which, again, despite the heavy weather, points to monthly acceleration for services output. A down note in the report is only slight monthly growth for new orders which could only inch 1/2 point higher to 50.9. Other order readings are soft as well with backlogs still in contraction but just barely, at 49.0. Polar vortex or not, growth in the bulk of the economy picked back up in January, up 1.0 point to 54.0 for the composite index. The component for business activity rose 2 points to 56.3 which, again, despite the heavy weather, points to monthly acceleration for services output. A down note in the report is only slight monthly growth for new orders which could only inch 1/2 point higher to 50.9. Other order readings are soft as well with backlogs still in contraction but just barely, at 49.0.
A plus in the report is an 8 tenths rise in employment to a very solid 56.4 which is the best reading since November 2010.
The gain in the ISM non-manufacturing index in January was corroborated by the Markit services PMI. January's cold weather didn't slow down the US service sector as business activity accelerated to a very solid 56.7 versus 55.7 in December. Business expectations were especially strong, at 80.8 for a 2.1 point gain and a 3-year high. Another sign of strength comes from price readings which show moderate upward pressure. Other details show less strength including new business, down 1.5 points to 56.4, and outstanding business, down 2.2 points to 49.3. Employment slowed 1.1 points to 54.1.
 Both imports and exports headed in the wrong direction in December, resulting in a wider trade shortfall. But even as the trade deficit in December reversed course, it still was relatively low. The trade gap widened to $38.7 billion from $34.6 billion in November. Exports declined 1.8 percent in December, following a gain of 0.8 percent the month before. Imports edged up 0.3 percent after dropping 1.3 percent. Both imports and exports headed in the wrong direction in December, resulting in a wider trade shortfall. But even as the trade deficit in December reversed course, it still was relatively low. The trade gap widened to $38.7 billion from $34.6 billion in November. Exports declined 1.8 percent in December, following a gain of 0.8 percent the month before. Imports edged up 0.3 percent after dropping 1.3 percent.
The expansion of the trade gap was led by goods excluding petroleum which jumped to $42.0 billion from $37.9 billion in November. The petroleum deficit worsened slightly to $15.6 billion from $15.3 billion in November. The services surplus improved to $19.8 billion from $19.5 billion.
 The rise in imports might be seen as modest positive if businesses are anticipating improvement in demand. Imports were led by consumer goods and by industrial supplies. Weakness was seen in automotive and capital goods excluding autos but both had healthy gains in November. The rise in imports might be seen as modest positive if businesses are anticipating improvement in demand. Imports were led by consumer goods and by industrial supplies. Weakness was seen in automotive and capital goods excluding autos but both had healthy gains in November.
On a year-ago basis, overall exports were up 1.4 percent in December, compared to 5.2 percent in November. Imports were up 1.3 percent versus down 1.0 percent the month before.
 Construction growth eased in December but housing was strong-in contrast to recent sales numbers. Total outlays edged up 0.1 percent after a 0.8 percent boost in November. Construction growth eased in December but housing was strong-in contrast to recent sales numbers. Total outlays edged up 0.1 percent after a 0.8 percent boost in November.
Strength was in private residential outlays which jumped 2.6 percent in December, following a 1.1 percent rise the month before. By subcomponents, new one-family outlays gained 3.4 percent in December, new multifamily rose 0.5 percent, and ex-new homes increased 2.0 percent in December.
Private nonresidential construction spending dipped 0.7 percent but followed a strong 2.4 percent in November. Public outlays fell 2.3 percent after a 1.4 percent decline in November.
Total construction spending was up 5.3 percent on a year-ago basis in December.
Overall, homebuilders are more optimistic than recent sales numbers. This could be a response to lack of supply and concern that mortgage rates are likely to rise later this year as the Fed cuts back on purchases of mortgage-backed securities. If mortgage rates are expected to rise by year end, there could be a boost in housing activity during prime sales season.
Economic growth appears to be slowing in the first quarter—notably for manufacturing. National surveys and regional surveys have been pointing to a slowing in this sector. The burden of maintaining relatively healthy economic growth appears to be falling onto the consumer sector but recent numbers have been mixed—most recently with payroll jobs, the unemployment rate, and consumer credit.
This week’s focus is on the consumer sector and manufacturing. There is a lot of uncertainty about January retail sales due to severe weather, lower unit new motor vehicle sales, and a dip in retail trade employment. Readings on the consumer mood have been mixed and the preliminary consumer sentiment number for February posts. Manufacturing surveys for January have been soft as well as production worker hours. Traders will look for how well the early readings translate into the national number for industrial production.
The NFIB Small Business Optimism Index posted a 1.4 point rise to a higher-than-expected 93.9 in December. An improvement in earnings trends also lifted December's index with capital outlay plans and expansion plans both rising further. Negatives included a small downtick in hiring plans.
NFIB Small Business Optimism Index Consensus Forecast for January 14: 93.4
Range: 92.5 to 94.5
The Labor Department’s Job Openings and Labor Turnover Survey showed 4.001 million job openings on the last business day of November, up slightly from 3.931 million in October. The November figure was the first to top 4 million since March 2008. The hires rate (3.3 percent) and separations rate (3.1 percent) were unchanged in November. There were 4.494 million hires in November, compared to 4.484 million in October. The number of hires was essentially unchanged for total private and government. The number of hires was also essentially unchanged in all industries and in all four regions. There were 4.258 million total separations in November versus 4.205 million in October. The number of total separations was essentially unchanged for total private and government.
No consensus numbers are available for this month’s report
Wholesale inventories in November rose 0.5 percent but was more than offset by a 1.0 percent rise in sales. The stock-to-sales ratio fell to 1.17 from 1.18 the prior 3 months.
But there were signs of trouble in the data as sales of durable goods, pulled down by sizable declines in metals, lumber, electrical goods, and machinery, contracted 0.4 percent at the same time that inventories of durables rose 0.5 percent, driving up the durables stock-to-sales ratio to 1.57 from 1.56 and 1.55 in the 2 prior months. The improvement in the latest report was on the non-durables side where sales, boosted by petroleum and apparel, jumped 2.1 percent while inventories, held down by a large draw in petroleum, rose only 0.5 percent, pulling down the stock-to-sales ratio to 0.84 from 0.85 in the prior 2 months.
Wholesale inventories Consensus Forecast for December 13: +0.6 percent
Range: +0.2 to +1.0 percent
The U.S. Treasury monthly budget report showed a surplus—not deficit—in the month of December of $53.2 billion. Three months into the government's fiscal year, the deficit was down 41 percent from this time last year. Receipts, boosted by a stronger economy and higher tax rates, are up a year-on-year 8.0 percent so far this fiscal year with outlays, which include big declines for net interest and defense spending, down 7.8 percent. A lower deficit is of course a positive for the government's credit standing, though it reduces stimulus for the economy. Looking ahead, the month of January typically shows a moderate deficit for the month. Over the past 10 years, the average deficit for the month of January has been $9.7 billion and $36.1 billion over the past 5 years. The January 2013 figure was a surplus at $2.9 billion.
No consensus numbers are available for this month’s report
Retail sales in December suggested a moderately healthy consumer sector—somewhat in contrast to the December employment report. Overall retail sales in December rose 0.2 percent, following a gain of 0.4 percent the month before. As expected, autos tugged down sharply on sales. Motor vehicle & parts dropped 1.8 percent after a 1.9 percent increase in November. Excluding autos, sales posted a 0.7 percent boost after a November rise of 0.1 percent. Gas station sales rebounded 1.6 percent, following a 1.5 percent decline the month before. Excluding both autos and gasoline, sales advanced a healthy 0.6 percent in December, following a 0.3 percent gain in November. In the core, strength was seen in food & beverage stores, health & personal care, clothing, nonstore retailers, and food services & drinking places. January’s dip in unit new auto sales may tug down on overall retail sales.
Retail sales Consensus Forecast for January 14: -0.1 percent
Range: -0.3 to +0.3 percent
Retail sales excluding motor vehicles Consensus Forecast for January 14: +0.1 percent
Range: -0.2 to +0.4 percent
Less motor vehicles & gasoline Consensus Forecast for January 14: +0.2 percent
Range: 0.0 to +0.3 percent
Initial jobless claims for the February 1 week fell a sharp 20,000 to a lower-than-expected 331,000. The 4-week average, at 334,000, trended 15,000 below the month-ago comparison.
Continuing claims, however, did not show improvement. Continuing claims for the January 25 week rose 15,000 to 2.964 million with the 4-week average up 26,000 to a 2.986 million level that was more than 100,000 above the month-ago trend.
Jobless Claims Consensus Forecast for 2/8/14: 330,000
Range: 325,000 to 336,000
Business inventories in November were up 0.4 percent versus a strong 0.8 percent rise in business sales, the strongest sales gain since May, that left the stock-to-sales ratio unchanged at 1.29. Retail inventories, the second largest component of the report and the fresh data in the latest report, likewise showed no change with the stock-to-sales ratio steady at 1.43.
Business inventories Consensus Forecast for December 13: +0.5 percent
Range: +0.1 to +0.8 percent
Import prices showed no change in December following a downwardly revised 0.9 percent drop in November and a 0.6 percent decline in October. Removing swings tied to oil, the ex-petroleum reading also showed no change in December. Oil-related prices, after steep declines in the two prior months, held steady with imported prices for petroleum products down 0.1 percent in December. Crude prices fell 1.2 percent. In an offset, prices for coal and gas rose sharply in the month though year-on-year rates remain in the negative column. Finished prices continue to be flat with capital goods, motor vehicles, and consumer goods all showing incremental monthly declines with year-on-year rates all in the negative column. Total export prices rose 0.4 percent in the month for a gain tied to a 0.4 percent rise for agricultural prices. Still, the year-on-year price decline for agricultural prices is a very sizable 6.3 percent.
Import prices Consensus Forecast for January 14: -0.1 percent
Range: -0.2 to +0.3 percent
Export prices Consensus Forecast for January 14: +0.1 percent
Range: -0.1 to +0.3 percent
Industrial production increased 0.3 percent in December after a gain of 1.0 percent in November. The December figure matched expectations for a 0.3 percent rise. Turning to major components, manufacturing posted a 0.4 percent increase, following a jump of 0.6 percent the month before. The December gain in manufacturing was its fifth consecutive increase. Motor vehicles advanced 1.6 percent in December after jumping 3.6 percent in November. Still, manufacturing was healthy outside of this sector. Excluding motor vehicles, manufacturing posted a 0.4 percent boost, following an increase of 0.4 in November. The output of utilities declined 1.4 percent, following a 3.0 percent spike in November. Mining activity expanded 0.8 percent after a 1.9 percent boost in November. Capacity utilization for total industry improved to 79.2 percent from 79.1 percent in November. More recently, production worker hours in manufacturing were down 0.2 percent for the month, indicating a sluggish manufacturing component for January industrial production. But utilities could put the overall number in positive territory.
Industrial production Consensus Forecast for January 14: +0.3 percent
Range: 0.0 to +0.6 percent
Manufacturing production component Consensus Forecast for January 14: +0.1 percent
Range: -0.2 to +0.3 percent
Capacity utilization Consensus Forecast for January 14: 79.3 percent
Range: 79.1 to 79.6 percent
The Reuters/University of Michigan's consumer sentiment index improved the last two weeks of January, to a final January reading of 81.2 versus 80.4 at mid-month, but ended up a little bit short of December's final reading of 82.5. The current conditions component, which offers an indication on month-to-month activity, ended January at 96.8 which, again, came up a bit short versus December's 98.6. The same was true of the expectations component, ending January at 71.2, compared to December's 72.1.
Consumer sentiment index Consensus Forecast for preliminary February 14: 80.0
Range: 76.5 to 82.6
R. Mark Rogers is the author of The Complete Idiot’s Guide to Economic Indicators, Penguin Books.
He can also be found on a weekly broadcast talking about the U.S. economy, the easiest way to find him is by going to iTunes and searching for "Simply Economics."
Econoday Senior Writer Mark Pender contributed to this article.
|
