|
Atypically cold winter weather continued to weigh on the latest economic news. But there remains the question of whether the economy has softened outside of weather effects.
 Equities ended the week mixed after some notable daily swings. On opening Tuesday, most indexes were up. Stocks generally rose on favorable earnings despite disappointing reports on Empire State manufacturing and NAHB housing market index. The Dow was nudged down by a decline in Coca-Cola. Wednesday saw widespread declines after Fed FOMC minutes indicated almost certain tapering this year in bond purchases. Housing starts dropped but much was attributed to weather. Equities ended the week mixed after some notable daily swings. On opening Tuesday, most indexes were up. Stocks generally rose on favorable earnings despite disappointing reports on Empire State manufacturing and NAHB housing market index. The Dow was nudged down by a decline in Coca-Cola. Wednesday saw widespread declines after Fed FOMC minutes indicated almost certain tapering this year in bond purchases. Housing starts dropped but much was attributed to weather.
 Stocks gained Thursday on mixed but more positive economic news. Initial jobless claims dipped and leading indicators were up. But the Philadelphia Fed manufacturing index slowed. Adding lift to broad markets also was the announcement by Facebook of a purchase of a messaging startup. This boosted belief of more M&A activity ahead. Equities were little changed at the close of the week. Stocks gained Thursday on mixed but more positive economic news. Initial jobless claims dipped and leading indicators were up. But the Philadelphia Fed manufacturing index slowed. Adding lift to broad markets also was the announcement by Facebook of a purchase of a messaging startup. This boosted belief of more M&A activity ahead. Equities were little changed at the close of the week.
Equities were mixed this past week. The Dow was down 0.3 percent; the S&P 500, down 0.1 percent; the Nasdaq, up 0.5 percent; the Russell 2000, up 1.3 percent; and the Wilshire 5000, up 0.1 percent.
For the year-to-date, major indexes are mixed as follows: the Dow, down 2.9 percent; the S&P 500, down 0.7 percent; the Nasdaq, up 2.1 percent; the Russell 2000, up 01 percent; and the Wilshire 5000, down 0.1 percent.
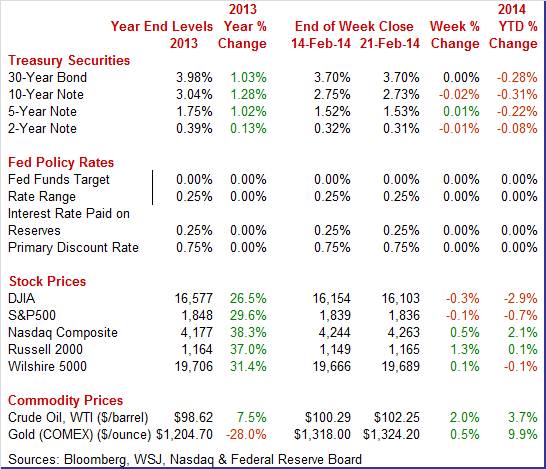
Weekly percent change column reflects percent changes for all components except interest rates. Interest rate changes are reflected in simple differences.
 Treasury yields were essentially flat this past week with daily movement modest at the most. Treasury yields were essentially flat this past week with daily movement modest at the most.
Rates dipped Tuesday as bond traders were a little more skeptical about weather being the sole reason for weak economic data. The sharp drop in the housing market index stood out along with a slowing in the Empire State manufacturing index.
Rates firmed Wednesday after Fed FOMC minutes confirmed that tapering of asset purchases are highly likely to continue the rest of this year, resulting in higher rates on the long end of the yield curve. Yields were mixed Thursday with long rates nudging up on continued focus on Fed minutes and scheduled tapering. Rates were little changed Friday.
For this past week Treasury rates were mixed and little changed as follows: 3-month T-bill, up 2 basis points; the 2-year note, down 1 basis point; the 5-year note, up 1 basis point; the 7-year note, up 1 basis point; the 10-year note, down 2 basis points; and the 30-year bond, unchanged.
 Crude oil prices rose moderately for the week with some softening late in the week. The spot price of West Texas Intermediate jumped $2-1/2 per barrel on Tuesday to well over $102 per barrel. This was due to speculation that cold weather reduced inventories in Cushing. Prices nudged up Wednesday about three-fourths dollars on continued belief of tighter supply. Crude oil prices rose moderately for the week with some softening late in the week. The spot price of West Texas Intermediate jumped $2-1/2 per barrel on Tuesday to well over $102 per barrel. This was due to speculation that cold weather reduced inventories in Cushing. Prices nudged up Wednesday about three-fourths dollars on continued belief of tighter supply.
But on the holiday delayed government report on Thursday that inventories rose slightly, the price of WTI dipped a bit. Prices were little changed Friday.
Net for the week, the spot price for West Texas Intermediate gained $1.96 per barrel to settle at $102.25.
Atypically adverse winter weather continues to weigh on the latest economic data.
 The extreme cold of January took a heavy toll on the housing sector including housing starts which plunged 16.0 percent to a 880,000 annual unit rate. Starts of single-family homes fell 15.9 percent to 573,000 with condos similarly in line, down 16.3 percent to 307,000. Starts in the South, which is by far the largest region for this report, fell 12.5 percent with the West, the second largest region, showing a 17.4 percent decline. The extreme cold of January took a heavy toll on the housing sector including housing starts which plunged 16.0 percent to a 880,000 annual unit rate. Starts of single-family homes fell 15.9 percent to 573,000 with condos similarly in line, down 16.3 percent to 307,000. Starts in the South, which is by far the largest region for this report, fell 12.5 percent with the West, the second largest region, showing a 17.4 percent decline.
Permits, which are less affected by weather, showed a smaller decline and probably more closely reflect the underlying trend for the new home market. Permits fell 5.4 percent to a 937,000 unit rate with single-family homes showing relative strength, down only 1.3 percent. Regionally, the South showed a 3.4 percent gain while the West showed a big decline, down 26.0 percent.
Heavy weather so far this month looks to pull down activity for February as well, which points to the spring as the season for a housing snap back. There is a high probability that housing shows a rebound in the spring simply from coming off very low winter numbers.
 Existing home sales fell in January and it was not just to bad weather. Rising mortgage rates, limited supply, and higher prices also cut into sales. Existing home sales fell 5.1 percent in January to a 4.620 million annual rate. The year-on-year rate is also at minus 5.1 percent, a sharp contrast to the year-on-year median price which is up 10.7 percent. Existing home sales fell in January and it was not just to bad weather. Rising mortgage rates, limited supply, and higher prices also cut into sales. Existing home sales fell 5.1 percent in January to a 4.620 million annual rate. The year-on-year rate is also at minus 5.1 percent, a sharp contrast to the year-on-year median price which is up 10.7 percent.
Supply of homes relative to sales did rise to 4.9 months from 4.6 months but the improvement was tied mostly to the drop in sales. Prices did come down in the month but from already high levels with the median price down 4.5 percent to $188,900.
Weather was especially cold in January and no doubt contributed to the sales weakness, especially in the Midwest, where sales fell 7.1 percent in the month, and also the Northeast where the decline was 3.1 percent. Weather was not an issue in the West, but sales in this region fell 7.3 percent which the National Association of Realtors pointed to as evidence of non-weather constraints.
Markit Economics' US manufacturing sample reported a very strong bounce back in composite growth in early February, at a flash reading of 56.7 versus 53.7 for both the final and flash readings for January. The latest reading is the highest in almost four years, since May 2010.
Order readings in this report were depressed in January but not in the flash report for February with new orders showing a stand-out gain of 3.9 points from final January to a 58.8 reading that points to substantial growth from February. New export orders, at 50.9, show much less growth but compare favorably with January's contractionary reading of 48.4. Backlog orders are a big plus, jumping 7.2 points to 56.4.
The healthy PMI for flash February is in contrast to early regional surveys.
 Early regional readings for manufacturing showed softness in New York and Philly Fed Districts. Early regional readings for manufacturing showed softness in New York and Philly Fed Districts.
General conditions in the New York manufacturing region improved only slightly in February while new orders fell back into contraction. The general conditions index for February came in at a lower-than-expected 4.48 vs 12.51 in January to indicate a slowing rate of monthly growth. The new orders index fell to minus 0.21 from January's unusually strong 10.98 for the third negative reading in the last four months. Lack of new orders points to longer term weakness for shipments and employment.
Shipments, perhaps slowed by heavy weather, were still positive but just barely, at 2.13 which were well down from 15.52 in January.
 The Philly Fed's headline index for general conditions fell back into the negative column, to minus 6.3 in February, compared to January's 9.4. This was the first negative reading since May. The Philly Fed's headline index for general conditions fell back into the negative column, to minus 6.3 in February, compared to January's 9.4. This was the first negative reading since May.
Last month's big 7.8 point decline in the new order index signaled the trouble for today's report. And new orders are even worse for February, in negative ground at minus 5.2 for a major 10.3 point decline. Unfilled orders are also in negative ground, at minus 2.6 for a 1.6 point decline from January.
Shipments, suffering from a lack of orders and also from weather effects, fell dramatically, down 22 points to minus 9.9. The weather effect is evident in delivery times, which slowed 5.7 points to 2.9.
The bottom line is that atypically adverse weather is making it difficult to read true health in the manufacturing sector—just as in other sectors.
 Consumer price inflation slowed in January at the headline level and core inflation remained soft. Headline CPI inflation in January eased to a monthly 0.1 rise after gaining 0.2 percent in December (new seasonal factors). The CPI excluding food and energy inflation rate held steady at 0.1 percent, matching the December pace. Consumer price inflation slowed in January at the headline level and core inflation remained soft. Headline CPI inflation in January eased to a monthly 0.1 rise after gaining 0.2 percent in December (new seasonal factors). The CPI excluding food and energy inflation rate held steady at 0.1 percent, matching the December pace.
The energy component increased 0.6 percent, following a 1.6 percent boost in December. However, gasoline declined 1.0 percent after jumping 2.6 percent in December. Food price inflation nudged up marginally to 0.1 percent from flat the month before.
 Within the core, upward pressure was mainly from housing, up 0.4 percent. But softness was seen in apparel, down 0.3 percent. New vehicles dipped 0.3 percent and used cars fell 0.5 percent. Within the core, upward pressure was mainly from housing, up 0.4 percent. But softness was seen in apparel, down 0.3 percent. New vehicles dipped 0.3 percent and used cars fell 0.5 percent.
Year-on-year, overall CPI inflation came in at 1.6 percent in January, compared to 1.5 percent in December (seasonally adjusted). The core rate posted at 1.6 percent year-on-year, slightly down from 1.7 percent in December. For January, not seasonally adjusted year-ago percent changes for total and core CPI were 1.6 percent and 1.6 percent, respectively.
Inflation continues to be subdued and almost certainly will be a debating point within the Fed on how fast to taper quantitative easing.
 With the PPI report for January, there was a completely revamped producer prices report which now includes services and construction. The focus is on final demand for headline, followed by intermediate demand. This is first major overhaul of the PPI since 1978 and doubles its coverage of the economy. With the PPI report for January, there was a completely revamped producer prices report which now includes services and construction. The focus is on final demand for headline, followed by intermediate demand. This is first major overhaul of the PPI since 1978 and doubles its coverage of the economy.
The PPI for total final demand rose 0.2 percent in January after a gain of 0.1 percent in December. What the "core" series is remains open to debate. Total final demand excluding food & energy increased 0.2 percent after no change in December. Total final demand excluding food, energy, and trade services edged up 0.1 percent in January, following a boost of 0.3 percent in December.
For the overall PPI, the year-ago rate posted at 1.2 percent versus 1.1 percent in December (seasonally adjusted). On a not seasonally adjust basis, PPI final demand was up 1.2 percent in January; excluding food & energy, up 1.3 percent. Excluding food, energy & trade services is not yet available on a year-ago basis since the series starts for August 2013.
Going into monthly component detail, upward pressure primarily came from foods which jumped 1.0 percent after declining 0.4 percent in December. Energy rose 0.3 percent, following a 1.5 percent jump the month before. Services rebounded 0.1 percent, following a 0.1 percent dip in December. Construction jumped 0.6 percent in January after no change in December. Overall, inflation is subdued at the producer level, leaving the Fed in no rush to accelerate its taper schedule.
 While the first quarter is sluggish, there may be improvement ahead. Despite temporary weather effects that held down the factory sector, the index of leading economic indicators rose a respectable 0.3 percent in January. A decline in the factory workweek was a major negative for January as was the drop in the ISM index for new manufacturing orders. These readings may reverse, if not in February than during the spring. While the first quarter is sluggish, there may be improvement ahead. Despite temporary weather effects that held down the factory sector, the index of leading economic indicators rose a respectable 0.3 percent in January. A decline in the factory workweek was a major negative for January as was the drop in the ISM index for new manufacturing orders. These readings may reverse, if not in February than during the spring.
Positives in the report were once again led by financial measures, including the yield spread and the report's leading credit index where gains have been pointing to a rise in lending. A drop in unemployment claims was another major positive though claims have since moved sideways.
But there is another negative that likely cannot be explained away as a weather effect. A big drop in building permits was January's largest negative.
Other readings in today's report include a second straight 0.1 percent rise in the coincident index, which points to very limited ongoing growth, and a 0.3 percent gain for the lagging index which confirms respectable growth in prior periods.
Based on FOMC minutes and FedSpeak, quantitative easing will come to a stop by the fourth quarter of this year unless economic data exceptionally suggest otherwise.
The latest FOMC minutes indicated notable debate about tapering. Several members favored continuing a scheduled tapering of $10 billion per FOMC meeting. In contrast, two participants favored a pause in tapering due to slack in the economy and low inflation. The FOMC noted that emerging markets should be watched along with Puerto Rico. But emerging markets were seen as having only a limited effect. A number of participants noted that recent economic news had reinforced their confidence in their projection of moderate economic growth over the medium run. Overall, most participants still viewed the risks to the outlook for the economy and the labor market as having become more nearly balanced in recent months.
A key debate was what is appropriate for forward guidance on the fed funds target rate. A few participants raised the possibility that it might be appropriate to increase the federal funds rate relatively soon. But currently, expectations are that the fed funds rate will not be raised until after quantitative easing ends—likely meaning rates do not begin to go up until 2015.
Importantly, the FOMC approved continuing reverse repo operations for the purpose of further assessing the potential role for such operations in supporting the implementation of monetary policy. Use of reverse repos likely will be important when the Fed begins raising policy rates. Interest on reverse repos can be paid to government agencies and others that do not qualify for interest paid on excess reserves.
Both housing and manufacturing have been weighed down by adverse weather. Meanwhile, the Fed is looking beyond current data and maintaining current monetary policy. The economy appears to be on a soft trajectory although weather makes interpreting the latest numbers difficult.
Housing and manufacturing remain in the spotlight. Adverse weather bumped down existing home sales in January. The question this week is if weather impacted new home sales and pending existing home sales. Manufacturing output also fell in January due in part to weather. But new orders are not affected by weather and reflect underlying demand. New orders for durables likely will give a clearer picture of the health of the manufacturing sector.
The Chicago Fed National Activity Index for December fell to 0.16 from a revised 0.69. The 3-month average was also down but to a lesser degree, at plus 0.33 vs a revised 0.36 in November. December's slowing reflected smaller positive contributions from employment and production. The negative drag from housing, reflecting a dip in starts and permits, increased in the month. The contribution from sales/orders/inventories was steady and moderate.
Chicago Fed National Activity Index Consensus Forecast for January 13: -0.2
Range: -0.3 to 0.3
The Markit PMI services index (final) for January accelerated to a very solid 56.7 versus 55.7 in December. Business expectations were especially strong, at 80.8 for a 2.1 point gain and a 3-year high. Another sign of strength comes from price readings which showed moderate upward pressure. Other details showed less strength including new business, down 1.5 points to 56.4, and outstanding business, down 2.2 points to 49.3. Employment slowed 1.1 points to 54.1.
No consensus numbers are available for this month’s report
The Dallas Fed general business activity index in its Texas manufacturing survey was nearly unchanged at a reading of 3.8 for January. Similarly, the company outlook index posted its eighth positive reading in a row and held steady at 15.9. The production index, a key measure of state manufacturing conditions, edged up from 6 to 7.1, indicating output grew at a slightly stronger pace than in December. Other measures of current manufacturing activity also reflected a pickup in growth. The new orders index surged from 1.3 in December to 14.4 in January, reaching a seven-month high and suggesting a sharp rise in demand. The shipments index also rebounded strongly, rising from near zero to 9.2. Growth in capacity utilization held steady, with the index remaining at 8.2.
Dallas Fed general business activity index Consensus Forecast for February 14: 2.5
Range: -2.0 to 5.0
The FHFA purchase only house price index for November rose a modest 0.1 percent on a seasonally adjust basis, following a 0.5 percent rise the prior month. The November HPI is the 22nd consecutive monthly price increase in the purchase-only, seasonally adjusted index. Five of nine Census regions showed gains in the latest month while three declined and one was unchanged.
FHFA purchase only house price index Consensus Forecast for December 13: +0.3 percent
Range: +0.1 to +0.4 percent
The S&P/Case-Shiller 20-city home price index (SA) eased in November but only slightly as the month-to-month composite-20 index came in at an adjusted plus 0.9 percent versus a revised plus 1.1 percent in October. The adjusted year-on-year reading rose 2 tenths to a very strong plus 13.8 percent but here also, in what hints at slowing momentum, the gain is a bit smaller than the 3 tenths gain in October and the 5 tenths gain in September. But price gains were still very convincing with gains sweeping all 20 cities for a 4th month in a row. In a special plus, strong gains are being posted outside the West. Price momentum is especially prominent in Atlanta, Detroit, and Cleveland.
The S&P/Case-Shiller 20-city HPI (SA, m/m) Consensus Forecast for December 13: +0.6 percent
Range: +0.5 to +0.8 percent
The S&P/Case-Shiller 20-city HPI (NSA, m/m) Consensus Forecast for December 13: -0.1 percent
Range: -0.1 to +0.1 percent
The S&P/Case-Shiller 20-city HPI (NSA, y/y) Consensus Forecast for December 13: +13.3 percent
Range: +13.1 to +13.6 percent
The Conference Board's consumer confidence index for January rose 3.2 points to a higher-than-expected 80.7, picking up on top of a very solid gain in December when the index rose 5.5 points to a revised 77.5. A very special positive was special strength in the present situation component which was up 3.8 points to 79.1 for the highest reading of the recovery and which hints at month-to-month gains for consumer spending. The expectations component, which has been lagging in momentum was up 1.8 points to an 81.8 level that is still well below the high 80s and low 90 readings in the summer.
Consumer confidence Consensus Forecast for February 14: 80.1
Range: 78.0 to 82.0
The Richmond Fed manufacturing index for January posted at a very respectable 12 versus 13 in both December and November. New orders, the most important detail in the report, were up 4 points to 14. Shipments were sold while capacity utilization and the workweek are on the rise.
Richmond Fed manufacturing index Consensus Forecast for February 14: 3
Range: 0 to 15
New home sales plunged in December to a 414,000 annual rate. The latest month dropped 7.0 percent, following a decrease of 3.9 percent in November. The drop in sales gave a lift to supply, at least supply relative to sales which is at 5.0 months versus 4.7 months in November. But the total number of new homes on the market actually fell, down 5,000 to an adjusted 171,000.
New home sales Consensus Forecast for January 14: 400 thousand-unit annual rate
Range: 380 thousand to 426 thousand-unit annual rate
Durable goods orders unexpectedly stumbled in December. New factory orders for durables in December dropped a monthly 4.2 percent, following a revised gain of 2.7 percent in November. The transportation component sank a monthly 9.7 percent after surging 8.1 percent in November. Excluding transportation, durables declined 1.3 percent in December after edging up 0.2 percent the month before. Outside of transportation, declines were seen in primary metals, fabricated metals, computers & electronics, and "other." Gains were seen in machinery and electrical equipment. Numbers reflect revisions from the more recent total factory orders report.
New orders for durable goods Consensus Forecast for January 14: -1.6 percent
Range: -4.8 percent to +2.0 percent
New orders for durable goods, ex-trans., Consensus Forecast for January 14: -0.4 percent
Range: -1.5 percent to +0.5 percent
Initial jobless claims for the February 15 week, which is also the sample week for the monthly employment report, edged 3,000 lower to 336,000. The 4-week average rose slightly to a 338,500 level that, in a slight negative, is 6,250 higher than the January 18 week which was the sample week for the January employment report. Continuing claims, which are reported with a one week lag, rose 37,000 to 2.981 million. The 4-week average, at 2.960 million, was right in line with the month-ago trend, which again points to little change in the jobs market.
Jobless Claims Consensus Forecast for 2/22/14: 335,000
Range: 330,000 to 345,000
The Kansas City Fed manufacturing index rebounded moderately in January, and factories' production expectations continued to climb higher. Still, the numbers were sluggish and mixed. The month-over-month composite index was 5 in January, up from minus 3 in December and similar to the reading of 6 in November. The composite index is an average of the production, new orders, employment, supplier delivery time, and raw materials inventory indexes. Manufacturing activity increased at both durable and nondurable goods-producing plants, with the exception of food, beverage, and aerospace products. Most other month-over-month indexes also rose in January. The production index edged higher from minus 13 to minus 8, and the shipments, new orders, and order backlog indexes all rebounded from last month.
Kansas City Fed manufacturing index Consensus Forecast for February 14: 2
Range: 0 to 7
GDP for the fourth quarter rose an annualized 3.2 percent in the advance estimate. This followed a 4.1 percent boost in the third quarter. But demand was not as strong. Final sales of domestic demand gained 2.8 percent after a 2.5 percent boost in the third quarter. Final sales to domestic purchasers slowed to 1.4 percent in the fourth quarter after a 2.3 percent increase the prior quarter. The softening was largely due to a drop in government purchases. So, in the private sector, demand is moderately healthy. Weakness in government spending partly reflected the partial shutdown in the federal government. Inflation is soft with the GDP price index rising only 1.3 percent after a 2.0 percent increase in the third quarter. The core price index eased to 1.7 percent, following a 1.9 rise in the third quarter.
Real GDP Consensus Forecast for second estimate Q4 13: +2.5 percent annual rate
Range: +2.2 to +2.8 percent annual rate
GDP price index Consensus Forecast for second estimate Q4 13: +1.3 percent annual rate
Range: +1.2 to +1.4 percent annual rate
The Chicago PMI in January posted well above 50 at 59.6. Details of the report, where preferred subscribers are given special access, were sketchy with new orders described as rising only slightly. Employment contracted in the month, but only slightly, while inventories rose in what the report describes as an intentional build. Price pressures for raw materials are up in what is an indication of solid demand.
Chicago PMI Consensus Forecast for February 14: 56.4
Range: 53.0 to 59.8
The Reuter's/University of Michigan's consumer sentiment index remained steady in early February as a weather-related dip in current conditions was offset by a rise in expectations. The composite index was at a higher-than-expected 81.2 for the mid-February reading, unchanged from final January and up 8 tenths from mid-January. The present situation component, which is an important component that offers an early reading on how February is shaping up vs January, slipped 2.8 points from final January to 94.0. The expectations component was up 1.8 points from final January to 73.0 which is the highest reading since August.
Consumer sentiment Consensus Forecast for final February14: 81.5
Range: 80.5 to 84.0
The pending home sales index fell a sharp 8.7 percent in December. This plunge points to a sharp decline ahead for what was already a very soft existing home sales market. All regions showed similar declines in today's report.
Pending home sales Consensus Forecast for January 14: +2.3 percent
Range: -4.0 to +5.0 percent
R. Mark Rogers is the author of The Complete Idiot’s Guide to Economic Indicators, Penguin Books.
He can also be found on a weekly broadcast talking about the U.S. economy, the easiest way to find him is by going to iTunes and searching for "Simply Economics."
Econoday Senior Writer Mark Pender contributed to this article.
|
