|
Regardless of where political intentions are headed, financial markets eased on worrying about potential intervention by Russia in Ukraine. But this may be only temporary. Separately, U.S. payroll employment for February topped expectations.
 It is still uncertain of Russia’s intentions in Ukraine—Crimea in particular—and the West’s response. But by week’s end, markets determined that discussion is the main weapon for now instead of armed intervention and stocks rebounded. It is still uncertain of Russia’s intentions in Ukraine—Crimea in particular—and the West’s response. But by week’s end, markets determined that discussion is the main weapon for now instead of armed intervention and stocks rebounded.
At the first of the week, stocks dropped moderately on worries about possible Russian intervention in Ukraine. Stocks retreated Monday along with other risk assets globally as Ukraine and Russia prepared for possible war after Russian President Vladimir Putin declared he had the right to invade his neighbor to protect Russian interests. Equities rebounded Tuesday on little economic news and on comments by Russian President Vladimir Putin that Russia does not plan to take over Crimea—although he still stated that Russia has the right to protect Russian speaking people in Ukraine.
 Equities were little changed at mid-week as investors seemed reluctant to make any significant moves after the markets saw big swings in response to the recent developments in Ukraine. Uncertainty about the near-term outlook for the markets ahead of Friday's monthly jobs report kept traders on the sidelines. Also, ADP private payrolls disappointed somewhat while the Beige Book offered no surprises (weather impacted modest growth), leaving the Fed on track for scheduled taper. Equities were little changed at mid-week as investors seemed reluctant to make any significant moves after the markets saw big swings in response to the recent developments in Ukraine. Uncertainty about the near-term outlook for the markets ahead of Friday's monthly jobs report kept traders on the sidelines. Also, ADP private payrolls disappointed somewhat while the Beige Book offered no surprises (weather impacted modest growth), leaving the Fed on track for scheduled taper.
Stocks were mainly up Thursday largely on lower-than-than-expected initial jobless claims. First-time jobless claims fell to the lowest level in three months. On Friday, equities were mixed but large caps gained after payroll jobs topped expectations.
The Ukraine situation is continually evolving. As of this past Friday, tensions had eased. However, over the weekend tensions had increased. Markets may be negative Monday on weekend developments.
Equities were up this past week. The Dow was up 0.8 percent; the S&P 500, up 1.0 percent; the Nasdaq, up 0.7 percent; the Russell 2000, up 1.7 percent; and the Wilshire 5000, up 1.0 percent.
For the year-to-date, major indexes were mostly up as follows: the S&P 500, up 1.6 percent; the Nasdaq, up 3.8 percent; the Russell 2000, up 3.4 percent; and the Wilshire 5000, up 1.3 percent. The Dow was down 0.7 percent since the end of 2013.
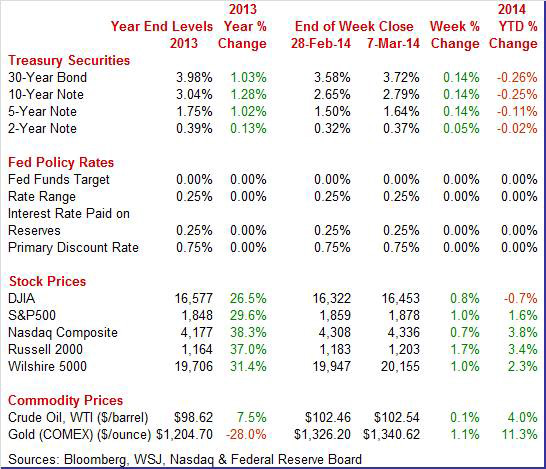
Weekly percent change column reflects percent changes for all components except interest rates. Interest rate changes are reflected in simple differences.
 Treasury yields rose this past week on reversal of flight to safety and better economic data. Rates eased Monday on flight to safety on concern about Ukraine. Rates more than reversed Tuesday as traders saw the situation in Ukraine as calming. Treasury yields rose this past week on reversal of flight to safety and better economic data. Rates eased Monday on flight to safety on concern about Ukraine. Rates more than reversed Tuesday as traders saw the situation in Ukraine as calming.
After a flat Wednesday, yields firmed slightly Thursday on lower jobless claims. Rates firmed further Friday after payroll employment topped expectations.
 For this past week Treasury rates were up as follows: the 2-year note, up 5 basis points; the 5-year note, up 14 basis points; the 7-year note, up 15 basis points; the 10-year note, up 14 basis points; and the 30-year bond, up 14 basis points. The 3-month T-bill nudged down 1 basis point. For this past week Treasury rates were up as follows: the 2-year note, up 5 basis points; the 5-year note, up 14 basis points; the 7-year note, up 15 basis points; the 10-year note, up 14 basis points; and the 30-year bond, up 14 basis points. The 3-month T-bill nudged down 1 basis point.
Long-term rates have risen in recent months on the Fed announcing “measured steps” for reducing purchases of bonds. Meanwhile, the Fed has emphasized that it is going to be a while before the fed funds target rate goes up.
 After some sharp daily swings, the spot price of West Texas Intermediate ended the week with essentially no change. After some sharp daily swings, the spot price of West Texas Intermediate ended the week with essentially no change.
Spot WTI jumped more than $2 per barrel Monday on worries about Ukraine but fell back about a buck and a half on Tuesday as those tensions eased.
A gain in inventories in a Wednesday government report led to a more than $2 drop in crude for the day. Spot WTI rose moderately Thursday and Friday on initial jobless claims and payroll employment.
Net for the week, the spot price for West Texas Intermediate creaked up 8 cents per barrel to settle at $102.54.
The atypically harsh winter weather continued to weigh on economic data but the latest employment report shows signs of thawing.
 It was not outstanding but it beat the consensus and showed a little more strength—payroll jobs. Total nonfarm payroll jobs gained 175,000 in February after a 129,000 rise in January and an 84,000 increase in December. The net revision for the prior two months was up 25,000. Expectations for February were for 150,000. The BLS did note that atypically severe winter weather occurred during the payroll reference period. While not specifically stating, the implication is that the labor market is somewhat stronger than the official payroll number for February. It was not outstanding but it beat the consensus and showed a little more strength—payroll jobs. Total nonfarm payroll jobs gained 175,000 in February after a 129,000 rise in January and an 84,000 increase in December. The net revision for the prior two months was up 25,000. Expectations for February were for 150,000. The BLS did note that atypically severe winter weather occurred during the payroll reference period. While not specifically stating, the implication is that the labor market is somewhat stronger than the official payroll number for February.
 The unemployment rate nudged up to 6.7 percent in February from 6.6 percent the month before. The consensus called for 6.6 percent. The unemployment rate nudged up to 6.7 percent in February from 6.6 percent the month before. The consensus called for 6.6 percent.
Turning back to the payroll portion of the report, goods-producing jobs rose 22,000 in February after a boost of 61,000 in January. Construction improved by 15,000, following a 50,000 increase the month before. Manufacturing jobs gained 6,000—the same as in January.
Private service-providing jobs jumped 140,000, following an 84,000 rise in January. In February, job gains occurred in professional and business services and in wholesale trade, while information lost jobs. Employment in professional and business services increased by 79,000 in February. Accounting and bookkeeping services added 16,000 jobs. Employment continued to trend up in temporary help services (+24,000) and in services to buildings and dwellings (+11,000).
Government jobs rebounded 13,000 after declining 16,000 in January.
Average weekly hours slipped to 34.2 from 34.3 in January. This dip almost certainly was weather related. A big plus in today’s report was a jump in average hourly earnings growth to 0.4 percent in February from 0.2 percent the prior month.
Average weekly hours slipped to 34.2 from 34.3 in January. A big plus was a jump in average hourly earnings growth to 0.4 percent in February from 0.2 percent the prior month.
Looking ahead to the personal income report, from the payroll survey, private aggregate weekly earnings rose 0.2 percent in February, pointing to a moderate rise in private wages & salaries. Production worker hours in manufacturing dipped 0.2 percent for the month, suggesting a sluggish manufacturing component for February industrial production.
The latest jobs report almost certainly is strong enough to keep the Fed’s taper strategy on track—a $10 billion slowing after each FOMC meeting this year into late this year.
 Personal income gained moderately in January but spending increased only on signing up for the Affordable Care Act. Personal income gained moderately in January but spending increased only on signing up for the Affordable Care Act.
Personal income rose 0.3 percent following no change in December. The important wages & salaries component was not as strong, rebounding 0.2 percent in January after a 0.1 percent dip in December.
Spending jumped 0.4 percent, following a 0.1 percent increase in December. But it was all services which spiked 0.9 percent after a modest 0.1 percent rise in December. Tugged down by autos, durables declined 0.6 percent in January, following a 0.1 percent advance the prior month. Nondurables dropped 0.7 percent after jumping 0.8 percent in December. Durables and nondurables likely were held down by atypically adverse winter weather.
Regarding personal consumption, the Commerce Department noted the impact of the Affordable Care Act on services.
"Measures of health care services were boosted $29.0 billion to reflect the effect of the ACA on demand for these services."
 Headline prices rose 0.1 percent, following a 0.2 percent boost the month before. Core price inflation held steady with a 0.1 percent for each of the latest months. Headline prices rose 0.1 percent, following a 0.2 percent boost the month before. Core price inflation held steady with a 0.1 percent for each of the latest months.
On a year ago basis, headline inflation was 1.2 percent in January versus 1.1 percent the month before. Core inflation eased to 1.1 percent from 1.2 percent.
Going back to income analysis, some special factors came into play. The Commerce Department noted:
"The change in the January estimate of personal income was affected by several special factors. Personal income in January was boosted by several provisions of the Affordable Care Act (ACA), which affected government social benefit payments to persons. In addition, personal income was boosted by cost-of-living adjustments to several federal transfer programs and by pay raises for civilian and military personnel. In contrast, the change in personal income in January was reduced by the expiration of Emergency Unemployment Compensation programs and by lump-sum social security benefit payments that had boosted December personal income. In summary, excluding all of these special factors, personal income increased $23.7 billion, or 0.2 percent, in January, in contrast to a decrease of $15.1 billion, or 0.1 percent, in December."
Overall, we are still in a few months of uncertainty due to atypically adverse winter weather weighing on consumer spending-consumers often have preferred to stay inside than shop. Numbers may improve for March.
 Vehicle sales remain at a solid level but continue to show little month-to-month strength, at a 15.3 million annual rate in February versus 15.2 million and 15.4 million in the prior two months. Since September, sales have averaged a 15.5 million pace. However, the February total monthly percentage change may provide some lift to retail sales with a 0.7 percent rise in total unit sales after a 1.0 percent dip in January. Vehicle sales remain at a solid level but continue to show little month-to-month strength, at a 15.3 million annual rate in February versus 15.2 million and 15.4 million in the prior two months. Since September, sales have averaged a 15.5 million pace. However, the February total monthly percentage change may provide some lift to retail sales with a 0.7 percent rise in total unit sales after a 1.0 percent dip in January.
Sales of North American vehicles posted at 12.2 million versus January's 12.1 million. Foreign made vehicles sold at a 3.2 million pace, again little changed from January. The split between cars and trucks also showed little change.
Markit's US manufacturing survey reported a sharp upturn in growth during February, at a composite 57.1 vs 53.7 for January. The mid-month flash reading for February was 56.7.
February's strength was centered in the most important component of all, new orders which jumped to 59.6 from January's 53.9. Domestic orders made for the bulk of the gain as new export orders show much less growth, at 51.6 which however was noticeably above January's contractionary rate of 48.4. Backlog orders were also a standout in February, up a very strong 8.7 points to 57.9.
Weather effects were very evident in the ISM manufacturing report though the composite index did bounce 1.9 points higher in February to a higher-than-expected 53.2 from a very weather-depressed January reading of 51.3.
Shipping snags appear to have slowed production which fell a very sharp 6.6 points to a contractionary 48.2. Supplier deliveries slowed sharply, up 4.2 points to 58.5 which is the slowest reading since April 2011. Note that slowing in deliveries is usually considered a sign of economic strength and lifts the composite, but in this case it is likely only a sign of weather troubles in shipping.
Order readings showed less weather effect and were positive. New orders rose 3.3 points to a respectable 54.5 while new export orders came in at 53.5, to show only a little less monthly growth compared to January's 54.5. Backlog orders jumped back to the growth column, up 4.0 points to 52.0.
The Markit and ISM manufacturing reports point to a bounce back for the manufacturing sector which has had a tough winter.
 The nation's trade gap came in very near expectations, at $39.1 billion in January versus a slightly revised $39.0 billion in December. Exports rose a respectable $1.2 billion, offset by a slightly higher rise in imports of $1.3 billion. The nation's trade gap came in very near expectations, at $39.1 billion in January versus a slightly revised $39.0 billion in December. Exports rose a respectable $1.2 billion, offset by a slightly higher rise in imports of $1.3 billion.
Exports rebounded 0.6 percent after falling 1.6 percent in December. Imports increased 0.6 percent in January, following a 0.2 percent increase the month before.
Industrial supplies drove the increases on both sides of the ledger. The petroleum deficit widened to $19.3 billion from $15.5 billion while the non-petroleum goods gap narrowed to $39.2 billion from $41.9 billion.
The services surplus rose to $20.2 billion from $19.7 billion.
On a year-ago basis, overall exports were up 3.0 in January after 1.4 percent in December. Imports rose 1.2 percent, following a 1.4 percent increase.
Overall, global trade is increasing modestly, adding to U.S. growth on average.
 January construction outlays gained 0.1 percent, following a jump of 1.5 percent the month before. But strength was in housing. Private residential outlays increased 1.1 percent after a 2.6 percent boost the month before. New one-family outlays advanced 2.3 percent in January after rising 3.4 percent in December. January construction outlays gained 0.1 percent, following a jump of 1.5 percent the month before. But strength was in housing. Private residential outlays increased 1.1 percent after a 2.6 percent boost the month before. New one-family outlays advanced 2.3 percent in January after rising 3.4 percent in December.
Private nonresidential spending dipped 0.2 percent, following a 1.2 percent increase in December. Public outlays fell 0.8 percent in January, following a 0.4 percent rise in December.
On a year-ago basis, total outlays were up 9.3 percent after a 6.6 percent gain the prior month.
Overall, it appears that home builders withstood winter weather better than home shoppers. The news on residential spending is not dramatic but favorable for an upward trend.
Markit's services PMI slowed sharply during the heavy weather of February, to 53.3 from January's 56.7. The latest reading signals the slowest pace of monthly growth for services activity since the government shutdown of October. Employment growth slowed sharply, to 51.9 from 54.1 while price pressures eased with both input prices and prices charged moving about 2 points lower, to 54.7 and 52.9 respectively which are soft rates of growth. New business, however, remains solid, at 56.0 vs 56.4 to signal a snap-back for spring.
 ISM non-manufacturing data broke substantially lower in the heavy weather of February, with the composite index down 2.4 points to a 51.6 reading that is below the low end of the Econoday consensus and indicates the lowest rate of monthly growth since February 2010. ISM non-manufacturing data broke substantially lower in the heavy weather of February, with the composite index down 2.4 points to a 51.6 reading that is below the low end of the Econoday consensus and indicates the lowest rate of monthly growth since February 2010.
But there is a slight positive in the report and that's improvement in new orders, up 4 tenths to 51.3 to indicate a slightly higher rate of monthly growth. New orders had been very flat in the two prior reports.
The Beige being prepared for the March 18-19 FOMC suggests that the Fed will stay on track with “measured steps” for taper of quantitative easing. The latest Beige Book confirms that atypically adverse weather continued to hit economic data. But the Beige Book noted that eight of twelve Fed Districts had modest to moderate improvement. Economic activity fell in two Districts due to the weather.
Retail sales growth weakened due to weather limiting activity-including for auto sales.
The demand for nonfinancial services was mixed compared with the last report; however, both Boston and San Francisco reported strong demand for technology related services. Manufacturing sales and production in several Districts were negatively impacted by severe winter weather; however, modest improvements were noted in Boston, Atlanta, Minneapolis, and Dallas.
Residential real estate markets continued to improve in several areas, albeit modestly. Many Districts cited low inventories of housing and continued home price appreciation. Commercial real estate leasing expanded, according to most reports, while reports on construction activity were mixed.
Manufacturing activity expanded at a moderate pace from January through early February in most Districts. Several Districts reported that severe winter weather had a negative effect on sales and production during this period, including Boston, New York, Philadelphia, Cleveland, Richmond, Atlanta, Chicago, St. Louis, and Dallas. The weather was cited to have caused utility outages, disrupted supply chains and production schedules, and resulted in a slowing of sales to affected customers.
Employment levels improved gradually for most Districts, and shortages of specialized skilled labor continued to be reported. Price pressures remained subdued, with the exception of upward cost pressures for some energy and construction products. Wage pressures remained stable for most Districts.
Overall, atypically adverse weather slowed economic activity-no surprise. The Fed will look to March numbers to get a better feel for the strength of the economy. But the anecdotal update is strong enough to keep the Fed on a taper schedule of $10 billion each FOMC meeting—especially after moderate improvement in payroll employment in February.
Weather continues to create uncertainty about economic data. Now, the view is that the economy is a little better than the data whereas earlier many thought weather was an excuse for soft numbers. And the Fed likely will continue scheduled taper.
The consumer sector stands out this week. Retail sales in January were held back by adverse winter weather. This week’s question is how much did weather affect February retail sales' Early indications from flattish motor vehicle sales suggest that retail sales will be sluggish. Consumer confidence numbers have been mixed—partly affected by adverse weather. This week’s reading on early March consumer sentiment may indicate if the consumer mood is improving with the approach of spring after a miserable winter.
The NFIB Small Business Optimism Index for January was up 2 tenths to 94.1. Other readings were mixed with hiring plans up and at a new recovery high but with earnings trends and expansion plans down.
NFIB Small Business Optimism Index Consensus Forecast for February 14: 94.0
Range: 93.0 to 94.5
The Labor Department’s Job Openings and Labor Turnover Survey showed 3.990 million job openings on the last business day of December, down slightly from November's 4.033 million. The hires rate (3.2 percent) and separations rate (3.2 percent) were little changed in December. This release includes estimates of the number and rate of job openings, hires, and separations for the nonfarm sector by industry and by geographic region. There were 4.437 million hires in December, little changed from November. There were 4.370 million total separations in December, little changed from November. The number of total separations was essentially unchanged for total private and government.
JOLTS job openings Consensus Forecast for January 14: 4.000 million
Range: 3.950 million to 4.050 million
Wholesale inventories showed a 0.3 percent build in December and were well matched by a 0.5 percent rise in wholesale sales that left the stock-to-sales ratio for the wholesale sector unchanged at 1.17. This ratio has held between 1.18 and 1.17 since May.
Wholesale inventories Consensus Forecast for January 14: +0.4 percent
Range: +0.2 to +0.7 percent
The U.S. Treasury monthly budget report posted in January a deficit of $10.4 billion with the year-to-date deficit, 4 months into the government's fiscal year, at $144 billion which is just less than half of the $290 billion deficit this time last year. Receipts were up 8.2 percent year-on-year boosted not only by stronger economic growth but also by the end of extended unemployment benefits which has shaved about $7 billion off the year-to-date deficit. The other side of the balance sheet also showed improvement with spending down a year-to-date 2.8 percent that includes declines for defense and net interest payments. Looking ahead, the month of February typically shows a deficit for the month. Over the past 10 years, the average deficit for the month of February has been $169.8 billion and $214.5 billion over the past 5 years. The February 2013 deficit came in at $203.5 billion.
Treasury Statement Consensus Forecast for February 14: -$218.0 billion
Range: -$224.0 billion to -$134.0 billion.
Initial jobless claims fell a very sizable 26,000 in the March 1 week to a much lower-than-expected 323,000. The 4-week average was down 2,000 to 336,500 but was still a little high and was slightly above the month-ago comparison. Continuing claims were also moving lower, down 8,000 in lagging data for the February 22 week to 2.907 million. The 4-week average was down 15,000 to a 2.928 million level that is more than 50,000 below a month-ago.
Jobless Claims Consensus Forecast for 3/8/14: 330,000
Range: 325,000 to 339,000
Retail sales have not been doing very well but it may be due to atypically adverse weather. Overall retail sales in January fell 0.4 percent in January, following a decrease of 0.1 percent in December. Autos pulled down the total. Motor vehicle & parts declined 2.1 percent, following a decrease of 1.8 percent in December. Excluding autos, sales were unchanged after gaining 0.3 percent the month before. Adverse weather discouraged consumers from going to auto dealers. Gas station sales increased 1.1 percent after jumping 1.5 percent in December. Excluding both autos and gasoline, sales slipped 0.2 percent after rising 0.1 percent in December. In the core, strength was seen in electronics & appliance stores; building materials & garden equipment; and grocery stores. Declines were seen in furniture & home furnishings; health & personal care; clothing; sporting goods, hobby, et al; department stores; nonstore retailers; and food services & drinking places. The big question is how much did weather affect February sales.
Retail sales Consensus Forecast for February 14: +0.2 percent
Range: -0.1 to +0.4 percent
Retail sales excluding motor vehicles Consensus Forecast for February 14: +0.1 percent
Range: -0.2 to +0.3 percent
Less motor vehicles & gasoline Consensus Forecast for February 14: +0.1 percent
Range: -0.3 to +0.4 percent
Import prices in January inched up 0.1 percent while export prices rose 0.2 percent. But year-on-year rates remain well into the negative column, at minus 1.5 percent for import prices and minus 1.2 percent for export prices. The year-on-year rates for import & export prices have been in the negative column since July which is the longest negative run since 2009.
Prices for imported fuel fell 0.6 percent in January for the third decline in four months. Petroleum prices fell 1.2 percent which was offset by another surge in natural gas prices which rose 14.1 percent in the month for a 67.3 percent gain over the past four months. Excluding fuel, import prices did show some life in January, up 0.3 percent which however follows four months of flat readings.
Details on the export side also a little monthly pressure, but again not much. Non-agricultural prices, reflecting higher prices for industrial supplies, capital goods, and vehicles, rose 0.2 percent following a 0.5 percent rise in December. Agricultural prices fell 0.5 percent and are down 5.7 percent year-on-year.
Import prices Consensus Forecast for February 14: +0.5 percent
Range: +0.2 to +1.0 percent
Export prices Consensus Forecast for February 14: +0.2 percent
Range: +0.2 to +0.5 percent
Business inventories rose 0.5 percent in December—well beyond a 0.1 percent rise business sales to drive the stock-to-sales ratio up 1 notch to 1.30 which is the highest reading since April, a time when the economy was picking up steam, not losing steam. The component for the retail sector showed a significant and unwanted build, up 0.6 percent versus no change for sales which drove up the stock-to-sales ratio for the sector to 1.45 from November's 1.44. This is the fourth straight rise for this ratio and the highest reading of the recovery.
Business inventories Consensus Forecast for January 14: +0.4 percent
Range: +0.2 to +0.4 percent
The producer price index for final demand rose 0.2 percent in January after a gain of 0.1 percent in December. What the "core" series is remains open to debate. Total final demand excluding food & energy increased 0.2 percent after no change in December. Total final demand excluding food, energy, and trade services edged up 0.1 percent in January, following a boost of 0.3 percent in December. For the overall PPI, the year-ago rate posted at 1.2 percent versus 1.1 percent in December (seasonally adjusted). On a not seasonally adjust basis, PPI final demand was up 1.2 percent in January; excluding food & energy, up 1.3 percent. Excluding food, energy & trade services is not yet available on a year-ago basis since the series starts for August 2013.
PPI-FD Consensus Forecast for February 14: +0.2 percent
Range: +0.1 to +0.4 percent
PPI-FD ex Food & Energy Consensus Forecast for February 14: +0.1 percent
Range: 0.0 to +0.2 percent
PPI-FD ex Food & Energy & Trade Services Consensus Forecast for February 14
No consensus numbers are available for this month’s report
The Reuter's/University of Michigan's consumer sentiment index has held steady through this winter's heavy weather. The composite index for February was 81.6, little changed from the 81.2 readings for both mid-month February and final January. The current conditions component, which offers an indication on monthly consumer activity, was slightly lower, at 95.4 versus January's 96.8. The expectations component was slightly higher, at 72.7 for February vs 71.2 for January.
Consumer sentiment Consensus Forecast for preliminary March 14: 81.8
Range: 80.5 to 83.0
R. Mark Rogers is the author of The Complete Idiot’s Guide to Economic Indicators, Penguin Books.
He can also be found on a weekly broadcast talking about the U.S. economy, the easiest way to find him is by going to iTunes and searching for "Simply Economics."
Econoday Senior Writer Mark Pender contributed to this article.
|
