|
This past week’s economic news was moderately net positive. However, Ukraine worries and slowing in China overshadowed U.S. data.
 Equities dipped notably this past week, largely on news from overseas. The week got off to a soft start with stocks dipping Monday. Data out over the weekend before showed that Chinese February exports dropped 18.1 percent from a year ago, compared with expectations for an increase of 4 percent. Also, Japan reported its economy grew more slowly than initially estimated in the fourth quarter of 2013. Stocks continued to decline Tuesday on worries about slowing growth in China and political tensions regarding Ukraine. Commodity related stocks were hit as copper fell below the $3 mark. Equities dipped notably this past week, largely on news from overseas. The week got off to a soft start with stocks dipping Monday. Data out over the weekend before showed that Chinese February exports dropped 18.1 percent from a year ago, compared with expectations for an increase of 4 percent. Also, Japan reported its economy grew more slowly than initially estimated in the fourth quarter of 2013. Stocks continued to decline Tuesday on worries about slowing growth in China and political tensions regarding Ukraine. Commodity related stocks were hit as copper fell below the $3 mark.
 Equities were mixed at mid-week with commodities still under pressure and with copper still weak. However, techs and small caps rebounded on bottom fishing as these sectors were down the most on Tuesday. Equities were mixed at mid-week with commodities still under pressure and with copper still weak. However, techs and small caps rebounded on bottom fishing as these sectors were down the most on Tuesday.
U.S. stocks tumbled Thursday, with the S&P suffering its worst day since early February, on rising tension between Ukraine and Russia and concerns about a slowdown in China. Better U.S. economic data—better retail sales and lower initial jobless claims—were overshadowed as focus shifted to Sunday's referendum in Crimea when the population will be asked whether they want to become part of Russia. Stocks continued downward Friday on continued worries about the pending referendum in Crimea. Also, consumer sentiment for early March fell short of expectations.
Equities were down this past week. The Dow was down 2.4 percent; the S&P 500, down 2.0 percent; the Nasdaq, down 2.1 percent; the Russell 2000, down 1.8 percent; and the Wilshire 5000, down 1.9 percent.
For the year-to-date, major indexes are mixed as follows: the Dow, down 3.1 percent; the S&P 500, down 0.4 percent; the Nasdaq, up 1.6 percent; the Russell 2000, up 1.5 percent; and the Wilshire 5000, up 0.3 percent.
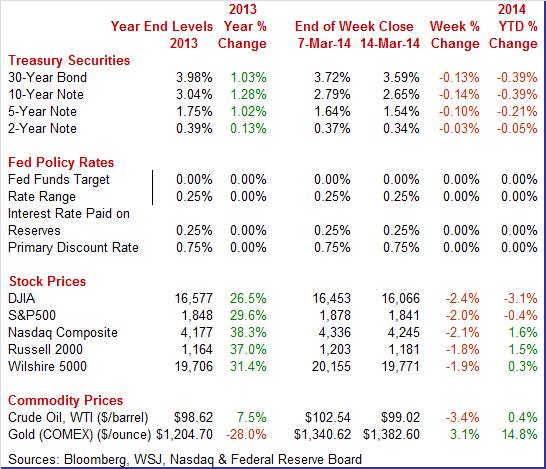
Weekly percent change column reflects percent changes for all components except interest rates. Interest rate changes are reflected in simple differences.
 Treasury yields declined moderately this past week. After little change (but nudging downward) on Monday and Tuesday, rates eased Wednesday on concern that slowing growth in the Chinese economy would weigh on global economic growth. The biggest move of the week was Thursday as rates declined on flight to safety on worries about the then upcoming referendum in Crimea. Rates held steady at week’s end. Treasury yields declined moderately this past week. After little change (but nudging downward) on Monday and Tuesday, rates eased Wednesday on concern that slowing growth in the Chinese economy would weigh on global economic growth. The biggest move of the week was Thursday as rates declined on flight to safety on worries about the then upcoming referendum in Crimea. Rates held steady at week’s end.
For this past week Treasury rates were down as follows: the 2-year note, down 3 basis points; the 5-year note, down 10 basis points; the 7-year note, down 13 basis points; the 10-year note, down 14 basis points; and the 30-year bond, down 13 basis points. The 3-month T-bill was unchanged.
 The spot price of West Texas Intermediate fell sharply this past week. Crude dropped more than a buck and a half on Monday on news of weakness in Chinese exports. WTI declined almost another $1-1/2 per barrel on Tuesday on belief that U.S. stockpiles rose the prior week. Spot crude fell $1-1/2 per barrel Wednesday on news from a weekly government report that inventories were up significantly. After little change Thursday, spot WTI rose somewhat under a dollar a barrel on Friday after the International Energy Agency boosted its demand forecast and as tensions grew in Ukraine. The spot price of West Texas Intermediate fell sharply this past week. Crude dropped more than a buck and a half on Monday on news of weakness in Chinese exports. WTI declined almost another $1-1/2 per barrel on Tuesday on belief that U.S. stockpiles rose the prior week. Spot crude fell $1-1/2 per barrel Wednesday on news from a weekly government report that inventories were up significantly. After little change Thursday, spot WTI rose somewhat under a dollar a barrel on Friday after the International Energy Agency boosted its demand forecast and as tensions grew in Ukraine.
Net for the week, the spot price for West Texas Intermediate dropped $3.52 per barrel to settle at $99.02.
It is sounding old but still holds true—atypically adverse weather continues to distort economic data. But maybe the underlying health is stronger than the latest numbers.
 Retail sales made a comeback in February but January was weaker than initially estimated. Weather is still a factor. Retail sales rebounded 0.3 percent in February after declining 0.6 percent in January (originally down 0.4 percent). The consensus projected a 0.2 percent gain. Motor vehicle sales added lift, increasing 0.3 percent, following a 2.2 percent drop in January. Excluding motor vehicles, sales gained 0.3 percent after falling 0.3 percent in January. Market expectations were for a 0.1 percent rise. Gasoline sales were up only a marginal 0.1 percent after a 1.0 percent jump the month before. Retail sales excluding autos and gasoline increased 0.3 percent after declining 0.5 percent in January. Analysts projected a 0.1 percent gain. Retail sales made a comeback in February but January was weaker than initially estimated. Weather is still a factor. Retail sales rebounded 0.3 percent in February after declining 0.6 percent in January (originally down 0.4 percent). The consensus projected a 0.2 percent gain. Motor vehicle sales added lift, increasing 0.3 percent, following a 2.2 percent drop in January. Excluding motor vehicles, sales gained 0.3 percent after falling 0.3 percent in January. Market expectations were for a 0.1 percent rise. Gasoline sales were up only a marginal 0.1 percent after a 1.0 percent jump the month before. Retail sales excluding autos and gasoline increased 0.3 percent after declining 0.5 percent in January. Analysts projected a 0.1 percent gain.
 In the core, strength in February was in sporting goods, hobby, book & music stores; nonstore retailers; health & personal care and furniture & home furnishings. A notable decline was only seen in miscellaneous store retailers although a few categories showed marginal decreases. In the core, strength in February was in sporting goods, hobby, book & music stores; nonstore retailers; health & personal care and furniture & home furnishings. A notable decline was only seen in miscellaneous store retailers although a few categories showed marginal decreases.
Interestingly, building materials & garden equipment rose 0.3 percent in February, following a gain of 1.4 percent the prior month. This may point to moderate strength in housing despite the weather.
Overall, we are still wading through weather effects which almost certainly weighed on first quarter growth-including the consumer sector.
 Consumer sentiment dipped in early March but not the assessment of current conditions. The composite index was down 1.7 points at mid-month to a lower-than-expected 79.9, but the current conditions component is actually higher, up 7 tenths to 96.1 to indicate comparative strength vs February. Consumer sentiment dipped in early March but not the assessment of current conditions. The composite index was down 1.7 points at mid-month to a lower-than-expected 79.9, but the current conditions component is actually higher, up 7 tenths to 96.1 to indicate comparative strength vs February.
The weakness is in the expectations component, a more abstract reading that is down 3.3 points to 69.4. It would be speculative to wonder what's behind this dip; slow growth in the jobs market is a likely factor but perhaps the building conflict in Ukraine is also a factor.
 There were 4.0 million job openings on the last business day of January, little changed from December. The hires rate (3.3 percent) and separations rate (3.2 percent) was also little changed in January. There were 4.0 million job openings on the last business day of January, little changed from December. The hires rate (3.3 percent) and separations rate (3.2 percent) was also little changed in January.
The number of openings also was little changed in total private and government. The number of job openings decreased in retail trade; the number increased in health care and social assistance and in arts, entertainment, and recreation. The West region experienced a rise in job openings in January.
There were 4.5 million hires in January, little changed from December. The number of hires was essentially unchanged for total private and government. The number of hires fell in January in retail trade and in the Midwest.
There were 4.5 million total separations in January, little changed from December. The number of total separations was essentially unchanged for total private and government.
In January, the quits rate was little changed at 1.7 percent for total nonfarm. The rate was little changed for total private (1.9 percent) and unchanged for government (0.6 percent). The quits rate was essentially unchanged over the month in all industries and in all four regions.
 The revamped producer prices report shows limited inflation pressure. In fact, there was some deflation in parts of the latest report. The PPI for total final demand dipped 0.1 percent in February after rising 0.2 percent in January. Market expectations were for 0.2 percent increase. Total final demand excluding food & energy declined 0.2 percent after increasing 0.2 percent the month before. The consensus called for 0.1 percent. Total final demand excluding food, energy, and trade services edged up 0.1 percent in February, matching the pace in January. The revamped producer prices report shows limited inflation pressure. In fact, there was some deflation in parts of the latest report. The PPI for total final demand dipped 0.1 percent in February after rising 0.2 percent in January. Market expectations were for 0.2 percent increase. Total final demand excluding food & energy declined 0.2 percent after increasing 0.2 percent the month before. The consensus called for 0.1 percent. Total final demand excluding food, energy, and trade services edged up 0.1 percent in February, matching the pace in January.
In February, the 0.1 percent decrease in final demand prices can be traced to the index for final demand services, which fell 0.3 percent. Most of the February drop can be traced to margins for final demand trade services, which fell 1.0 percent. In contrast, prices for final demand goods advanced 0.4 percent.
On a not seasonally adjusted basis, PPI final demand was up 0.9 percent in February; excluding food & energy, up 1.1 percent. Excluding food, energy & trade services is not yet available on a year-ago basis since the series starts for August 2013.
The latest PPI report may be used by the doves within the Fed to argue for slowing taper. It certainly can be used to argue for retaining low interest rates. But we get to see CPI numbers this coming week.
 An energy-related surge in energy prices masks an otherwise benign import and export price report. Import prices jumped 0.9 percent in February but reflect a 4.4 percent weather-related surge in oil prices and a 22.4 percent weather-related spike in natural gas. Excluding fuel, import prices actually fell, down 0.2 percent for the second negative reading in the last three months. An energy-related surge in energy prices masks an otherwise benign import and export price report. Import prices jumped 0.9 percent in February but reflect a 4.4 percent weather-related surge in oil prices and a 22.4 percent weather-related spike in natural gas. Excluding fuel, import prices actually fell, down 0.2 percent for the second negative reading in the last three months.
Export prices also jumped in February, up 0.6 percent but again reflect fuel costs and also a one-month jump in agricultural costs. Export prices excluding food and fuels show a second 0.2 percent gain that follows two 0.1 percent declines.
A look at year-on-year readings confirms a wide trend of very soft prices. The year-on-year reading for import prices is minus 1.1 percent with petroleum prices, despite February's jump, down 2.6 percent. Non-fuel import prices are down 1.2 percent year-on-year. On the export side, year-on-year prices are down 1.3 percent with export prices excluding food and fuels down 1.3 percent. Agricultural prices are down 6.0 percent year-on-year.
 Another measure of wider price trends is finished goods where readings were flat at best. Monthly data for February showed only fractional change on both the import and export sides. Year-on-year rates range from minus 1.6 percent for imported vehicles to plus 0.2 percent for exported capital goods. Another measure of wider price trends is finished goods where readings were flat at best. Monthly data for February showed only fractional change on both the import and export sides. Year-on-year rates range from minus 1.6 percent for imported vehicles to plus 0.2 percent for exported capital goods.
The economy continues moderate upward momentum but financial markets remain subject to external events—lately Ukraine and China.
This week is heavy with economic news. The spotlight is on Fed Chair Janet Yellen’s first quarterly press conference, the Fed statement, and Fed forecasts. Manufacturing and housing sectors have been wavering. Key updates come from industrial production, housing starts, and existing home sales.
The Empire State manufacturing index improved only slightly in February while new orders fell back into contraction. The general conditions index for February came in at a lower-than-expected 4.48 vs 12.51 in January to indicate a slowing rate of monthly growth. The new orders index fell to minus 0.21 from January's unusually strong 10.98 for the third negative reading in the last four months. Lack of new orders points to longer term weakness for shipments and employment. Shipments, perhaps slowed by heavy weather, were still positive but just barely, at 2.13 which were well down from 15.52 in January.
Empire State Manufacturing Survey Consensus Forecast for March 14: 6.50
Range: 0.00 to 8.50
Industrial production fell 0.3 percent in January, following a 0.3 percent gain the month before. Analysts expected a 0.3 percent rise for the latest month. Turning to major components, it was worse for manufacturing which dropped 0.8 percent after a 0.3 percent increase in December. The consensus projected a 0.1 percent increase for January. Atypically adverse weather helped the overall number from being weaker as utilities jumped 4.1 percent in January, following a 1.4 percent dip the prior month. Mining slipped 0.9 percent after gaining 1.8 percent. Manufacturing excluding motor vehicles decreased 0.5 percent in January, following a 0.3 percent rise in December. Capacity utilization declined to 78.5 percent from 78.9 percent in December. Looking ahead, the manufacturing component for February is likely to be soft based on production worker hours in manufacturing dipping 0.2 percent for the month. But auto assemblies is always a wild card. Utilities may provide upward lift for the overall index.
Industrial production Consensus Forecast for February 14: +0.3 percent
Range: 0.0 to +0.5 percent
Manufacturing production component Consensus Forecast for February 14: +0.3 percent
Range: +0.2 to +0.5 percent
Capacity utilization Consensus Forecast for February 14: 78.6 percent
Range: 78.4 to 78.8 percent
NAHB housing market index for February fell very sharply, down a record 10 points to a much weaker-than-expected 46 which is the lowest reading since May last year. The traffic component fell 11 points to a very weak 31 which was the lowest reading since April. The component for current sales slowed substantially, also down 11 points but to a still plus-50 level of 51 that indicates monthly growth. Future sales fell 6 points to a still respectable 54. The regional breakdown shows broad weakness especially in the Northeast. The strongest region remains the West where California has been mostly spared by heavy weather.
NAHB housing market index Consensus Forecast for March 14: 50
Range: 45 to 54
Consumer price index inflation slowed in January at the headline level and core inflation remained soft. Headline CPI inflation in January eased to a monthly 0.1 rise after gaining 0.2 percent in December (new seasonal factors). The CPI excluding food and energy inflation rate held steady at 0.1 percent, matching the December pace. The energy component increased 0.6 percent, following a 1.6 percent boost in December. However, gasoline declined 1.0 percent after jumping 2.6 percent in December. Food price inflation nudged up marginally to 0.1 percent from flat the month before. Within the core, upward pressure was mainly from housing, up 0.4 percent. But softness was seen in apparel, down 0.3 percent. New vehicles dipped 0.3 percent and used cars fell 0.5 percent.
CPI Consensus Forecast for February 14 +0.1 percent
Range: 0.0 to +0.4 percent
CPI ex food & energy Consensus Forecast for February 14: +0.1 percent
Range: +0.1 to +0.2 percent
Housing starts in January were hit by extreme cold as starts plunged 16.0 percent to a 880,000 annual unit rate. Starts of single-family homes fell 15.9 percent to 573,000 with condos similarly in line, down 16.3 percent to 307,000. Starts in the South, which is by far the largest region for this report, fell 12.5 percent with the West, the second largest region, showing a 17.4 percent decline. Permits, which are less affected by weather, showed a smaller decline and probably more closely reflect the underlying trend for the new home market. Permits fell 5.4 percent to a 937,000 unit rate with single-family homes showing relative strength, down only 1.3 percent. Regionally, the South showed a 3.4 percent gain while the West showed a big decline, down 26.0 percent.
Housing starts Consensus Forecast for February 14: 0.910 million-unit rate
Range: 0.792 million to 0.935 million-unit rate
Housing permits Consensus Forecast for February 14: 0.960 million-unit rate
Range: 0.920 million to 1.003 million-unit rate
The U.S. current account deficit narrowed slightly in the third quarter, to $94.8 billion from a downward revised $96.6 billion in the second quarter. The improvement was led by a $4.0 billion increase in the surplus on income to $60.0 billion. Also helping was a narrowing in the deficit on unilateral transfers, down $388 million to $34.1 billion, and an increase in the trade surplus for services, up $278 million to $57.9 billion. A negative in the quarter was a widening in the trade deficit for goods, up $2.9 billion to $178.6 billion. The current account as a percentage of GDP fell 1 tenth in the quarter to 2.2 percent.
Current account Consensus Forecast for Q4 13: -$88.1 billion
Range: -$91.5 billion to -$81.2 billion
The FOMC announcement at 2:00 p.m. ET for the _ FOMC policy meeting is expected to leave policy rates unchanged. The big issues will be changes in the characterization of the economy, changes in guidance, and if there are any hints at slowing taper. Also, the Fed will release its quarterly forecasts at the same time as the statement.
FOMC Consensus Forecast for 3/18/13 policy vote on fed funds target range: unchanged at a range of zero to 0.25 percent
Chair press conference after the FOMC meeting statement is scheduled for 2:30 p.m. ET. Fed Chair Janet Yellen conducts a press conference after FOMC meetings in which participants present their quarterly economic forecasts. Yellen is expected to comment on the forecast and take Q&A.
Initial jobless claims fell 9,000 in the March 8 week to a 315,000 level. The 4-week average was down 6,250 to 330,500 which is more than 5,000 below the month-ago comparison.
Continuing claims, which lag by one week, tell the same story, down 48,000 in the March 1 week to 2.855 million. The 4-week average is down 19,000 to 2.916 million which is roughly 50,000 below a month ago.
Jobless Claims Consensus Forecast for 3/15/14: 325,000
Range: 320,000 to 335,000
The general business conditions index of the Philadelphia Fed's Business Outlook Survey fell back into the negative column, to minus 6.3 in February, compared to January's 9.4. This was the first negative reading since May. January’s big 7.8 point decline in the new order index signaled trouble for the latest report. And new orders were even worse for February, in negative ground at minus 5.2 for a major 10.3 point decline. Unfilled orders were also in negative ground, at minus 2.6 for a 1.6 point decline from January. Shipments, suffering from a lack of orders and also from weather effects, fell dramatically, down 22 points to minus 9.9.
Philadelphia Fed survey Consensus Forecast for March 14: 3.0
Range: -2.0 to 9.0
Existing home sales fell in January and it was not just to bad weather. Rising mortgage rates, limited supply, and higher prices also cut into sales. Existing home sales fell 5.1 percent in January to a 4.620 million annual rate. The year-on-year rate was also at minus 5.1 percent, a sharp contrast to the year-on-year median price which was up 10.7 percent. Supply of homes relative to sales did rise to 4.9 months from 4.6 months but the improvement was tied mostly to the drop in sales.
Existing home sales Consensus Forecast for February 14: 4.60 million-unit rate
Range: 4.50 to 4.75 million-unit rate
The Conference Board's index of leading indicators rose a respectable 0.3 percent in January. A decline in the factory workweek was a major negative for January as was the drop in the ISM index for new manufacturing orders. Positives in the report were once again led by financial measures, including the yield spread and the report's leading credit index where gains have been pointing to a rise in lending. A drop in unemployment claims was another major positive though claims have since moved sideways. But there was another negative that was not easily explained as a weather effect, and that was a drop in building permits which was January's largest negative. Other readings included a second straight 0.1 percent rise in the coincident index, which points to very limited ongoing growth, and a 0.3 percent gain for the lagging index which confirms respectable growth in prior periods.
Leading indicators Consensus Forecast for February 14: +0.3 percent
Range: 0.0 to +0.4 percent
Quadruple Witching
R. Mark Rogers is the author of The Complete Idiot’s Guide to Economic Indicators, Penguin Books.
He can also be found on a weekly broadcast talking about the U.S. economy, the easiest way to find him is by going to iTunes and searching for "Simply Economics."
Econoday Senior Writer Mark Pender contributed to this article.
|
