|
This past week, markets gave newly minted Fed Chair Janet extra attention for her first quarterly press conference. Despite an overall good performance during the press conference, markets honed in on one sentence that suggested tightening might come sooner than expected. Nonetheless, monetary policy is still on the same path as it was at the prior FOMC meeting.
 Equities finished the week up despite some Fed induced volatility. The week’s gains were notably front loaded. Stocks jumped Monday as Sunday’s referendum in Ukraine was peaceful and Monday’s data showed unexpected strength in industrial production. The next day, the Ukraine situation and economic news added lift. After Russian President Vladimir Putin signed a treaty formally annexing Ukraine's Crimea region after Crimeans voted overwhelmingly over the weekend to join Russia as expected, he offered calming comments that Russia did not want to partition Ukraine and that he would defend Russia’s interests by "diplomatic and legal means." Also on Tuesday, although housing starts posted as expected, housing permits came in notably higher than forecast. Equities finished the week up despite some Fed induced volatility. The week’s gains were notably front loaded. Stocks jumped Monday as Sunday’s referendum in Ukraine was peaceful and Monday’s data showed unexpected strength in industrial production. The next day, the Ukraine situation and economic news added lift. After Russian President Vladimir Putin signed a treaty formally annexing Ukraine's Crimea region after Crimeans voted overwhelmingly over the weekend to join Russia as expected, he offered calming comments that Russia did not want to partition Ukraine and that he would defend Russia’s interests by "diplomatic and legal means." Also on Tuesday, although housing starts posted as expected, housing permits came in notably higher than forecast.
 At mid-week, one comment by Fed Chair Janet Yellen during her first quarterly press conference sent stocks down significantly. When asked when rate hikes might start, she said they could start as soon as six months after the end of bond purchase programs. Markets focused on this comment although such timing was conditioned upon the economy. Yellen also characterized the first increase in vague terms—a considerable time after the end of taper. Some analysts indicated that the downdraft primarily came from program trading. At mid-week, one comment by Fed Chair Janet Yellen during her first quarterly press conference sent stocks down significantly. When asked when rate hikes might start, she said they could start as soon as six months after the end of bond purchase programs. Markets focused on this comment although such timing was conditioned upon the economy. Yellen also characterized the first increase in vague terms—a considerable time after the end of taper. Some analysts indicated that the downdraft primarily came from program trading.
On Thursday, a better than expected Philadelphia Fed manufacturing index reading helped erase most of the previous day's losses. Also, traders decided to worry less about Yellen’s comment the previous day. But the week finished on a somewhat sour note. Equities declined even after the S&P 500 hit a record intraday high in early trading. The sharp swings in trading for the day came amid quadruple witching—the simultaneous expiration of four types of futures and options contracts.
Equities were up this past week. The Dow was up 1.5 percent; the S&P 500, up 1.4 percent; the Nasdaq, up 0.7 percent; the Russell 2000, up 1.0 percent; and the Wilshire 5000, up 1.2 percent.
For the year-to-date, major indexes are mostly up as follows: the Dow, down 1.7 percent; the S&P 500, up 1.0 percent; the Nasdaq, up 0.7 percent; the Russell 2000, up 1.0 percent; and the Wilshire 5000, up 1.2 percent.
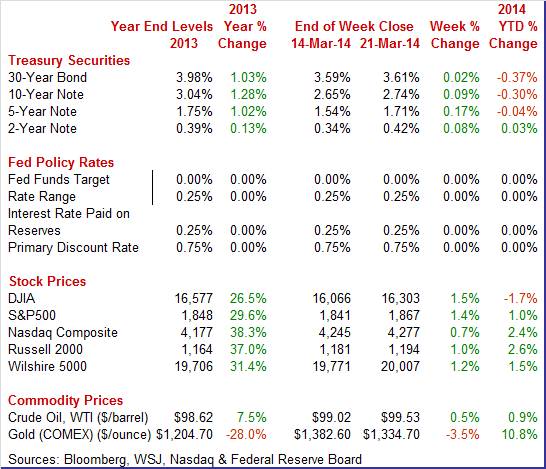
Weekly percent change column reflects percent changes for all components except interest rates. Interest rate changes are reflected in simple differences.
 Treasury yields ended the week up notably. The story is simple. It was the comment by Fed Chair Janet Yellen on the timing of the first rate hike that sent rates up on Wednesday. This implied to some traders that rates may go up sooner than earlier believed. There was little movement other days of the week. Treasury yields ended the week up notably. The story is simple. It was the comment by Fed Chair Janet Yellen on the timing of the first rate hike that sent rates up on Wednesday. This implied to some traders that rates may go up sooner than earlier believed. There was little movement other days of the week.
For this past week Treasury rates were up as follows: the 2-year note, up 8 basis points; the 5-year note, up 17 basis points; the 7-year note, up 15 basis points; the 10-year note, up 9 basis points; and the 30-year bond, up 2 basis points. The 3-month T-bill was unchanged.
 The spot price of West Texas Intermediate was essentially unchanged for the week even though there some notable daily swings in price. On Monday, crude eased by about a dollar a barrel to a five-week low after a relatively quiet referendum in Crimea on joining Russia and on belief that U.S. and European Union sanctions would not hinder oil shipments. On Tuesday, WTI rebounded a dollar and a half on news from Enterprise Products Partners LP that it would more than double the capacity of its Seaway pipeline by early as May. The Seaway pipeline moves oil from Cushing, Oklahoma to refineries in Houston, Texas. The spot price of West Texas Intermediate was essentially unchanged for the week even though there some notable daily swings in price. On Monday, crude eased by about a dollar a barrel to a five-week low after a relatively quiet referendum in Crimea on joining Russia and on belief that U.S. and European Union sanctions would not hinder oil shipments. On Tuesday, WTI rebounded a dollar and a half on news from Enterprise Products Partners LP that it would more than double the capacity of its Seaway pipeline by early as May. The Seaway pipeline moves oil from Cushing, Oklahoma to refineries in Houston, Texas.
WTI firmed slightly Wednesday on data from the weekly government report that supply had dipped. WTI slipped just under a dollar a barrel on Thursday. The dollar had strengthened after Fed Chair Yellen’s press conference implied a less loose monetary policy next year. Crude was essentially unchanged Friday.
Net for the week, the spot price for West Texas Intermediate nudged up 51 cents per barrel to settle at $99.53.
Fed policy is the big issue currently and the Fed is in transition on how it is providing guidance. After harsh winter weather, new data are mostly suggesting improvement head.
 Once again, the Fed left policy rates unchanged. Taper remains as scheduled with another $10 billion cut and further cuts are to be in measured steps. Once again, the Fed left policy rates unchanged. Taper remains as scheduled with another $10 billion cut and further cuts are to be in measured steps.
“Beginning in April, the Committee will add to its holdings of agency mortgage-backed securities at a pace of $25 billion per month rather than $30 billion per month, and will add to its holdings of longer-term Treasury securities at a pace of $30 billion per month rather than $35 billion per month. The Committee is maintaining its existing policy of reinvesting principal payments from its holdings of agency debt and agency mortgage-backed securities in agency mortgage-backed securities and of rolling over maturing Treasury securities at auction.”
 Further taper will be in measured steps “If incoming information broadly supports the Committee's expectation of ongoing improvement in labor market conditions and inflation moving back toward its longer-run objective.” This is a somewhat dovish comment, implying that the Fed wants not just an improved labor market but also wants inflation back to two percent. As before, taper is not on a preset course. Further taper will be in measured steps “If incoming information broadly supports the Committee's expectation of ongoing improvement in labor market conditions and inflation moving back toward its longer-run objective.” This is a somewhat dovish comment, implying that the Fed wants not just an improved labor market but also wants inflation back to two percent. As before, taper is not on a preset course.
 The unemployment rate trigger in guidance for the taper schedule was dropped, being replaced with more generic data dependency language. Loose policy will continue “until the outlook for the labor market has improved substantially in a context of price stability.” The unemployment rate trigger in guidance for the taper schedule was dropped, being replaced with more generic data dependency language. Loose policy will continue “until the outlook for the labor market has improved substantially in a context of price stability.”
The Fed continues to expect to maintain the current target range for the federal funds rate for a considerable time after the asset purchase program ends, especially if projected inflation continues to run below the Committee's two percent longer-run goal, and provided that longer-term inflation expectations remain well anchored.
On the economy, recent weakness was seen as largely weather related. The Committee expects that, with appropriate policy accommodation, economic activity will expand at a moderate pace and labor market conditions will continue to improve gradually, moving toward those the Committee judges consistent with its dual mandate. The Committee sees the risks to the outlook for the economy and the labor market as nearly balanced.
For forecasts, GDP growth was revised down from December very marginally while the unemployment rate also was nudged down. Inflation numbers were essentially unchanged from December.
The vote for the statement was 8 to 1, with Minneapolis Fed President Narayana Kocherlakota dissenting on the basis that one paragraph in particular “weakens the credibility of the Committee's commitment to return inflation to the 2 percent target from below and fosters policy uncertainty that hinders economic activity.”
Overall, the latest statement carries forward recent policy intentions but removes the obvious problem of the 6.5 percent unemployment rate trigger as not being appropriate. There does appear to be a little more emphasis on returning inflation to goal.
During the Chair’s press conference, Janet Yellen affirmed continuation of the policy intentions of the Fed under Ben Bernanke. However, she created a stir in the markets when she commented that the first rate hike could be six months after the end of taper. She also said the first rate hike would be after a considerable period of time after the end of the bond purchase programs.
Despite market reaction to one comment, overall policy remains the same other than how guidance is now worded. Policy changes appear to be on the same path as they were from the January 28-29 FOMC meeting.
 The weather held back industrial production in January but not in February as output rebounded in the latest data. Industrial production was unexpectedly strong in February and utilities actually tugged down on the latest number. Industrial production rebounded 0.6 percent after dipping 0.2 percent in January. The weather held back industrial production in January but not in February as output rebounded in the latest data. Industrial production was unexpectedly strong in February and utilities actually tugged down on the latest number. Industrial production rebounded 0.6 percent after dipping 0.2 percent in January.
By major components, manufacturing jumped 0.8 percent in February, following a 0.9 percent drop the month before. Mining rose 0.3 percent, following a 0.5 percent boost in January. Utilities slipped 0.2 percent after a 3.8 percent surge the prior month.
According to the Fed, much of the swing in the rates of change for production in January and February reflected the depressing effects on output of the severe weather in January and the subsequent return to more normal levels of production in February.
The production of durable goods rose 0.9 percent in February and was 2.7 percent above its year-earlier level. Large increases in February for several categories of durables more than offset large decreases in other categories. The biggest gain was in the output of motor vehicles and parts, which advanced 4.8 percent. Nondurable manufacturing output rose 0.7 percent in February after having dropped 1.1 percent in January; production in February was 0.5 percent above its level of a year earlier. Motor vehicle assemblies of autos and light trucks rebounded to an annualized 11.14 million units from 10.36 million units in January.
Manufacturing excluding motor vehicles increased 0.5 percent in February, following a 0.6 percent drop in January.
Capacity utilization improved to 78.8 percent from 78.5 percent in January. Expectations were for 78.6 percent.
Factory activity in February mostly recovered from weather depressed production in January. Manufacturers apparently made a strong effort to boost production after losses in January.
 Better weather in March is showing up in gains in manufacturing. Steady but slow is the indication from the Empire State index which is up slightly this month, to 5.61 from 4.48 in February. New orders also show a slight increase, to 3.13 versus last month's slightly contractionary reading of minus 0.21, as do shipments, at 3.97 vs 2.13. Growth in the sample's employment reading slowed, to 5.88 from 11.25. Better weather in March is showing up in gains in manufacturing. Steady but slow is the indication from the Empire State index which is up slightly this month, to 5.61 from 4.48 in February. New orders also show a slight increase, to 3.13 versus last month's slightly contractionary reading of minus 0.21, as do shipments, at 3.97 vs 2.13. Growth in the sample's employment reading slowed, to 5.88 from 11.25.
Other readings include a rise in inventories and a sizable draw in backlog orders. Price readings, despite this month's rise in fuel costs, show easing pressure.
March's mid-Atlantic weather also has been much less severe than February's weather, a factor that is giving a strong lift to the Philly Fed index which moved solidly into positive ground at 9.0 vs February's minus 6.3.
Details show wide improvement in the month including new orders, at 5.7 vs minus 5.2, unfilled orders, at 2.6 vs minus 2.6, and shipments, at 5.7 vs minus 9.9.
Essentially, manufacturing is regaining momentum in February and March—adding to the argument that improvement is ahead.
 Homebuilders are looking past recently adverse weather and are planning to bump up construction in coming months. Housing starts came in much as expected for February but permits topped the consensus forecast. Overall starts nudged down 0.2 percent to a 907,000 annual rate from an upwardly revised 909,000 rate for January which followed a downwardly revised December number of 1.024 million. January and December previously were 880,000 and 1.048 million, respectively. Homebuilders are looking past recently adverse weather and are planning to bump up construction in coming months. Housing starts came in much as expected for February but permits topped the consensus forecast. Overall starts nudged down 0.2 percent to a 907,000 annual rate from an upwardly revised 909,000 rate for January which followed a downwardly revised December number of 1.024 million. January and December previously were 880,000 and 1.048 million, respectively.
 Single-family starts rose 0.3 percent after a 13.2 percent plunge in January. Multifamily starts dipped 1.2 percent in February after a 7.6 percent decline the month before. Single-family starts rose 0.3 percent after a 13.2 percent plunge in January. Multifamily starts dipped 1.2 percent in February after a 7.6 percent decline the month before.
But February’s permit numbers showed improved optimism by homebuilders. Overall permits jumped 7.7 percent to a 1.018 million unit pace after decreasing 4.6 percent in January. Expectations were for 960,000. The increase was largely from a 24.3 percent spike in multifamily units while single-family permits eased 1.8 percent in both February and January.
It appears that housing is coming out of the severe winter weather doldrums but largely in the multifamily component.
 The softness in single-family permits can easily be explained by the recent downtrend in sales. For the sixth time in seven months, sales of existing homes contracted, at minus 0.4 percent in February following a very severe 5.1 percent contraction in January. Year-on-year, existing home sales are down 7.1 percent which is the steepest decline in nearly 3 years. The softness in single-family permits can easily be explained by the recent downtrend in sales. For the sixth time in seven months, sales of existing homes contracted, at minus 0.4 percent in February following a very severe 5.1 percent contraction in January. Year-on-year, existing home sales are down 7.1 percent which is the steepest decline in nearly 3 years.
Weak sales, however, are easing supply constraints as supply at the current sales rate rose to 5.2 months from 4.9 months. And more homes are coming into the market, at 2.00 million versus January's 1.88 million.
High prices continue to be a major factor holding back sales. The median price rose 0.6 percent to $189,000 with the year-on-year increase at 9.1 percent, in nearly double digits and a major contrast to the year-on-year contraction in sales.
Mortgage rates are not supporting sales as much as they had been. Conventional 30-year mortgage rates currently are about 4-1/2 percent, compared to 3-1/2 percent during late 2012 and early 2013.
Heavy weather in February no doubt held down sales but there's other factors holding sales back as well, certainly the weak jobs market is not a positive. But sales very well may improve with the spring for a housing market that needs to snap back.
 Consumer price inflation remained quite soft in February at the headline and core levels. Headline inflation posted at 0.1 percent, matching the pace in January and also matching market expectations. Similarly, the CPI excluding food and energy inflation rate held steady at 0.1 percent, equaling the January pace and meeting analysts’ forecasts. Consumer price inflation remained quite soft in February at the headline and core levels. Headline inflation posted at 0.1 percent, matching the pace in January and also matching market expectations. Similarly, the CPI excluding food and energy inflation rate held steady at 0.1 percent, equaling the January pace and meeting analysts’ forecasts.
The energy component declined 0.5 percent after increasing 0.6 percent in January. Gasoline fell 1.7 percent in February, following a decline of 1.0 percent the month before. Food price inflation, however, jumped to 0.4 percent after nudging up 0.1 percent in January.
 Year-on-year, overall CPI inflation was 1.1 percent in February, compared to 1.6 percent in January (seasonally adjusted). The core rate increased 1.6 percent year-on-year, matching the rate for January. For February, not seasonally adjusted year-ago percent changes for total and core CPI were 1.1 percent and 1.6 percent, respectively. Year-on-year, overall CPI inflation was 1.1 percent in February, compared to 1.6 percent in January (seasonally adjusted). The core rate increased 1.6 percent year-on-year, matching the rate for January. For February, not seasonally adjusted year-ago percent changes for total and core CPI were 1.1 percent and 1.6 percent, respectively.
Again, inflation remains quite low at the consumer level. The latest CPI report which posted one day before this past week’s Fed decision certainly added to the argument by some within the FOMC that there needs to be more focus more on below target inflation.
 The Fed seems somewhat optimistic about economic growth in coming months—the index of leading indicators suggests that the Fed may be right. Financial measures were mostly behind a sharp 0.5 percent rise in the index of leading economic indicators. The yield spread was once again the largest positive factor, as it has been throughout the recovery. The report's credit index was also a major positive factor, one that continues to point to improvement in lending. The Fed seems somewhat optimistic about economic growth in coming months—the index of leading indicators suggests that the Fed may be right. Financial measures were mostly behind a sharp 0.5 percent rise in the index of leading economic indicators. The yield spread was once again the largest positive factor, as it has been throughout the recovery. The report's credit index was also a major positive factor, one that continues to point to improvement in lending.
But there was one other major positive in this report and that's building permits where improvement tangibly points to economic strength.
Negatives, however, swept 5 of the 10 components, including those for the factory workweek and consumer expectations.
Other readings in the latest report included a 0.2 percent rise in the coincident index, one that points to a moderate ongoing rate of growth, and a 0.3 percent rise in the lagging index, one that followed 0.5 and 0.4 percent gains and pointing to a solid rate of growth in prior periods.
Data in the mid- and latter months of the first quarter suggest better momentum for the second quarter—especially as the recently wavering manufacturing and housing sectors show some signs of improvement. Still, adverse weather in January will still cut into first quarter numbers for GDP.
The focus this week is housing and manufacturing. Single-family home sales have been soft and the latest single-family components in housing starts and permits were sluggish. Updates will come from new home sales and pending home sales. House price growth has slowed, bringing more attention to this week’s Case-Shiller and FHFA reports. Factory activity is showing more life in industrial production. We will get the first readings at the national level for March with the Markit surveys.
The Chicago Fed National Activity Index in January was definitely a rough month for the economy, confirmed by the Chicago Fed's national activity index which fell sharply, to minus 0.39 from a revised minus 0.03 in December. Production, held down by weather issues, was by far the weakest component, pulling down the main index with a minus 0.36 reading versus a positive reading in December of plus 0.06. Retail sales and housing were also hurt by weather, reflected in the consumption & housing component which came in at minus 0.18 from December's already weak minus 0.14. The other two components made positive contributions with employment at plus 0.13, up from December's plus 0.06, and sales/orders/inventories at plus 0.02 vs minus 0.01.
Chicago Fed National Activity Index Consensus Forecast for February 13: 0.10
Range: -0.60 to 0.20
The Markit PMI manufacturing index (final) for February improved to 57.1 versus 53.7 for January. The mid-month flash reading for February was 56.7. February's strength was centered in the most important component of all, new orders which jumped to 59.6 from January's 53.9.
Markit PMI manufacturing flash index Consensus Forecast for March 14: 56.9
Range: 56.0 to 58.0
The FHFA purchase only house price index rebounded 0.8 percent in December after easing 0.1 percent the month before. But excluding some monthly volatility, the trend definitely has been upward. Prices have risen on a quarterly basis for 10 quarters in a row. The December increase topped expectations for a 0.3 percent monthly boost. Five Census divisions posted increases, one was flat, and two declined. On a year-ago basis, FHFA home prices for the U.S. were up 7.7 percent versus 7.3 percent in November.
FHFA purchase only house price index Consensus Forecast for January 14: +0.4 percent
Range: +0.3 to +1.0 percent
The S&P/Case-Shiller 20-city home price index (SA) was solid in December but a bit slower than prior months. Case-Shiller's 20-city index for the month rose an adjusted 0.8 percent, down from gains of 0.9 percent and 1.1 percent in the prior two months for the slowest rate of increase since July. The year-on-year rate was very strong but is also slowing, at plus 13.5 percent vs 13.8 and 13.6 percent in November and October.
The S&P/Case-Shiller 20-city HPI (SA, m/m) Consensus Forecast for January 14: +0.7 percent
Range: +0.4 to +1.1 percent
The S&P/Case-Shiller 20-city HPI (NSA, m/m) Consensus Forecast for January 14: -0.1 percent
Range: -0.3 to 0.0 percent
The S&P/Case-Shiller 20-city HPI (NSA, y/y) Consensus Forecast for January 14: +13.3 percent
Range: +11.2 to +13.8 percent
New home sales in a wild seesaw, surged a monthly 9.6 percent in January to 468,000 for the strongest annual rate since July 2008. In a further positive, December was revised upward by 13,000 to a 427,000 rate. The big rise in sales brought down supply relative to sales, to 4.7 months versus December's 5.2 months. Lack of available homes has been limiting sales and now looks to further limit sales. The median price was down 2.2 percent to $260,100. The year-on-year sales gain, which spent most of last year in the double digits, is now modest, at 3.4 percent and in line with the 2.2 year-on-year gain for sales.
New home sales Consensus Forecast for February 14: 440 thousand-unit annual rate
Range: 415 thousand to 460 thousand-unit annual rate
The Conference Board's consumer confidence index in February posted a 1.3 point dip to a lower-than-expected 78.1. The present situation component rose 4.4 points to 81.7 which was the highest level of the whole recovery, going back to April 2008. The gain is a positive indication, heavy weather or not, for consumer activity in February. Weakness in the report was centered in expectations, a more abstract assessment than the present situation where the index fell 5.1 points to 75.7.
Consumer confidence Consensus Forecast for March 14: 78.4
Range: 75.0 to 80.2
The Richmond Fed manufacturing index in February came in at minus 6 versus January's plus 12. Weakness swept the report including new orders, at minus 9 versus plus 14 in January, and backlog orders where contraction steepened to minus 8 vs minus 2. Shipments were also in negative ground as was capacity utilization and the workweek. Inventories are on the rise, the result of weak shipments, while employment is at zero for a second month.
Richmond Fed manufacturing index Consensus Forecast for March 14: 3
Range: 2 to 8
Durable goods orders for January, despite bad weather, pointed gains in manufacturing ahead. However, the good news was at the core level. New factory orders for durables in January decreased 1.0 percent, following a drop of 5.3 percent in December. The transportation component fell a monthly 5.7 percent after plunging 12.1 percent in December. However, other components were more positive. Excluding transportation, durables orders rebounded 1.1 percent in January after falling 1.8 percent the month before.
Numbers reflect revisions from the more recent total factory orders report.
New orders for durable goods Consensus Forecast for February 14: +1.0 percent
Range: -1.5 percent to +2.5 percent
New orders for durable goods, ex-trans., Consensus Forecast for February 14: +0.3 percent
Range: -1.7 percent to +1.5 percent
The Markit PMI services index slowed sharply during the heavy weather of February, to 53.3 from January's 56.7. The latest reading signals the slowest pace of monthly growth for services activity since the government shutdown of October. Employment growth slowed sharply, to 51.9 from 54.1 while price pressures eased with both input prices and prices charged moving about 2 points lower, to 54.7 and 52.9 respectively which are soft rates of growth. New business, however, remains solid, at 56.0 versus 56.4 to signal a snap-back for spring.
No consensus numbers are available for this month’s report
GDP growth for the fourth quarter was revised down sharply to an annualized 2.4 percent from the advance estimate of 3.2 percent and compared to the third quarter’s 4.1 percent. Final sales of domestic product were revised down to 2.3 percent from the advance estimate of 2.8 percent and compared to third quarter’s 2.5 percent. Final sales to domestic purchasers were revised down to 1.2 percent from the advance estimate of 1.4 percent and compared to third quarter’s 2.3 percent. By components, downward revisions were seen in PCEs, inventory investment, net exports, and government purchases. Nonresidential fixed investment was revised up. The overall price index was bumped up to 1.6 percent from 1.3 percent. Third quarter growth was 2.0 percent.
Real GDP Consensus Forecast for third estimate Q4 13: +2.7 percent annual rate
Range: +2.2 to +3.0 percent annual rate
GDP price index Consensus Forecast for third estimate Q4 13: +1.6 percent annual rate
Range: +1.6 to +1.6 percent annual rate
Initial jobless claims came in at a lower-than-expected 320,000 in the March 15 week versus 334,000 in the February 15 week. The same comparison of the 4-week averages showed similar improvement, at 327,000 vs 338,500. Continuing claims, which are reported with a week's lag, rose 41,000 in the March 8 week to 2.889 million. The 4-week average was down 17,000 to 2.897 million which is more than 50,000 below the month-ago comparison.
Jobless Claims Consensus Forecast for 3/22/14: 323,000
Range: 295,000 to 335,000
The pending home sales index for January edged up 0.1 percent to 95.0. Another plus was an upward revision to December, from severe contraction of minus 8.7 percent for the initial reading to minus 5.8 percent. A negative in the report was deepening contraction in the year-on-year rate, at minus 9.0 percent in January versus minus 6.3 percent in December.
Pending home sales Consensus Forecast for February 14: -0.8 percent
Range: -2.1 to +3.0 percent
The Kansas City Fed manufacturing index was 4 in February, similar to the reading of 5 in January and up from minus 3 in December. Other month-over-month indexes were mixed. The production index jumped from minus 8 to plus 3, and the shipments index also climbed higher. The order backlog and employment indexes decreased slightly, while the new orders index was unchanged.
Kansas City Fed manufacturing index Consensus Forecast for March 14: 5
Range: 3 to 6
Personal income in January rose 0.3 percent following no change in December. The important wages & salaries component was not as strong, rebounding 0.2 percent in January after a 0.1 percent dip in December. Spending jumped 0.4 percent, following a 0.1 percent increase in December. But it was all services which spiked 0.9 percent after a modest 0.1 percent rise in December. Tugged down by autos, durables declined 0.6 percent in January, following a 0.1 percent advance the prior month. Nondurables dropped 0.7 percent after jumping 0.8 percent in December. Durables and nondurables likely were held down by atypically adverse winter weather. Regarding personal consumption, the Commerce Department noted the impact of the Affordable Care Act on services: "Measures of health care services were boosted $29.0 billion to reflect the effect of the ACA on demand for these services." Headline prices rose 0.1 percent, following a 0.2 percent boost the month before. Core price inflation held steady with a 0.1 percent for each of the latest months.
Personal income Consensus Forecast for February 14: +0.2 percent
Range: +0.1 to +0.5 percent
Personal consumption expenditures Consensus Forecast for February 14: +0.3 percent
Range: +0.1 to +0.4 percent
PCE price index Consensus Forecast for February 14: +0.1 percent
Range: +0.1 to +0.2 percent
Core PCE price index Consensus Forecast for February 14: +0.1 percent
Range: +0.1 to +0.2 percent
The Reuter's/University of Michigan's consumer sentiment index dipped in early March but not the assessment of current conditions. The composite index was down 1.7 points at mid-month to a lower-than-expected 79.9, but the current conditions component is actually higher, up 7 tenths to 96.1 to indicate comparative strength versus February. The weakness was in the expectations component that was down 3.3 points to 69.4.
Consumer sentiment Consensus Forecast for final March 14: 80.5
Range: 79.9 to 83.0
R. Mark Rogers is the author of The Complete Idiot’s Guide to Economic Indicators, Penguin Books.
He can also be found on a weekly broadcast talking about the U.S. economy, the easiest way to find him is by going to iTunes and searching for "Simply Economics."
Econoday Senior Writer Mark Pender contributed to this article.
|
