|
After getting past the atypically adverse weather in January and somewhat in February, there was supposed to be a bounce back afterward. So far, the rebound has been muted. Equities continue to oscillate on economic news and other events—Ukraine is still a source of volatility.
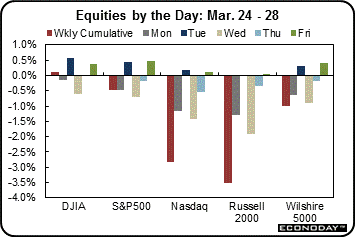 Equities mostly were down for the week—with the Dow barely in positive territory. The week got off to a notably negative start with techs and small caps especially weak. The downdraft came from a larger than expected drop in the Markit PMI for manufacturing (even though the level was still moderately positive). There was some bounce back Tuesday after a better-than-expected number for consumer confidence. Equities mostly were down for the week—with the Dow barely in positive territory. The week got off to a notably negative start with techs and small caps especially weak. The downdraft came from a larger than expected drop in the Markit PMI for manufacturing (even though the level was still moderately positive). There was some bounce back Tuesday after a better-than-expected number for consumer confidence.
 At mid-week, equities declined sharply after President Obama called for greater sanctions and military preparedness in response to Russia's invasion of Ukraine. Traders said that much of the initial action was fast-trading investors buying derivatives as protection against stock market declines. Also, there was profit taking in stocks that were seen as “high flying.” At mid-week, equities declined sharply after President Obama called for greater sanctions and military preparedness in response to Russia's invasion of Ukraine. Traders said that much of the initial action was fast-trading investors buying derivatives as protection against stock market declines. Also, there was profit taking in stocks that were seen as “high flying.”
Equities fell further on Thursday despite a sharp drop in initial unemployment claims. Weakness was led by banks and technology companies. Citigroup led the banking sector down after failing Federal Reserve stress tests. The Fed rejected the bank's plan to buy back $6.4 billion in shares and boost dividends, saying it was not sufficiently prepared to handle a potential financial crisis. The Fed also rejected Zions Bancorp's plan late on Wednesday. On Friday, stocks made a comeback on positive economic news and favorable reports from several major companies. Personal income and spending posted moderately healthy growth rates.
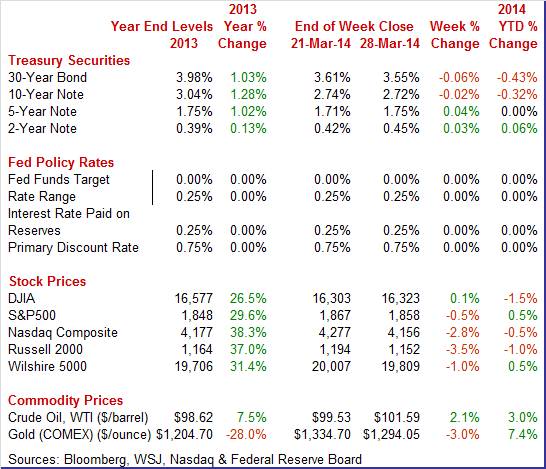
Equities mostly were down this past week. The S&P 500, down 0.5 percent; the Nasdaq, down 2.8 percent; the Russell 2000, down 3.5 percent; and the Wilshire 5000, down 1.0 percent. The Dow was up 0.1 percent.
For the year-to-date, major indexes are mixed as follows: the Dow, down 1.5 percent; the S&P 500, up 0.5 percent; the Nasdaq, down 0.5 percent; the Russell 2000, down 1.0 percent; and the Wilshire 5000, up 0.5 percent.
Weekly percent change column reflects percent changes for all components except interest rates. Interest rate changes are reflected in simple differences.
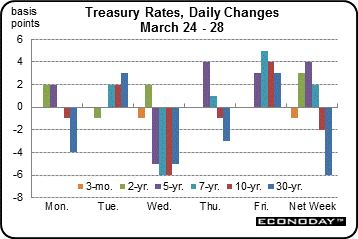 Treasury yields ended the week mixed with most on the short end up while long rates eased. Throughout the week, there was sentiment that the Fed may raise policy rates sooner than earlier believed, putting upward pressure on mid-term yields (those due in more than a year—after when the Fed’s first rate hike is expected—but not long bonds). Treasury yields ended the week mixed with most on the short end up while long rates eased. Throughout the week, there was sentiment that the Fed may raise policy rates sooner than earlier believed, putting upward pressure on mid-term yields (those due in more than a year—after when the Fed’s first rate hike is expected—but not long bonds).
But there were only two notably daily swings. Rates declined Wednesday on a mixed report on durable goods orders. The headline was healthy on a strong transportation component but the core was sluggish. The latter somewhat eased worries about early tightening of policy rates by the Fed. But rates headed back up on Friday after moderately healthy numbers for personal income and spending.
For this past week Treasury rates were mixed as follows: 3-month T-bill, down 1 basis points; the 2-year note, up 3 basis points; the 5-year note, up 4 basis points; the 7-year note, up 2 basis points; the 10-year note, down 2 basis points; and the 30-year bond, down 6 basis points.
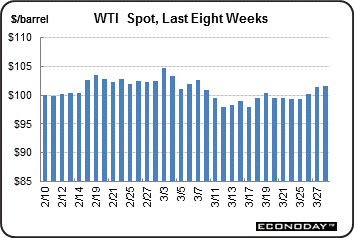 The spot price of West Texas Intermediate rose moderately this past week. The only notable daily swings were gains on Wednesday and Thursday. Crude rose just under a dollar a barrel on Wednesday on news that stockpiles had declined for the eighth week in a row. Inventories have been slipping since the southern link of TransCanada Corp.’s Keystone XL pipeline to refineries on the Texas Gulf Coast from Cushing opened. The spot price of West Texas Intermediate rose moderately this past week. The only notable daily swings were gains on Wednesday and Thursday. Crude rose just under a dollar a barrel on Wednesday on news that stockpiles had declined for the eighth week in a row. Inventories have been slipping since the southern link of TransCanada Corp.’s Keystone XL pipeline to refineries on the Texas Gulf Coast from Cushing opened.
Lower inventories continued to put upward pressure on Cushing prices on Thursday. Also, an unexpectedly strong drop in initial jobless claims helped spot WTI advance a little over a dollar a barrel for the day.
Net for the week, the spot price for West Texas Intermediate gained $2.06 per barrel to settle at $101.59.
First quarter data continue to be soft with mixed results for the consumer, manufacturing, and housing.
The fourth quarter ended up not quite as sluggish as believed last month but growth clearly had softened from the third quarter. Real GDP growth for the fourth quarter was revised up slightly to an annualized 2.6 percent from the second estimate of 2.4 percent and compared to the third quarter’s 4.1 percent. Expectations were for 2.7 percent. The third estimate still was significantly lower than the advance estimate of 3.2 percent.
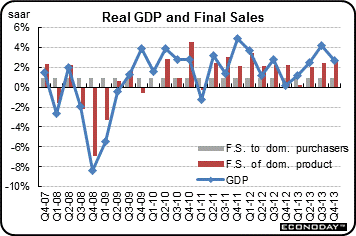
Final sales of domestic product were revised up to 2.7 percent from 2.3 percent for the second estimate and versus 2.5 percent in the third quarter. Final sales to domestic purchases were bumped up to 1.6 percent from the prior estimate of 1.2 percent and compared to 2.3 percent the prior quarter.
By components, upward revisions were seen in PCEs, business equipment, residential investment, inventory investment, and government purchases. Downward revisions were posted for nonresidential structures and intellectual property. Net exports were unrevised overall.
Looking at the components by growth rates instead of direction of revision, the fourth quarter continued to be led by personal consumption, business equipment, and exports. Tugging down on growth were government purchases, residential investment, and nonresidential investment.
The overall price index was unrevised at 1.6 percent annualized. Third quarter growth was 2.0 percent. Core chain prices also were unrevised at 1.9 percent and equaling the third quarter pace.
The picture of the fourth quarter is little changed—it was a soft patch and one that likely will be followed by another in the first quarter—notably due to adverse weather.
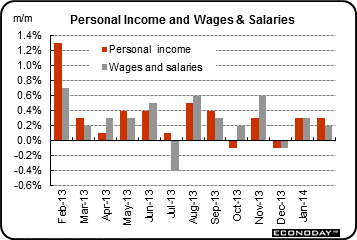 Personal income and spending growth were moderate in February while inflation remained nearly nonexistent. Personal income advanced 0.3 percent, equaling the rise in January. The important wages & salaries component grew 0.2 percent, following a 0.3 percent increase the month before. Personal income and spending growth were moderate in February while inflation remained nearly nonexistent. Personal income advanced 0.3 percent, equaling the rise in January. The important wages & salaries component grew 0.2 percent, following a 0.3 percent increase the month before.
Consumer spending gained 0.3 percent in February after rising 0.2 percent the month before. Durables dipped 0.2 percent in February, following a drop of 0.5 percent the prior month. Nondurables made a partial rebound of 0.3 percent after a drop of 0.9 percent in January. Services slowed to 0.2 percent from a jump of 0.5 percent in January. The large gain in January was led by signups for the Affordable Care Act.
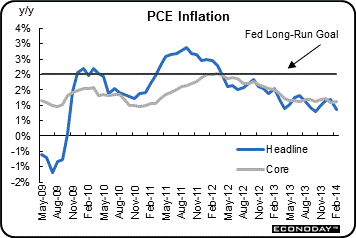 On a year ago basis, headline inflation was 0.9 percent in February versus 1.2 percent the month before. Core inflation on a year-ago basis held steady at 1.1 percent. The very low inflation rates will give ammunition to those within the Fed arguing for continued loose monetary policy. On a year ago basis, headline inflation was 0.9 percent in February versus 1.2 percent the month before. Core inflation on a year-ago basis held steady at 1.1 percent. The very low inflation rates will give ammunition to those within the Fed arguing for continued loose monetary policy.
The consumer sector is moderately healthy in terms of income and spending although there has been some monthly volatility in the numbers over the last six months. On the spending side, durables have been weak with adverse weather likely cutting into auto sales. Weather also likely has weighed on income growth. Given the headwinds, the consumer sector is in decent shape, ready for improvement in the second quarter.
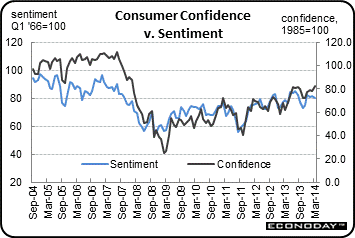 Consumer confidence may be pointing to a little bit of building momentum, rising to 82.3 this month versus a revised 78.3 in February and compared against the Econoday consensus for 78.4. The gain was led by strong showings in two subcomponents, expectations for future business conditions and, importantly, expectations for future employment. Consumer confidence may be pointing to a little bit of building momentum, rising to 82.3 this month versus a revised 78.3 in February and compared against the Econoday consensus for 78.4. The gain was led by strong showings in two subcomponents, expectations for future business conditions and, importantly, expectations for future employment.
But the assessment of current conditions actually was down a bit this month including the very closely watched jobs-hard-to-get subcomponent which rose 6 tenths to 33.0 percent. This reading is still near recovery lows though it's not pointing to improvement for the March employment report.
Turning to the Reuters/University of Michigan report, consumer sentiment held steady the last two weeks of March at a moderate level, putting the full month figure at 80.0 versus a mid-month reading of 79.9 and versus a final February reading of 81.6. Details in the month-to-month comparison with February are mixed, showing no significant change for current conditions, at 95.7 versus 95.4, but a little weakness for expectations, at 70.0 versus 72.7. The decline in expectations may reflect disappointment over the jobs outlook. Inflation expectations, despite the rise underway in gasoline prices, are unchanged, at 3.2 percent for the 1-year outlook and at 2.9 percent for the 5-year outlook.
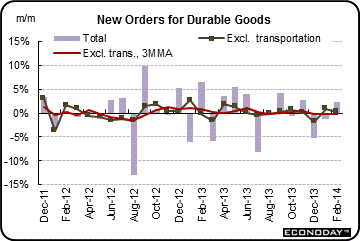 Signals for the manufacturing sector continue to be difficult to read. Momentum appears to swing back and forth according to durables orders, leaving the trend essentially flat. Signals for the manufacturing sector continue to be difficult to read. Momentum appears to swing back and forth according to durables orders, leaving the trend essentially flat.
The latest durables orders report was mixed with the headline strong and the core slowing. New factory orders for durables in February rebounded 2.2 percent, following a decrease of 1.3 percent in January. But excluding transportation, durables orders slowed to a 0.2 percent rise in February, following a 0.9 percent boost the prior month.
The transportation component jumped a monthly 6.9 percent after dropping 6.2 percent the month before. Within transportation, the gain was led by increases in orders for defense aircraft although nondefense aircraft and motor vehicles also were strong.
 Outside of transportation, orders were up slightly but very mixed by subcomponents. Outside of transportation, orders were up slightly but very mixed by subcomponents.
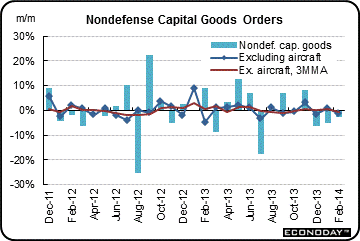
There was slippage in investment plans. Nondefense capital goods orders excluding aircraft decreased 1.3 percent in February, following a rebound of 0.8 percent the month before. Shipments for this series advanced 0.5 percent, following a 1.4 percent drop in January.
The latest durables report suggests that manufacturing is not as strong as indicated by recent manufacturing surveys.
Manufacturing growth in March is solid based on Markit's PMI flash which was 55.5, down from unusually high readings of 57.1 for final February and 56.7 in the mid-month reading for February. Unlike February which got a boost from an easy comparison with the severe cold of January, March was held down by a difficult comparison with February.
But the readings for March were nevertheless strong led by the most important component which is new orders, at 58.0. Domestic orders were the center of strength as growth in export orders was only marginal, at 51.0. The build in backlog orders slowed but was still solid at 54.8.
Output was steady and strong at 57.5 while employment growth remains moderate at 53.9. Price readings show only marginal upward pressure. Inventory readings are steady.
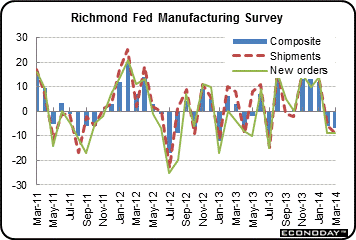 Recent regional manufacturing numbers were mixed for March with the Richmond Fed showing worsening while those from the Kansas City Fed positive and improving. Recent regional manufacturing numbers were mixed for March with the Richmond Fed showing worsening while those from the Kansas City Fed positive and improving.
The Richmond Fed composite index slipped further into negative territory to minus 7 from February's minus 6. New orders were at minus 9 for a second straight month with backlog orders at minus 13, down from minus 8 last month. Shipments were at minus 9 with capacity utilization at minus 14. Employment is at zero.
Weakness in this report underscores the unevenness in the manufacturing sector by region as activity on the national level appears to be moving forward, at least for the most part.
Growth in manufacturing activity in the Kansas City Fed District increased in March, and producers' expectations were mostly stable at solid levels. The report partly attributed improved activity to better weather conditions.
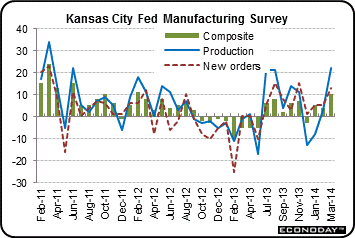 The month-over-month composite index was 10 in March, up from 4 in February and 5 in January. The composite index is an average of the production, new orders, employment, supplier delivery time, and raw materials inventory indexes. The production index jumped from 3 to 22, its highest level in 3 years, and the shipments and new orders indexes also climbed higher. The order backlog index edged up from minus 4 to minus 1, and the new orders for exports index also increased slightly. The month-over-month composite index was 10 in March, up from 4 in February and 5 in January. The composite index is an average of the production, new orders, employment, supplier delivery time, and raw materials inventory indexes. The production index jumped from 3 to 22, its highest level in 3 years, and the shipments and new orders indexes also climbed higher. The order backlog index edged up from minus 4 to minus 1, and the new orders for exports index also increased slightly.
Most price indexes increased slightly in March. The month-over-month finished goods price index edged up from 7 to 10, while the raw materials price index was unchanged. Many firms cited difficulties finding qualified workers with some additional pressure on wages.
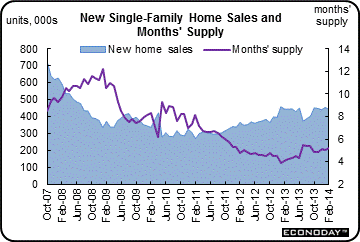 New home sales in February could not match the strong pace of January, coming in at an annual rate of 440,000 versus a revised 455,000 in January. But the slowing helped give supply a boost, to 5.2 months at February's sales pace vs 5.0 months in January. Supply has been thin in the housing market which has been a major factor holding down sales. Total new homes on the market increased slightly in the month and, at 189,000, are at their highest level since December 2010. New home sales in February could not match the strong pace of January, coming in at an annual rate of 440,000 versus a revised 455,000 in January. But the slowing helped give supply a boost, to 5.2 months at February's sales pace vs 5.0 months in January. Supply has been thin in the housing market which has been a major factor holding down sales. Total new homes on the market increased slightly in the month and, at 189,000, are at their highest level since December 2010.
Regional data in this report are dominated by the South which far exceeds all other regions combined. Sales in the South slipped 1.5 percent in the month versus a 1.1 percent decline for total sales.
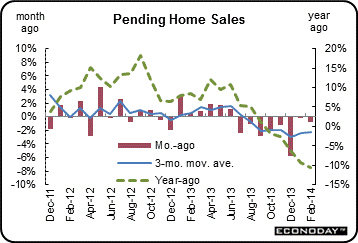 Existing home sales may improve in the spring but they weren't showing any momentum going into March. Pending home sales fell 0.8 percent in February and, in another negative, were revised down to minus 0.2 percent in January which at first had shown a small gain. Pending home sales have now fallen for 9 straight months. Existing home sales may improve in the spring but they weren't showing any momentum going into March. Pending home sales fell 0.8 percent in February and, in another negative, were revised down to minus 0.2 percent in January which at first had shown a small gain. Pending home sales have now fallen for 9 straight months.
Regional data are mixed with the Midwest and West showing gains but the Northeast showing a decline and with the South showing the sharpest decline, of 4.0 percent.
Weather in February was heavy through much of the country, a factor that no doubt held back traffic of potential homebuyers and sales activity in housing. With less favorable mortgage rates, the result of the Fed's tapering program, the housing sector is expected to show less strength this year than last year.
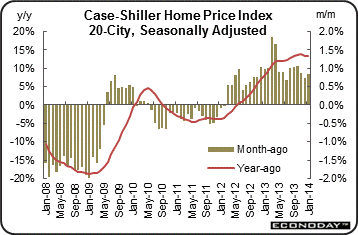 Home prices were still going up at the beginning of the year and at a healthy pace but not quite as much as earlier. Case-Shiller's adjusted monthly sales gain for January was quite strong, at plus 0.8 percent, but the year-on-year rate, at plus 13.3 percent, is down 1 tenth from December. But gains are nevertheless convincing with all 20 cities in the plus column led by the West coast and including big gains in Florida and several Midwest and Northeast cities including Minneapolis, Washington DC and New York city. Home prices were still going up at the beginning of the year and at a healthy pace but not quite as much as earlier. Case-Shiller's adjusted monthly sales gain for January was quite strong, at plus 0.8 percent, but the year-on-year rate, at plus 13.3 percent, is down 1 tenth from December. But gains are nevertheless convincing with all 20 cities in the plus column led by the West coast and including big gains in Florida and several Midwest and Northeast cities including Minneapolis, Washington DC and New York city.
Home price appreciation is strong.
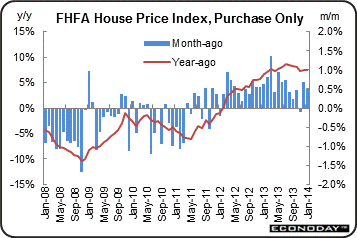 Home prices continue on a moderate uptrend. According to the FHFA, home prices gained 0.5 percent in January on a seasonally adjusted basis, following a 0.7 percent rise the month before. Home prices continue on a moderate uptrend. According to the FHFA, home prices gained 0.5 percent in January on a seasonally adjusted basis, following a 0.7 percent rise the month before.
Eight of nine Census regions showed gains in the latest month while one declined. The largest regional increase was in the Middle Atlantic Census Division. The West South Central dipped 0.3 percent.
The year-on-year rate for posted at 7.4 percent, following 7.5 percent in December.
Upward pressure on home prices actually has improved according to Case-Shiller and FHFA. January and December were healthy and positive. Higher prices could actually help the housing market. More supply will come to market and buyers may stop postponing purchases.
In a weather-related bounce, the flash services PMI for March rose to 55.5 versus a final 53.3 for February and February's flash reading of 52.7. The gain indicates a sizable increase in the rate of monthly growth for business activity.
Other readings in the report were not as strong. Growth in new business slowed to 53.9 from a final 56.0 in February, while outstanding business actually moved into contraction at 48.3 from 50.9. Employment remains very subdued, unchanged at 51.9. Price readings show little change for inputs but some strength for prices charged. A plus in the report is a nearly 5 point rise in business expectations to a very strong 78.1.
The unusually heavy weather of February made for a rough month for many economic indicators including the ISM's non-manufacturing report which, like this report, slowed substantially. But March flash PMI services point to some strength for March and perhaps to building momentum for the spring.
The first quarter data are still reflecting the impact of adverse weather. Given this, the numbers are not so bad. The consumer is getting moderate income gains while spending is somewhat positive. Manufacturing reports are mixed but weather likely is a factor in some regions. Housing sales have slipped but prices are continuing an uptrend. The economy may be poised for improvement in the second quarter.
The highlight is Friday’s employment report. Forecasts are a little stronger this month as traders are a little more upbeat after recent improvement in jobless claims. Investors will be watching motor vehicle sales for March to see if there is any post-adverse-weather bounce in sales. Recently, manufacturing has been mixed and we get updates from ISM manufacturing and final Markit PMI for March.
The Chicago PMI for February indicated that February's heavy weather didn't slow down the Chicago economy where the composite business index edged 0.2 points higher to 59.8. Details of the report, where subscribers are given special access, were sketchy but included a huge 10.1 point spike in employment to 59.3. This index had fallen 11.1 points in the two prior months. Exact numbers were not available for other readings though new orders and production are described as hovering in the 60 area.
Chicago PMI Consensus Forecast for March 14: 59.0
Range: 57.2 to 60.6
The Dallas Fed general business activity indicated perceptions of softness in manufacturing in February as this index fell to 0.3 after eight positive readings in a row. The company outlook index also declined, from 15.9 to 3.4 in February, hitting its lowest reading since last spring. Nonetheless, Texas factory activity increased for the 10th month in a row in February. The Dallas Fed’s production index rose from 7.1 to 10.8, indicating output grew at a slightly stronger pace than in January. The new orders index continued to indicate demand growth and was 9.5, down from 14.4 in January but above the levels seen toward the end of last year.
Dallas Fed general business activity index Consensus Forecast for March 14: 3.0
Range: 2.0 to 7.2
Sales of total light motor vehicles for February remained at a solid level but continued to show little month-to-month strength, at a 15.3 million annual rate in February versus 15.2 million and 15.4 million in the prior two months. Since September, sales have averaged a 15.5 million pace.
Motor vehicle domestic sales Consensus Forecast for March 14: 12.4 million-unit rate
Range: 12.3 to 12.8 million-unit rate
Motor vehicle total sales Consensus Forecast for March 14: 15.8 million-unit rate
Range: 15.5 to 16.0 million-unit rate
The Markit PMI manufacturing flash index suggested that manufacturing growth in early March was solid, based on Markit's PMI flash which was 55.5, down from unusually high readings of 57.1 for final February and 56.7 in the mid-month reading for February. Unlike February which got a boost from an easy comparison with the severe cold of January, March was held down by a difficult comparison with February. But the readings for March were nevertheless strong led by the most important component which is new orders, at 58.0. Domestic orders were the center of strength as growth in export orders was only marginal, at 51.0. The build in backlog orders slowed but was still solid at 54.8.
Markit PMI manufacturing index (final) Consensus Forecast for March 14: 56.8
Range: 56.2 to 57.6
The composite index from the ISM manufacturing survey for February was weighed down by weather effects. But the composite index did bounce a modest 1.9 points higher in February to a higher-than-expected 53.2 from a very weather-depressed January reading of 51.3. Shipping snags appear to have slowed production which fell a very sharp 6.6 points to a contractionary 48.2. Supplier deliveries slowed sharply, up 4.2 points to 58.5 which is the slowest reading since April 2011. Order readings showed less weather effect and were positive. New orders rose 3.3 points to a respectable 54.5 while new export orders came in at 53.5, to show only a little less monthly growth compared to January's 54.5. Backlog orders jumped back to the growth column, up 4.0 points to 52.0.
ISM manufacturing composite index Consensus Forecast for March 14: 54.0
Range: 51.5 to 54.7
Construction spending in January gained 0.1 percent, following a jump of 1.5 percent the month before. But strength was in housing. Private residential outlays increased 1.1 percent after a 2.6 percent boost the month before. New one-family outlays advanced 2.3 percent in January after rising 3.4 percent in December. Private nonresidential spending dipped 0.2 percent, following a 1.2 percent increase in December. Public outlays fell 0.8 percent in January, following a 0.4 percent rise in December.
Construction spending Consensus Forecast for February 14: +0.1 percent
Range: -0.5 to +0.9 percent
ADP private payroll employment was up 139,000 in February. This compares to the later released BLS private payroll gain for February of 162,000 seen in the employment situation.
ADP private payrolls Consensus Forecast for March 14: 193,000
Range: 150,000 to 220,000
Factory orders in January were weighed down by frigid weather as orders fell 0.7 percent following a downwardly revised 2.0 percent decline in December. Also revised lower was the ex-transportation reading for January, to a slim plus 0.2 percent versus an initial reading of plus 1.1 percent. Non-durables were the new data in January's report which showed a 0.4 percent decline on weakness in chemical products. More recently, new factory orders for durables in February rebounded 2.2 percent, following a revised decrease of 1.3 percent in January.
Factory orders Consensus Forecast for February 14: +1.2 percent
Range: +0.6 to +1.5 percent
The U.S. international trade gap posted at $39.1 billion in January versus $39.0 billion in December. Exports rose a respectable $1.2 billion, offset by a slightly higher rise in imports of $1.3 billion. Exports rebounded 0.6 percent after falling 1.6 percent in December. Imports increased 0.6 percent in January, following a 0.2 percent increase the month before. Industrial supplies drove the increases on both sides of the ledger. The petroleum deficit widened to $19.3 billion from $15.5 billion while the non-petroleum goods gap narrowed to $39.2 billion from $41.9 billion. The services surplus rose to $20.2 billion from $19.7 billion.
International trade balance Consensus Forecast for February 13: -$38.8 billion
Range: -$41.0 billion to -$35.0 billion
Initial jobless claims continue to come down signaling improvement in the labor market. Initial claims fell 10,000 in the March 22 week to 311,000. The 4-week average was down a very sharp 9,500 to 317,750 which is the lowest level in 6 months. Continuing claims are also coming down, down 53,000 in data for the March 15 week. The 4-week average was down 31,000 to 2.863 million which was the lowest level in 3 months.
Jobless Claims Consensus Forecast for 3/29/14: 320,000
Range: 315,000 to 335,000
The Markit PMI services flash index for March rose to 55.5 versus a final 53.3 for February and February's flash reading of 52.7. The gain indicates a sizable increase in the rate of monthly growth for business activity. Other readings in the report were not as strong. Growth in new business slowed to 53.9 from a final 56.0 in February, while outstanding business actually moved into contraction at 48.3 from 50.9. Employment remains very subdued, unchanged at 51.9. Price readings show little change for inputs but some strength for prices charged. A plus in the report is a nearly 5 point rise in business expectations to a very strong 78.1.
Markit PMI services index (final) Consensus Forecast for March 14: 53.9
Range: 53.3 to 56.5
The composite index from the ISM non-manufacturing survey broke substantially lower in the heavy weather of February, with the composite index down 2.4 points to a 51.6 reading that indicates the lowest rate of monthly growth since February 2010. But there was a slight positive in the report and that was improvement in new orders, up 4 tenths to 51.3 to indicate a slightly higher rate of monthly growth. New orders had been very flat in the two prior reports.
ISM non-manufacturing composite index Consensus Forecast for March 14: 53.3
Range: 52.0 to 55.0
Nonfarm payroll employment gained 175,000 in February after a 129,000 rise in January and an 84,000 increase in December. The net revision for the prior two months was up 25,000. The BLS did note that atypically severe winter weather occurred during the payroll reference period. While not specifically stating, the implication is that the labor market is somewhat stronger than the official payroll number for February. The unemployment rate nudged up to 6.7 percent in February from 6.6 percent the month before. Average weekly hours slipped to 34.2 from 34.3 in January. This dip almost certainly was weather related. A big plus in the report for February was a jump in average hourly earnings growth to 0.4 percent from 0.2 percent the prior month.
Nonfarm payrolls Consensus Forecast for March 14: 206,000
Range: 175,000 to 275,000
Private payrolls Consensus Forecast for March 14: 215,000
Range: 175,000 to 270,000
Unemployment rate Consensus Forecast for March 14: 6.6 percent
Range: 6.6 to 6.7 percent
Average workweek Consensus Forecast for March 14: 34.4 hours
Range: 34.3 to 34.5 hours
Average hourly earnings Consensus Forecast for March 14: +0.2 percent
Range: 0.0 to +0.4 percent
R. Mark Rogers is the author of The Complete Idiot’s Guide to Economic Indicators, Penguin Books.
He can also be found on a weekly broadcast talking about the U.S. economy, the easiest way to find him is by going to iTunes and searching for "Simply Economics."
Econoday Senior Writer Mark Pender contributed to this article.
|
