|
This past week, investors became more nervous about some stocks being overpriced and the overall investment environment. This was despite recent news about continued Fed ease and mostly positive—albeit mostly moderate—economic data.
 Equities fell very sharply this past week. Technology shares sold off as being seen as overpriced “momentum” stocks and investors moved into defensive positions—either in equities or fixed income. Internet stocks were also seen as in the momentum category and declined. Most equities partially rebounded Tuesday on bottom fishing for techs and others. The rise was modest as many investors continued to worry about earnings season which many believe will be held back for the first quarter due to adverse weather. Equities fell very sharply this past week. Technology shares sold off as being seen as overpriced “momentum” stocks and investors moved into defensive positions—either in equities or fixed income. Internet stocks were also seen as in the momentum category and declined. Most equities partially rebounded Tuesday on bottom fishing for techs and others. The rise was modest as many investors continued to worry about earnings season which many believe will be held back for the first quarter due to adverse weather.
 Equities rallied on Wednesday after FOMC minutes revealed a more dovish stance than expected. The minutes indicated that interest rates would not increase as soon as market participants were expecting. There was no indication of a firm timetable for the start of interest rate increases either. The S&P 500 posted its biggest one day gain since March 4. Equities rallied on Wednesday after FOMC minutes revealed a more dovish stance than expected. The minutes indicated that interest rates would not increase as soon as market participants were expecting. There was no indication of a firm timetable for the start of interest rate increases either. The S&P 500 posted its biggest one day gain since March 4.
But stocks engaged in a huge selloff Thursday despite a huge drop in initial jobless claims. The Nasdaq fell the most for one day since 2011 as worries about earnings continued. Tech losses continued to lead equities down Friday. This was despite an unexpected rise in consumer sentiment. However, a surprise gain in producer prices made traders nervous about Fed policy.
Equities were down this past week. The Dow was down 2.4 percent; the S&P 500, down 2.6 percent; the Nasdaq, down 3.1 percent; the Russell 2000, down 3.6 percent; and the Wilshire 5000, down 4.2 percent.
For the year-to-date, major indexes are down as follows: the Dow, down 3.3 percent; the S&P 500, down 1.8 percent; the Nasdaq, down 4.2 percent; the Russell 2000, down 4.5 percent; and the Wilshire 5000, down 2.0 percent.
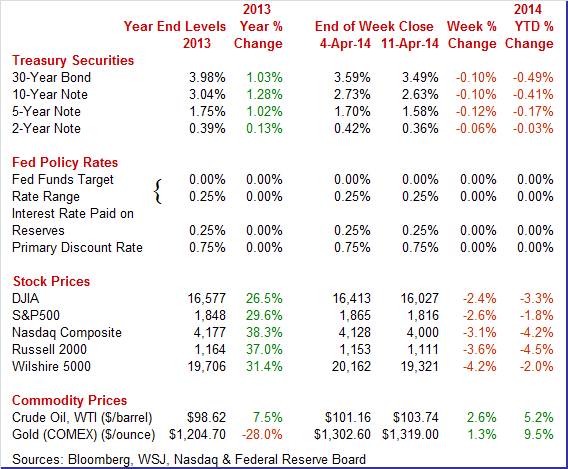
Weekly percent change column reflects percent changes for all components except interest rates. Interest rate changes are reflected in simple differences.
 Treasury yields trod downward all week. Flight to safety was the basic driver. Also, less worry about early Fed tightening also came into play. Treasury yields trod downward all week. Flight to safety was the basic driver. Also, less worry about early Fed tightening also came into play.
The first three days of trading were relatively quiet but the trend clearly was downward but slowly for Treasury yields. Favorable Fed comments continued to weigh on yields and the seizing of government headquarters in two Eastern Ukraine cities by antigovernment protesters wanting closer ties to Russia added to flight to safety. On Tuesday, a speech by Fed Bank of Minneapolis President Narayana Kocherlakota helped to ease rates. He stated that the Fed should consider more ways to boost the economy. This was consistent with his dissent in the March 19 FOMC statement in which he stated that the Fed should do more to lift inflation to its 2 percent inflation target.
At mid-week, the release of Fed minutes of the March 18-19 FOMC meeting indicated that the Fed was somewhat more dovish than believed, weighing on rates. Thursday showed the largest drop in yields as money moved to safety as stocks were being routed. This was despite a huge drop in initial jobless claims. Rates edged further down Friday on the view that the Fed would continue very loose monetary policy. This sentiment stood even though a higher than expected PPI was a little offsetting.
For this past week Treasury rates were down as follows: the 2-year note, down 6 basis points; the 5-year note, down 12 basis points; the 7-year note, down 13 basis points; the 10-year note, down 10 basis points; and the 30-year bond, down 10 basis points. The 3-month T-bill was unchanged.
 Oil prices jumped sharply this past week. At the start of the week, tensions in eastern Ukraine sent the spot price of West Texas Intermediate up a sharp $4.81 per barrel. Pro-Russian activists declared independence in Donetsk. Traders also worried about declining gasoline supplies. Oil prices jumped sharply this past week. At the start of the week, tensions in eastern Ukraine sent the spot price of West Texas Intermediate up a sharp $4.81 per barrel. Pro-Russian activists declared independence in Donetsk. Traders also worried about declining gasoline supplies.
On Tuesday, crude rose somewhat over a buck and a half a barrel—again on speculation that supply had declined.
The rest of the week, prices were little changed. However, on Wednesday, the actual government report of an inventory decline offset perceived weakness in the Chinese market.
Net for the week, the spot price for West Texas Intermediate jumped a sharp $6.17 per barrel to settle at $107.33.
The Fed is staying loose and the consumer sector is warming up somewhat (net) with the onset of spring.
FOMC policy is likely to be loose for years according to the FOMC minutes released for the March 18-19 Fed policy meeting. The minutes indicate that measured taper is still on.
Regarding the economy, most FOMC participants saw a pickup in GDP growth after first quarter bad weather. Still, staff economists saw non-weather factors weighing down growth.
On rates, two FOMC members stated that the fed funds rate should remain low if inflation remains below the 2 percent target.
A key issue was debate about changes to guidance. Most participants also believed that it would be appropriate for the FOMC to provide additional guidance in its post-meeting statement regarding the likely direction of the federal funds rate after its first increase.
Bottom lines: taper is still on as scheduled unless extraordinary data are up or down, low policy rates for a considerable time after the end of taper, changes to guidance are likely, and expectations are that the economy will improve. Worries remain about inflation being too low.
 There were 4.173 million job openings on the last business day of February, up from January at 3.874 million. The hires rate (3.3 percent) and separations rate (3.2 percent) were unchanged in February. There were 4.173 million job openings on the last business day of February, up from January at 3.874 million. The hires rate (3.3 percent) and separations rate (3.2 percent) were unchanged in February.
The number of openings rose for total private and was little changed for government.
There were 4.587 million hires in February, compared to 4.516 million in January. Over the 12 months ending in February, the number of hires (not seasonally adjusted) changed little for total nonfarm, total private, and government.
There were 4.419 million total separations (quits, layoffs and discharges) in February, little changed from January at 4.419 million. The number of total separations was essentially unchanged for total private and government.
In February, the quits rate was unchanged at 1.7 percent for total nonfarm. The rate also was unchanged for total private (1.9 percent) and government (0.6 percent).
Overall, the JOLTS report indicates modest gains in job openings. Hires are edging upward but slowly. Separations are oscillating and some of the movement is favorable (switching jobs to advance) while some is not (positions terminated). Fed Chair Yellen notes attention to this report and it is modestly positive at best. This report likely will lend toward the doves at the Fed to keep rates low and to not accelerate taper.
 While most indicators of the consumer sector show moderate upward traction, that is not the case for consumer credit despite a good headline number for February. While most indicators of the consumer sector show moderate upward traction, that is not the case for consumer credit despite a good headline number for February.
Consumer credit rose a sharp $16.5 billion in February but the revolving component, where credit cards are tracked, continues to be very soft, down $2.4 billion in the month. Strength once again is entirely in the non-revolving component, up $18.9 billion and reflecting demand for car loans as well as the government's acquisition of student loans. The consumer, still hesitant to use credit cards, has not been a leading force for the economy with expanded credit. Spending is up somewhat but not based upon increased use of credit outside of the auto sector.
 Maybe the hoped for spring weather effect on the economy is actually taking place. The weather is warming, getting closer to normal seasonal patterns, and consumer sentiment is up, at 82.6 for mid-April versus 80.0 in final March and versus 79.9 for mid-March. The reading is the highest since July last year. Maybe the hoped for spring weather effect on the economy is actually taking place. The weather is warming, getting closer to normal seasonal patterns, and consumer sentiment is up, at 82.6 for mid-April versus 80.0 in final March and versus 79.9 for mid-March. The reading is the highest since July last year.
Both components are up with expectations at 73.3 versus a final March reading of 70.0 and current conditions at 97.1 versus 95.7. The gain for expectations points to rising confidence in job and income prospects while the rise in current conditions offers an early hint of month-to-month consumer strength for April.
 Inflation is back in the headlines. The PPI for total final demand jumped 0.5 percent in March, well above the Econoday consensus for a gain of 0.1 percent. The reading for February was minus 0.1 percent. Inflation is back in the headlines. The PPI for total final demand jumped 0.5 percent in March, well above the Econoday consensus for a gain of 0.1 percent. The reading for February was minus 0.1 percent.
Total final demand excluding food & energy rose even more, up 0.6 percent after falling 0.2 percent the month before. The consensus called for a 0.2 percent increase. Total final demand excluding food, energy, and trade services rose 0.3 percent versus a 0.1 percent gain in February.
 Year-on-year, PPI final demand rose an unadjusted 1.4 percent in March. Final demand excluding food & energy was also up a year-on-year 1.4 percent. Year-on-year, PPI final demand rose an unadjusted 1.4 percent in March. Final demand excluding food & energy was also up a year-on-year 1.4 percent.
Details include a sharp 0.7 percent monthly gain in services prices, more than reversing the prior month's 0.3 percent decline. Final demand food prices rose very sharply, up 1.1 percent in March following a 0.6 percent increase in February.
Price data are suddenly showing some life, including this report and yesterday's import & export price report. The absence of inflation pressures has been a concern among policy makers.
While traders are nervous about first quarter profits weighing on equities, the economy is slowly improving—especially with continued Fed ease. While the data are a little mixed, the consumer sector is regaining momentum somewhat. The latest PPI report grabbed attention but a key question this coming week is whether price pressure shows up at the consumer level—notably the core. Overall, the economy may not be as scary as indicated by this past week’s stock selloff. However, it still is not where most want it to be either—notably by most within the Fed.
Even though there is a moderate schedule of economic events, the news may be quite significant after last week’s sell-off in equities. We get more data on if a spring rebound is underway after atypically adverse winter weather. Traders will look to see if consumers went shopping during the March’s warmer weather. Inflation was unexpectedly strong for the March PPI and a big question is whether it will show up in March consumer price inflation. Housing permits spiked in February but will that carry over into starts for March' Finally, manufacturing was healthier than expected in February—will the uptrend continue'
Retail sales made a comeback in February but January was weaker than initially estimated. Weather was still a factor. Retail sales rebounded 0.3 percent in February after declining 0.6 percent in January (originally down 0.4 percent). Motor vehicle sales added lift, increasing 0.3 percent, following a 2.2 percent drop in January. Excluding motor vehicles, sales gained 0.3 percent after falling 0.3 percent in January. Gasoline sales were up only a marginal 0.1 percent after a 1.0 percent jump the month before. Retail sales excluding autos and gasoline increased 0.3 percent after declining 0.5 percent in January.
Retail sales Consensus Forecast for March 14: +1.0 percent
Range: +0.5 to +1.5 percent
Retail sales excluding motor vehicles Consensus Forecast for March 14: +0.5 percent
Range: +0.2 to +1.0 percent
Less motor vehicles & gasoline Consensus Forecast for March 14: +0.5 percent
Range: +0.1 to +1.2 percent
Business inventories were already heavy going into the severe weather of January which appears to have backed up inventories even further. Business inventories rose 0.4 percent in the month versus a steep 0.6 percent decline for business sales, which is the sharpest decline since June 2012. The mismatch raises the stock-to-sales ratio two notches, from 1.30 to 1.32 which is the heaviest reading of the whole recovery.
Business inventories Consensus Forecast for February 14: +0.6 percent
Range: +0.3 to +0.7 percent
The consumer price index remained quite soft in February at the headline and core levels. Headline inflation posted at 0.1 percent, matching the pace in January. Similarly, the CPI excluding food and energy inflation rate held steady at 0.1 percent, equaling the January pace. The energy component declined 0.5 percent after increasing 0.6 percent in January. Gasoline fell 1.7 percent in February, following a decline of 1.0 percent the month before. Food price inflation, however, jumped to 0.4 percent after nudging up 0.1 percent in January. However, unexpectedly strong PPI numbers for March likely raised projections for the CPI. The PPI for total final demand jumped 0.5 percent in March, well above the Econoday consensus for a gain of 0.1 percent. Total final demand excluding food & energy rose even more, up 0.6 percent after falling 0.2 percent the month before.
CPI Consensus Forecast for March 14 +0.1 percent
Range: 0.0 to +0.3 percent
CPI ex food & energy Consensus Forecast for March 14: +0.1 percent
Range: +0.1 to +0.2 percent
The Empire State manufacturing index was up slightly in March to 5.61 from 4.48 in February. New orders also showed a slight increase, to 3.13 versus last month's slightly contractionary reading of minus 0.21, as do shipments, at 3.97 versus 2.13. Growth in the sample's employment reading slowed, to 5.88 from 11.25.
Empire State Manufacturing Survey Consensus Forecast for April 14: 7.50
Range: 3.50 to 10.00
NAHB housing market index for March failed to bounce back much from February's record loss, coming in at a lower-than-expected 47 for only a 1 point gain. Details for March once again showed serious weakness in traffic, at 33 versus February's 31. Weakness in traffic points to a lack of first-time buyers and underscores the continued importance of all cash buyers in the housing market. Other details are on the plus side of 50 to indicate monthly growth but just barely, at 52 for current sales and 53 for future sales.
NAHB housing market index Consensus Forecast for April 14: 49
Range: 49 to 53
The Housing starts report indicates that homebuilders are focusing more on multifamily housing and plan increased construction in this sector. Housing starts came in much as expected for February but permits topped the consensus forecast. Overall starts nudged down 0.2 percent to a 907,000 annual rate from an upwardly revised 909,000 rate for January which followed a downwardly revised December number of 1.024 million. January and December previously were 880,000 and 1.048 million, respectively. Single-family starts rose 0.3 percent after a 13.2 percent plunge in January. Multifamily starts dipped 1.2 percent in February after a 7.6 percent decline the month before. But February’s permit numbers showed improved optimism by homebuilders. Overall permits jumped 7.7 percent to a 1.018 million unit pace after decreasing 4.6 percent in January. The increase was largely from a 24.3 percent spike in multifamily units while single-family permits eased 1.8 percent in both February and January.
Housing starts Consensus Forecast for March 14: 0.965 million-unit rate
Range: 0.910 million to 1.030 million-unit rate
Housing permits Consensus Forecast for March 14: 1.010 million-unit rate
Range: 0.960 million to 1.075 million-unit rate
Industrial production was held back by adverse weather in January but not in February as output rebounded in the latest data. Industrial production was unexpectedly strong in February even though utilities actually tugged down on the latest number. Industrial production rebounded 0.6 percent after dipping 0.2 percent in January. By major components, manufacturing jumped 0.8 percent in February, following a 0.9 percent drop the month before. Mining rose 0.3 percent, following a 0.5 percent boost in January. Utilities slipped 0.2 percent after a 3.8 percent surge the prior month. Capacity utilization improved to 78.8 percent from 78.5 percent in January. Expectations were for 78.6 percent.
Industrial production Consensus Forecast for March 14: +0.4 percent
Range: 0.0 to +0.9 percent
Manufacturing production component Consensus Forecast for March 14: +0.5 percent
Range: 0.0 to +0.7 percent
Capacity utilization Consensus Forecast for March 14: 78.7 percent
Range: 78.5 to 79.1 percent
The Beige Book being prepared for the April 29-30 FOMC meeting is being released. Most FOMC participants have indicated that taper will continue at a measured pace unless data noticeably diverge from forecasts. Traders will look for signs of increased weakness or increased strength in the economy that could change the pace of taper. Recently high producer price data may increase market sensitivity to Beige Book comments on inflation and business costs.
Initial jobless claims for the April 5 week fell a stunning 32,000 drop to 300,000 in initial jobless claims for the April 5 week. However, Easter can play havoc with economic data in surrounding weeks and this may be the case. This was the largest drop in more than 10 years and, though the Labor Department says there are no special factors involved, this may not be true due to seasonal adjustments as Easter last year fell on March 31. But it is hard to get around improvement in this report. The 4-week average was down 4,750 to 316,250 which was more than 15,000 below the month-ago reading and which points to tangible improvement in the jobs market.
Jobless Claims Consensus Forecast for 4/12/14: 312,000
Range: 305,000 to 325,000
The general business conditions index of the Philadelphia Fed's Business Outlook Survey was much less severe in March than February's weather. The Philly Fed index moved solidly into positive ground at 9.0 versus February's minus 6.3. Details showed wide improvement in the month including new orders, at 5.7 versus minus 5.2, unfilled orders, at 2.6 versus minus 2.6, and shipments, at 5.7 versus minus 9.9.
Philadelphia Fed survey Consensus Forecast for April 14: 10.0
Range: 3.0 to 14.0
SIFMA Recommended Early Close 2:00 ET
Good Friday. Markets Closed. Banks Open.
The Conference Board's index of leading indicators continues to confirm that the Fed’s optimism about the economy may be correct. Financial measures were mostly behind a large 0.5 percent rise in the index for February. The yield spread was once again the largest positive factor, as it has been throughout the recovery. The report's credit index was also a major positive factor, one that continues to point to improvement in lending. But there was one other major positive in this report and that was building permits where improvement tangibly points to economic strength. Negatives, however, swept 5 of the 10 components, including those for the factory workweek and consumer expectations.
Leading indicators Consensus Forecast for March 14: +0.5 percent
Range: +0.2 to +0.8 percent
R. Mark Rogers is the author of The Complete Idiot’s Guide to Economic Indicators, Penguin Books.
He can also be found on a weekly broadcast talking about the U.S. economy, the easiest way to find him is by going to iTunes and searching for "Simply Economics."
Econoday Senior Writer Mark Pender contributed to this article.
|
