|
Traders had a lot of information to digest this week. Earnings season was underway. Economic news was mixed for housing but positive for manufacturing. Fed worries about taper continued. And tensions over Ukraine were off and on.
Equities got off to a modestly positive start on Monday as traders awaited earnings and as the index of leading indicators came in slightly higher than estimates. After market close, Netflix reported quarterly earnings that topped expectations. Tuesday saw substantial gains on earnings news, a strong FHFA house price number, Richmond Fed rebounding, and existing home sales meeting expectations. Health care stocks were particularly strong in addition to Netflix.
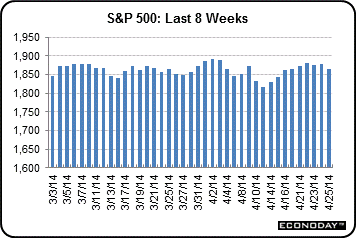 At mid-week, stocks were mostly lower on disappointing Chinese and U.S. economic data. Earnings also weighed on stocks. New home sales for March surprised and declined 14.5% to a seasonally adjusted annual rate of 384,000, the lowest level in eight months. Homebuilder shares were hard hit. April flash manufacturing PMI slipped to a reading of 55.4 from 55.5 at the end of March. Equities were mixed Thursday as economic news also was mixed along with earnings. Initial jobless claims spiked but Easter seasonality issues likely came into play. Durables orders were stronger than expected. Stocks were strongest in the tech sector with Apple shares surging 8.2 percent after selling more iPhones than projected. At mid-week, stocks were mostly lower on disappointing Chinese and U.S. economic data. Earnings also weighed on stocks. New home sales for March surprised and declined 14.5% to a seasonally adjusted annual rate of 384,000, the lowest level in eight months. Homebuilder shares were hard hit. April flash manufacturing PMI slipped to a reading of 55.4 from 55.5 at the end of March. Equities were mixed Thursday as economic news also was mixed along with earnings. Initial jobless claims spiked but Easter seasonality issues likely came into play. Durables orders were stronger than expected. Stocks were strongest in the tech sector with Apple shares surging 8.2 percent after selling more iPhones than projected.
On Friday, stocks dropped sharply on worries about violence in Ukraine and possible intervention by Russia. Also, tech stocks tugged down on equities as Amazon reported rising costs and slimmer margins.
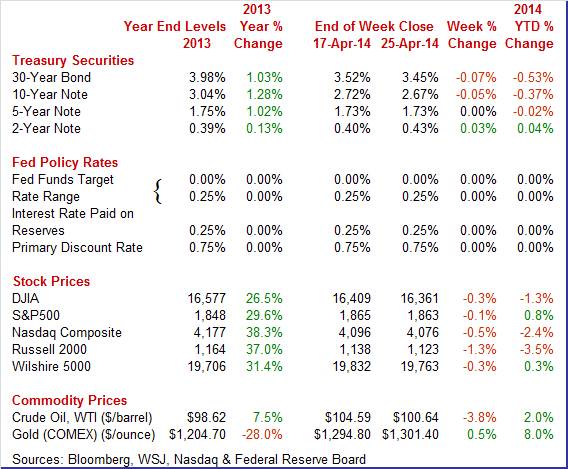
Equities were down this past week. The Dow was down 0.3 percent; the S&P 500, down 0.1 percent; the Nasdaq, down 0.5 percent; the Russell 2000, down 1.3 percent; and the Wilshire 5000, down 0.3 percent.
For the year-to-date, major indexes are mixed as follows: the Dow, down 1.3 percent; the S&P 500, up 0.8 percent; the Nasdaq, down 2.4 percent; the Russell 2000, down 3.5 percent; and the Wilshire 5000, up 0.3 percent.
Weekly percent change column reflects percent changes for all components except interest rates. Interest rate changes are reflected in simple differences.
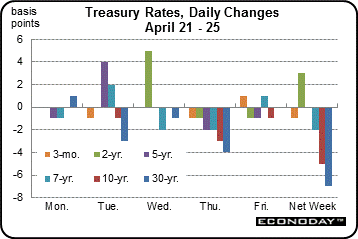 Treasury yields were mostly down this past week on moderate flight to safety although Fed concerns affected the mid-range. Treasury yields were mostly down this past week on moderate flight to safety although Fed concerns affected the mid-range.
Rates nudged down Monday on violence in eastern Ukraine. Somewhat offsetting was a better-than-expected report on leading indicators. Rates were mixed Tuesday as the mid-range rose on belief that the Fed will raise policy rates before the notes mature.
Most rates eased at mid-week on a sharp drop in new home sales but upward pressure continued on the mid-range on Fed concerns. The biggest move—though still modest—was Thursday as rates dipped on a rise in initial jobless claims, a strong seven-year T-note auction, and sabre rattling by Russian President Putin of potential Russian intervention in Ukraine if Ukraine actions against eastern Ukraine separatists continued. Partially offsetting was a strong durables orders report. Rates were little changed Friday.
For this past week Treasury rates were mostly down as follows: 3-month T-bill, down 1 basis point; the 2-year note, up 3 basis points; the 5-year note, unchanged; the 7-year note, down 2 basis points; the 10-year note, down 5 basis points; and the 30-year bond, down 7 basis points.
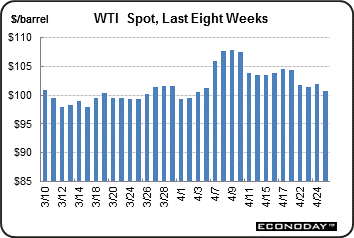 The spot price of West Texas Intermediate fell notably this past week but daily movement was only significant on Tuesday and Friday. The spot price of West Texas Intermediate fell notably this past week but daily movement was only significant on Tuesday and Friday.
Crude fell over $2-1/2 dollars on expectations that stockpiles would be reported as rising. Indeed, the government report out on Wednesday showed U.S. supplies hit the highest level in 83 years. But pricing had already been built in. WTI fell Friday, tracking U.S. stocks downward.
Net for the week, the spot price for West Texas Intermediate dropped $3.95 per barrel to settle at $100.64.
Economic news was mixed with weather effects still impacting data. Housing was most mixed while manufacturing was mostly positive.
 Housing is no longer adding to overall economic growth but continues to detract over quite a few months. Housing is no longer adding to overall economic growth but continues to detract over quite a few months.
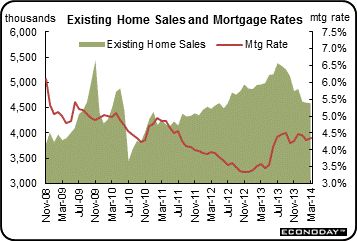
Sales of existing homes have yet to recover from the Federal Reserve's decision, way back last year, to begin withdrawing stimulus. For the seventh time in eight months, sales of existing homes contracted, at minus 0.2 percent in March to an annual rate of 4.59 million. Year-on-year, sales are down 7.5 percent which is the steepest rate of contraction since May 2011.
Low supply is a key reason for the sales trouble, though the weakness in sales during March did lift supply relative to sales slightly, to 5.2 months vs 5.0 months in February.
The housing sector remains the weak link in the economy and the weather cannot be blamed, at least not in March.
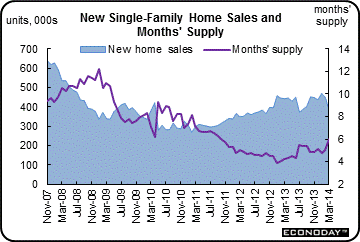 In an unsettling setback for an already unsteady housing sector, new home sales fell very sharply in March, down 14.5 percent to a 384,000 annual rate. Revisions offer a marginal offset, with February and March revised upward by a combined 19,000. In an unsettling setback for an already unsteady housing sector, new home sales fell very sharply in March, down 14.5 percent to a 384,000 annual rate. Revisions offer a marginal offset, with February and March revised upward by a combined 19,000.
Prices, arguably unsustainably high prices, are a major factor constraining sales of new homes, as they are for sales of existing homes. The median price surged 11.2 percent last month to a record high of $290,000. Year-on-year, new home prices are up 12.6 percent. This compares with a year-on-year decline in sales -- not gain in sales -- of 13.3 percent.
Low supply of homes on the market has also been constraining sales although this factor, because of the decline in sales, eased sharply in March. Supply relative to sales rose to 6.0 months, well up from 5.0 and 4.8 months in the prior two months and compared against 4.2 months in March last year.
Again, one cannot blame the weather for weak sales in March.
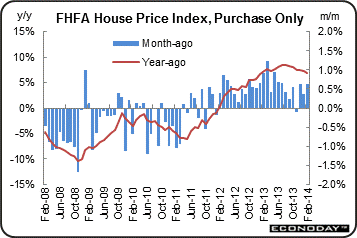 Sales are sluggish but low supply is providing lift to prices. Sales are sluggish but low supply is providing lift to prices.
According to the FHFA, home prices increased 0.6 percent in February on a seasonally adjusted basis, following a 0.3 percent gain the month before.
Six of nine Census regions showed gains in the latest month while two declined and one was unchanged. The largest regional increase was in the South Atlantic Census Division with a 1.7 percent boost. The New England region decreased 2.5 percent. Atypically adverse weather may have been a factor in demand in this region.
The year-on-year rate for came in at 6.9 percent, following 7.2 percent in January.
Overall, home prices are moving upward and adding to consumer confidence. The latest FHFA data are a plus for the recovery.
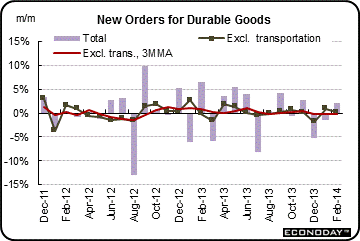 The latest and notably positive news for manufacturing is a boost in new orders for durables—which had been flat on average. The latest and notably positive news for manufacturing is a boost in new orders for durables—which had been flat on average.
Manufacturing is regaining strength as the latest durables orders numbers were notably positive and topped expectations. Durables orders jumped 2.6 percent in March after a 2.1 percent boost the month before. Excluding transportation, March was still robust with a 2.0 percent advance, following a rise of 0.1 percent in February. Analysts projected a 0.9 percent increase for March.
The transportation component increased a monthly 4.0 percent after jumping 6.7 percent the month before. Within transportation, the gain was led by a sharp gain in nondefense aircraft orders with motor vehicle orders also positive. Defense aircraft orders fell after a large jump in February.
Outside of transportation, orders were up on a widespread basis. All major components were positive.
Businesses are uncertain about whether to invest in expansion or not—as in new equipment. But in the latest durables report, businesses were more upbeat. Investment in equipment rebounded. Nondefense capital goods orders excluding aircraft rebounded 2.2 percent in March after dipping 1.1 percent the prior month. Shipments for this series rose 1.0 percent, following a 0.7 percent gain in February.
The latest durables report indicates that the manufacturing sector is regaining momentum. Shipment numbers may lead analysts to nudge up forecasts for the business equipment component in first quarter GDP.
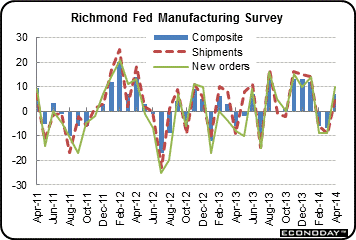 Regional indications on the manufacturing sector this month have been positive and now include the Richmond Fed index which moved back into positive ground, at plus 7 vs minus 7 and minus 6 in the prior two months. New orders lead the details, at plus 10 vs minus 9 in both March and February. Employment is also up, at plus 4 vs zero readings in the prior two months. Other readings include desired builds for inventories and no more than moderate price pressure. Regional indications on the manufacturing sector this month have been positive and now include the Richmond Fed index which moved back into positive ground, at plus 7 vs minus 7 and minus 6 in the prior two months. New orders lead the details, at plus 10 vs minus 9 in both March and February. Employment is also up, at plus 4 vs zero readings in the prior two months. Other readings include desired builds for inventories and no more than moderate price pressure.
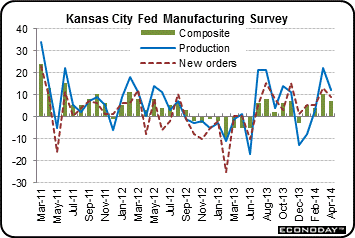 The Kansas City Fed composite manufacturing index eased a bit in April but remained in moderate growth territory. The index posted at 7 versus 10 in March. Analysts forecast a reading of 8 for April. The new orders index also slipped but continued to reflect growth, coming in at 9, following 13 in March. The Kansas City Fed composite manufacturing index eased a bit in April but remained in moderate growth territory. The index posted at 7 versus 10 in March. Analysts forecast a reading of 8 for April. The new orders index also slipped but continued to reflect growth, coming in at 9, following 13 in March.
Mild improvement was seen in backlogs of orders (plus 4 versus minus 1), number of employees (3 versus 0), and workweek (6 versus 3).
Overall, manufacturing continued to grow in April in the Kansas City Fed District and there are signs of modest improvement ahead.
Even at the national level, there are signs of growth in manufacturing in April. Markit's U.S. manufacturing sample reported steady and solid growth so far this month with the Purchasing Managers Index (PMI) at a mid-month flash reading of 55.4 vs 55.5 in both the final and flash readings for March. The rate of growth for new orders was especially strong, at 58.9 for one of the strongest readings of the recovery. The reading for backlog of orders, at 55.2, was also one of the strongest of the recovery. Output was also near a recovery high, at 58.2.
Growth in the nation's services sector is respectable but is slowing marginally, based on Markit's flash PMI which dipped to 54.2 from 55.3 in final March and 55.5 in the flash reading for March. Though the latest reading is still well over 50 to indicate monthly growth, it is however the second slowest rate of growth since October 2013.
Growth in new business did pick up 6 tenths to 53.6 compared to the final March reading but the rate is no better than moderate and remains slower than any of last year's readings. A negative in the report is further slowing in employment, down 8 tenths to a 51.0 level that points to only the most modest growth rate in hiring.
Outstanding business is in actual contraction for the third time so far this year, down 3 tenths to 48.0. But business expectations remain very strong, at 74.8, though they are down 1.6 points from March.
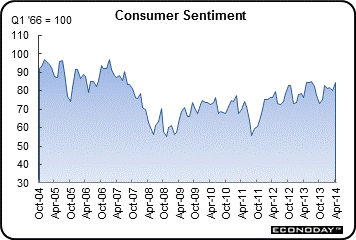 The consumer sector is making a comeback. The signal for April from the consumer sentiment report is very strong, with the composite index at 84.1 versus the flash April reading of 82.6 and the final March reading of 80.0. The latest reading is tied for the third best of the recovery, only 1.0 off from the recovery high of 85.1 in July last year. The consumer sector is making a comeback. The signal for April from the consumer sentiment report is very strong, with the composite index at 84.1 versus the flash April reading of 82.6 and the final March reading of 80.0. The latest reading is tied for the third best of the recovery, only 1.0 off from the recovery high of 85.1 in July last year.
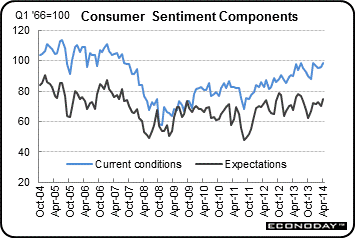 Perhaps the biggest plus in the report was the current conditions component, at 98.7 for a new recovery best and a very strong 3.0 points above March. This comparison points to strong consumer activity for April and will confirm for many that the economy is off to a strong spring start from the heavy weather of the winter. The reading also hints at strength in the jobs market, to which consumers are very sensitive. Perhaps the biggest plus in the report was the current conditions component, at 98.7 for a new recovery best and a very strong 3.0 points above March. This comparison points to strong consumer activity for April and will confirm for many that the economy is off to a strong spring start from the heavy weather of the winter. The reading also hints at strength in the jobs market, to which consumers are very sensitive.
The expectations component is also higher, at 74.7 for a 4.7 point jump from March and the strongest reading since July last year. This reading has been higher in the recovery, peaking at 79.0 in October 2012.
The latest report indicates that the consumer is back to adding to economic growth—although it would be stronger with healthier jobs growth.
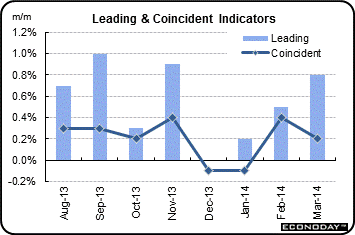 Spring is here and the thaw is on after a frigid winter. And the index of leading indicators is taking off, up a higher-than-expected 0.8 percent in March following an unrevised 0.5 percent gain in February and a 0.2 percent rise in January. March's gain points to accelerating growth over the next six months. Spring is here and the thaw is on after a frigid winter. And the index of leading indicators is taking off, up a higher-than-expected 0.8 percent in March following an unrevised 0.5 percent gain in February and a 0.2 percent rise in January. March's gain points to accelerating growth over the next six months.
As usual the rate spread, reflecting the Federal Reserve's near-zero rate policy, was the largest contributor though the second largest contributor, the factory workweek, was a very strong and welcome positive from the manufacturing sector. This is another sign of improvement in the manufacturing sector. Other positives were followed by the report's credit index, which points to strength in lending, and by strength in the stock market. Negatives were limited but do include building permits, in what is another negative signal out of the housing sector, and a dip in consumer expectations which however may already be reversing given strength in the mid-April consumer sentiment report and the weekly consumer comfort index.
Other readings include a 0.2 percent rise for the coincident index, which points to no more than a modest rate of ongoing growth, and a 0.6 percent rise for the lagging index which points to solid growth in prior months.
Economic growth is oscillating but upwards. We are still getting past difficult winter weather but the recovery is continuing to improve—especially for manufacturing and the consumer sectors.
The big news this coming week will come from the FOMC and from the Labor Department with Friday's employment situation for April. While positive, the March private payroll number slowed a bit. The question for April is whether there will be a weather rebound. The Fed appears to have taper on a tentative schedule of a $10 billion reduction each FOMC meeting. Will it continue' Also, we get the advance estimate for first quarter GDP and March personal income.
The pending home sales index fell 0.8 percent in February and in another negative, was revised down to minus 0.2 percent in January which at first had shown a small gain. Pending home sales have now fallen for nine straight months. Weather in February was heavy through much of the country, a factor that no doubt held back traffic of potential homebuyers and sales activity in housing. With less favorable mortgage rates, the result of the Fed's tapering program, the housing sector is expected to show less strength this year than last year.
Pending home sales Consensus Forecast for March 14: +0.6 percent
Range: -1.3 to +2.0 percent
The Dallas Fed general business activity index increased for the 11th month in a row in March. The production index, a key measure of state manufacturing conditions, rose from 10.8 to 17.1, indicating that output grew at a stronger pace than in February. Other measures of current manufacturing activity also reflected more robust growth. The new orders index rose to a nine-month high of 14.7, with nearly a third of manufacturers noting an increase in demand and less than a fifth noting a decrease. The shipments index rose from 13.3 to 19.5, posting its strongest reading in nearly four years. The capacity utilization index rose as well, climbing four points to 13.1.
Dallas Fed general business activity index Consensus Forecast for April 14: 6.0
Range: 3.0 to 7.5
FOMC meeting begins
The S&P/Case-Shiller 20-city home price index (SA) adjusted monthly sales gain for January was quite strong, at plus 0.8 percent, but the year-on-year rate, at plus 13.3 percent, is down 1 tenth from December. But gains were nevertheless convincing with all 20 cities in the plus column led by the West coast and including big gains in Florida and several Midwest and Northeast cities including Minneapolis, Washington DC and New York city.
The S&P/Case-Shiller 20-city HPI (SA, m/m) Consensus Forecast for February 14: +0.7 percent
Range: 0.0 to +1.5 percent
The S&P/Case-Shiller 20-city HPI (NSA, m/m) Consensus Forecast for February 14: +0.0 percent
Range: 0.0 to +0.7 percent
The S&P/Case-Shiller 20-city HPI (NSA, y/y) Consensus Forecast for February 14: +13.0 percent
Range: +11.6 to +14.0 percent
The Conference Board's consumer confidence index rose to 82.3 in March versus a revised 78.3 in February. The gain was led by strong showings in two subcomponents, expectations for future business conditions and, importantly, expectations for future employment. But the assessment of current conditions actually was down a bit including the very closely watched jobs-hard-to-get subcomponent which rose 6 tenths to 33.0 percent.
Consumer confidence Consensus Forecast for April 14: 83.0
Range: 80.8 to 87.8
ADP private payroll employment for March was 191,000 versus an upwardly revised 178,000 in February. For March, the BLS gain for private payrolls was 192,000.
ADP private payrolls Consensus Forecast for April 14: 210,000
Range: 170,000 to 250,000
GDP growth for the fourth quarter was revised up slightly to an annualized 2.6 percent from the second estimate of 2.4 percent and compared to the third quarter’s 4.1 percent. Nonetheless, the third estimate still was significantly lower than the advance estimate of 3.2 percent. Final sales of domestic product were revised up to 2.7 percent from 2.3 percent for the second estimate and versus 2.5 percent in the third quarter. Final sales to domestic purchases were bumped up to 1.6 percent from the prior estimate of 1.2 percent and compared to 2.3 percent the prior quarter. The overall price index was unrevised at 1.6 percent annualized. Third quarter growth was 2.0 percent. Core chain prices also were unrevised at 1.9 percent and equaling the third quarter pace. The picture of the fourth quarter is little changed—it was a soft patch and one that likely will be followed by another in the first quarter—notably due to adverse weather.
Real GDP Consensus Forecast for advance estimate Q1 14: +1.1 percent annual rate
Range: +0.5 to +2.0 percent annual rate
GDP price index Consensus Forecast for advance estimate Q1 14: +1.7 percent annual rate
Range: +1.4 to +2.5 percent annual rate
The employment cost index was up 0.5 percent in the fourth quarter for a sudued plus 2.0 percent year-on-year rate. Wages & salaries, reflecting year-end bonuses, did rise a noticeable 0.6 percent in the quarter, though the year-on-year rate, at plus 1.9 percent, remained modest. Benefits also rose 0.6 percent in the quarter, down from 0.7 percent in the prior quarter, with the year-on-year rate at plus 2.2 percent.
Employment cost index Consensus Forecast for Q1 14: +0.5 percent
Range: +0.4 to +0.7 percent
The Chicago PMI slowed to 55.9 for its lowest reading since August, down from 59.8 in February and below the low end of the Econoday consensus for 57.2. A major swing lower in employment to a neutral reading, one that reverses February's major swing higher, was a major negative. Another major negative was a sharp slowing in the most key reading of all, new orders.
Chicago PMI Consensus Forecast for April 14: 56.9
Range: 54.0 to 60.0
The FOMC announcement at 2:00 p.m. ET for the April 29-30 FOMC policy meeting is expected to leave policy rates unchanged and taper on schedule with another $10 billion reduction in bond purchases.
Sales of total light motor vehicles—held down by heavy weather in January and February—surged 6.9 percent in March to a 16.4 million annual rate. Sales of domestic-made vehicles were especially strong, rising 7.0 percent to a 13.0 million rate. Sales of imported vehicles rose 6.4 percent to 3.4 million. The results were very positive, offering the first hint that the post-weather rebound for the economy may be stronger than expected.
Motor vehicle domestic sales Consensus Forecast for April 14: 12.7 million-unit rate
Range: 12.5 to 13.1 million-unit rate
Motor vehicle total sales Consensus Forecast for April 14: 16.2 million-unit rate
Range: 15.8 to 16.8 million-unit rate
Initial jobless claims jumped 24,000 to 329,000 in the April 19 week. The gain lifted the 4-week average by 4,750 to a 316,750 level that was barely lower than the month-ago comparison. A plus is that continuing claims, in data that lag a week, continue to move lower, down 61,000 to a recovery low of 2.680 million in the April 12 week. Easter shifts in timing and seasonal factors can play havoc with adjustments and may be at play the last two weeks, at least for initial claims.
Jobless Claims Consensus Forecast for 4/26/14: 320,000
Range: 310,000 to 335,000
Personal income in February advanced 0.3 percent, equaling the rise in January. The important wages & salaries component grew 0.2 percent, following a 0.3 percent increase the month before. Consumer spending gained 0.3 percent in February after rising 0.2 percent the month before. On a year ago basis, headline inflation was 0.9 percent in February versus 1.2 percent the month before. Core inflation on a year-ago basis held steady at 1.1 percent. Looking ahead to the personal income report for March, from the payroll survey, private aggregate weekly earnings rose 0.7 percent in March, pointing to a sizeable rise in private wages & salaries.
Personal income Consensus Forecast for March 14: +0.4 percent
Range: +0.2 to +0.5 percent
Personal consumption expenditures Consensus Forecast for March 14: +0.6 percent
Range: +0.2 to +0.8 percent
PCE price index Consensus Forecast for March 14: +0.2 percent
Range: +0.1 to +0.3 percent
Core PCE price index Consensus Forecast for March 14: +0.2 percent
Range: +0.1 to +0.2 percent
The Markit PMI manufacturing flash index posted a reading of 55.4 for April versus 55.5 in both the final and flash readings for March. The rate of growth for new orders was especially strong, at 58.9 for one of the strongest readings of the recovery. The reading for backlog of orders, at 55.2, was also one of the strongest of the recovery. Output was also near a recovery high, at 58.2.
Markit PMI manufacturing index (final) Consensus Forecast for April 14: 55.8
Range: 55.4 to 56.5
The composite index from the ISM manufacturing survey in March snapped back from a very soft February but not quite as much as expected, rising only 5 tenths to 53.7. Growth in new orders was respectable at 55.1 for a 6 tenths gain but this rate was well below the plus 60 levels through the second half of last year. A positive was new export orders, at 55.5 which was very solid for this reading. And backlog orders were especially solid, at 57.5 for a 5.5 point gain. Production, which in February was held down by the month's heavy weather, made a big comeback in ISM's sample, at 55.9 for a 7.7 point gain.
ISM manufacturing composite index Consensus Forecast for April 14: 54.3
Range: 53.3 to 57.0
Construction spending in February edged up 0.1 percent, following a decline of 0.2 percent the month before. Strength was in private nonresidential outlays which rebounded 1.2 percent after a 1.0 decrease in January. Private residential outlays decreased 0.8 percent in February, following a 1.3 percent boost in January. Public outlays nudged up 0.1 percent, following a drop of 1.3 percent in January. On a year-ago basis, total outlays were up 8.7 percent after a 9.4 percent boost the prior month.
Construction spending Consensus Forecast for March 14: +0.6 percent
Range: 0.0 to +1.0 percent
Nonfarm payroll employment rose 192,000 in March after a 197,000 boost in February and a 144,000 increase in January. The net revision for the prior two months was up 37,000. Private payrolls gained 192,000, following an increase of 197,000 in February. Private payroll jobs finally topped the latest pre-recession peak. Losses in government jobs are still keeping back full recovery in total payroll jobs—private plus government.
The unemployment rate held steady at 6.7 percent. The consensus projected 6.6 percent. The “U-6” underemployment rate edged up to 12.7 percent from 12.6 percent in February.
Turning back to the payroll portion of the report, average weekly hours improved to 34.5 from 34.3 in February. Average hourly earnings came off as unchanged in March after a spike of 0.4 percent in February.
Nonfarm payrolls Consensus Forecast for April 14: 215,000
Range: 190,000 to 279,000
Private payrolls Consensus Forecast for April 14: 213,000
Range: 183,000 to 277,000
Unemployment rate Consensus Forecast for April 14: 6.6 percent
Range: 6.5 to 6.7 percent
Average workweek Consensus Forecast for April 14: 34.5 hours
Range: 34.4 to 34.5 hours
Average hourly earnings Consensus Forecast for April 14: +0.2 percent
Range: +0.2 to +0.3 percent
Factory orders bounced back strongly in February, up 1.6 percent. The month got a major lift from a 13.4 percent upswing in commercial aircraft orders. A 3.0 percent gain in motor vehicle orders also helped the total. But the total excluding transportation orders, which is a closely tracked reading, was also healthy, up 0.7 percent following 0.1 percent declines in the prior two months. More recently, durables orders jumped 2.6 percent in March after a 2.1 percent boost the month before.
Factory orders Consensus Forecast for March 14: +1.4 percent
Range: +0.3 to +2.1 percent
R. Mark Rogers is the author of The Complete Idiot’s Guide to Economic Indicators, Penguin Books.
He can also be found on a weekly broadcast talking about the U.S. economy, the easiest way to find him is by going to iTunes and searching for "Simply Economics."
Econoday Senior Writer Mark Pender contributed to this article.
|
