|
First quarter data were hard hit by adverse weather. But there is reason for optimism. The Fed is not accelerating its plan for measured taper. And more recent monthly data have been more favorable—including the latest jobs report. But markets are taking the latest numbers with a grain of salt, seeing at least some of the improvement as catch up activity.
 Equities rebounded nicely this past week which got off to a good start with better-than-expected pending home sales. Also on Monday, stocks rallies on optimism about merger activity. However, tensions over Ukraine weighed down on the day’s gains. Equities advanced Tuesday largely on upbeat earnings reports. Standouts on the upside included Merck, Sprint, and Ameriprise Financial. Equities rebounded nicely this past week which got off to a good start with better-than-expected pending home sales. Also on Monday, stocks rallies on optimism about merger activity. However, tensions over Ukraine weighed down on the day’s gains. Equities advanced Tuesday largely on upbeat earnings reports. Standouts on the upside included Merck, Sprint, and Ameriprise Financial.
 At mid-week, there was a modestly positive reaction in stocks on the Fed’s policy statement. The Fed was somewhat upbeat about the economy but still retained its policies on measured taper (no acceleration) and on continued low rates. A weak GDP report was shrugged off as largely weather related. Trading was light Thursday as traders waited on Friday’s employment report. For the day’s economic data, personal spending and manufacturing activity topped expectations while weekly jobless claims and construction spending disappointed. At mid-week, there was a modestly positive reaction in stocks on the Fed’s policy statement. The Fed was somewhat upbeat about the economy but still retained its policies on measured taper (no acceleration) and on continued low rates. A weak GDP report was shrugged off as largely weather related. Trading was light Thursday as traders waited on Friday’s employment report. For the day’s economic data, personal spending and manufacturing activity topped expectations while weekly jobless claims and construction spending disappointed.
At the end of the week, the employment report was seen as positive but was offset by renewal of tension and violence in Ukraine.
Equities were up this past week. The Dow was up 0.9 percent; the S&P 500, up 1.0 percent; the Nasdaq, up 1.2 percent; the Russell 2000, up 0.5 percent; and the Wilshire 5000, up 1.0 percent.
 For the month of April, major indexes are mixed as follows: the Dow, up 0.3 percent; the S&P 500, up 0.2 percent; the Nasdaq, down 1.7 percent; the Russell 2000, down 2.2 percent; and the Wilshire 5000, down 0.2 percent. For the month of April, major indexes are mixed as follows: the Dow, up 0.3 percent; the S&P 500, up 0.2 percent; the Nasdaq, down 1.7 percent; the Russell 2000, down 2.2 percent; and the Wilshire 5000, down 0.2 percent.
For the year-to-date, major indexes are mixed as follows: the Dow, down 0.4 percent; the S&P 500, up 1.8 percent; the Nasdaq, down 1.3 percent; the Russell 2000, down 3.0 percent; and the Wilshire 5000, up 1.3 percent.
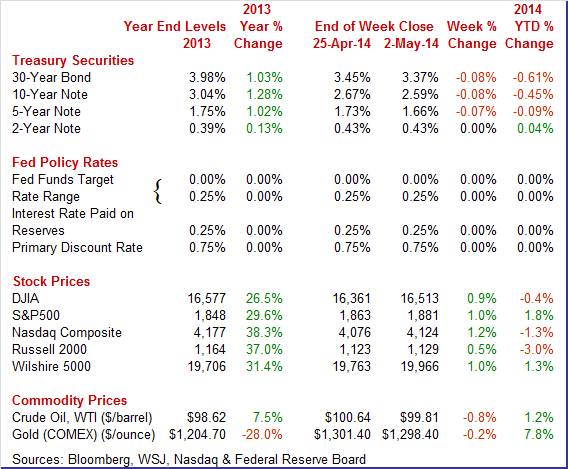
Weekly percent change column reflects percent changes for all components except interest rates. Interest rate changes are reflected in simple differences.
 This past week, Treasury rates eased moderately on Fed news and flight to safety. This past week, Treasury rates eased moderately on Fed news and flight to safety.
But the week started in the other direction as yields firmed. Rates rose as a planned bond sale by Apple that may be comparable to the size of its $17 billion offering last year squeezed the Treasury market on speculation that underwriters sold government debt to hedge interest-rate risk on the sale.
 After little change Tuesday, yields declined moderately Wednesday on language that the Fed would maintain the fed funds rate close to zero for a “considerable time.” Also, there was no sign in the statement that the Fed was considering an acceleration of its planned schedule of cutting back on bond purchases. Earlier in the day, the advance report for first quarter GDP showed anemic growth but a relatively healthy ADP employment report was somewhat offsetting. After little change Tuesday, yields declined moderately Wednesday on language that the Fed would maintain the fed funds rate close to zero for a “considerable time.” Also, there was no sign in the statement that the Fed was considering an acceleration of its planned schedule of cutting back on bond purchases. Earlier in the day, the advance report for first quarter GDP showed anemic growth but a relatively healthy ADP employment report was somewhat offsetting.
Treasury yields eased Thursday on an unexpected spike in initial jobless claims. Rates continued down Friday as a better-than-expected employment report was more than offset by flight to safety induced by violence in Ukraine.
For this past week Treasury rates mostly were down as follows: the 5-year note, down 7 basis points; the 7-year note, down 9 basis points; the 10-year note, down 8 basis points; and the 30-year bond, down 8 basis points. The 3-month T-bill and the 2-year note were unchanged.
 The spot price of West Texas Intermediate edged down this past week. After quiet days on Monday and Tuesday, WTI fell about a dollar per barrel at mid-week. West Texas Intermediate crude dipped to a four-week low after weekly government data showed another rise in inventories. Oil inventories rose 1.7 million barrels in the April 25 to 399.4 million. The spot price of West Texas Intermediate edged down this past week. After quiet days on Monday and Tuesday, WTI fell about a dollar per barrel at mid-week. West Texas Intermediate crude dipped to a four-week low after weekly government data showed another rise in inventories. Oil inventories rose 1.7 million barrels in the April 25 to 399.4 million.
Crude edged down Thursday on a soft Chinese Purchasing Managers’ Index and a rise in U.S. jobless claims. WTI firmed slightly at the end of the trading week on stronger-than-expected employment numbers.
Net for the week, the spot price for West Texas Intermediate slipped 83 cents per barrel to settle at $99.81.
Three reports stood out this week. The Fed made its April 30 policy statement much as expected; April employment was better than expected, and first quarter GDP deeply disappointed.
 There were no surprises from the April 30 FOMC meeting statement. Of course, policy rates were unchanged with the fed funds target rate at a range of zero to 0.25 percent. Taper remains as scheduled with another $10 billion cut in May and further is to be in measured steps. Taper is evenly split between Treasuries and mortgage-backed securities. Taper is still data dependent. There were no surprises from the April 30 FOMC meeting statement. Of course, policy rates were unchanged with the fed funds target rate at a range of zero to 0.25 percent. Taper remains as scheduled with another $10 billion cut in May and further is to be in measured steps. Taper is evenly split between Treasuries and mortgage-backed securities. Taper is still data dependent.
As most economists are pointing out, the Fed stated that economic activity has improved after severe winter weather-and labor market measures are improving.
"Information received since the Federal Open Market Committee met in March indicates that growth in economic activity has picked up recently, after having slowed sharply during the winter in part because of adverse weather conditions. Labor market indicators were mixed but on balance showed further improvement."
Bond purchases will be reduced in May by $10 billion per month-essentially as expected.
"In light of the cumulative progress toward maximum employment and the improvement in the outlook for labor market conditions since the inception of the current asset purchase program, the Committee decided to make a further measured reduction in the pace of its asset purchases. Beginning in May, the Committee will add to its holdings of agency mortgage-backed securities at a pace of $20 billion per month rather than $25 billion per month, and will add to its holdings of longer-term Treasury securities at a pace of $25 billion per month rather than $30 billion per month."
As usual, the statement notes that taper is not on a "preset" course but that measured steps will continue if the recovery continues as expected. The statement lists a variety of factors for continuing taper-essentially all economic news (nothing new).
This past week’s statement was a continuation of the last statement-but that is a good thing. The Fed is on its earlier announced policy path. There were no dissents.
However, the Fed still will be evaluating data on an ongoing basis. The Fed will be evaluating at a minimum sluggish GDP growth for the first quarter, the April improvement in jobs and unemployment, and also very low PCE inflation.
 Economic growth came to a standstill in the first quarter, largely due to adverse weather slowing production. First quarter GDP rose a meager 0.1 percent annualized after a 2.6 percent gain in the fourth quarter. The advance estimate fell well short of market expectations for a soft 1.1 percent rise. Economic growth came to a standstill in the first quarter, largely due to adverse weather slowing production. First quarter GDP rose a meager 0.1 percent annualized after a 2.6 percent gain in the fourth quarter. The advance estimate fell well short of market expectations for a soft 1.1 percent rise.
Final sales of domestic demand gained 0.7 percent after a 2.7 percent boost in the fourth quarter. Final sales to domestic purchasers eased to 1.5 percent in the first quarter after a 1.6 percent increase the prior quarter.
The overall price index posted at 1.3 percent annualized, following 1.6 percent in the fourth quarter. Analysts expected 1.7 percent. Core chain prices softened to a 1.3 percent rate from 1.9 percent in the prior quarter.
Adverse weather clearly had an impact on overall economic growth in the first quarter. Market focus should be on the latest monthly data-including motor vehicle sales and employment data. So far, latter Q1 and early Q2 are showing strength relative to the first two months in Q1.
 The labor market is showing improvement but a key question is how much is catch up from adverse weather. Total nonfarm payroll jobs increased 288,000 in April after a 203,000 gain in March and a 222,000 increase in February. The net revision for the prior two months was up 36,000. Expectations for April were for 215,000. Private nonfarm jobs gained 273,000 after a March increase of 203,000. The labor market is showing improvement but a key question is how much is catch up from adverse weather. Total nonfarm payroll jobs increased 288,000 in April after a 203,000 gain in March and a 222,000 increase in February. The net revision for the prior two months was up 36,000. Expectations for April were for 215,000. Private nonfarm jobs gained 273,000 after a March increase of 203,000.
The unemployment rate fell sharply to 6.3 percent from 6.7 percent in March. The consensus forecast 6.6 percent. A low participation rate contributed to the rate decline. The labor force fell a whopping 806,000 in April. The U-6 underemployment rate declined to 12.3 percent from 12.7 percent in March.
 Turning back to the payroll portion of the report, goods-producing jobs rose 53,000 in April after a gain of 29,000 in March. Construction jumped 32,000 in April after a 17,000 gain the prior month. The construction increase suggests a weather effect. Manufacturing rose 12,000 in April, following an increase of 7,000 in March. Turning back to the payroll portion of the report, goods-producing jobs rose 53,000 in April after a gain of 29,000 in March. Construction jumped 32,000 in April after a 17,000 gain the prior month. The construction increase suggests a weather effect. Manufacturing rose 12,000 in April, following an increase of 7,000 in March.
Private service-providing jobs increased 220,000, following a 173,000 advance in March. Professional and business services added 75,000 jobs in April. In April, employment in food services and drinking places was up 33,000. Health care employment increased by 19,000 in April.
Government jobs gained 15,000 after a rise of 1,000 in March.
Average weekly hours held steady at 34.5 hours. Average hourly earnings for all workers were unchanged after nudging up 0.1 percent in March.
The labor market is improving but a weather-related rebound may be coming into play. The Fed likely will look forward to next month’s report to get a better picture of the labor market.
 Personal income rose a healthy 0.5 percent in March after a 0.4 percent gain the month before. March topped market expectations for 0.4 percent. The consumer sector is improving with wages & salaries up a strong 0.6 percent after a rise of 0.3 percent in February. Personal income rose a healthy 0.5 percent in March after a 0.4 percent gain the month before. March topped market expectations for 0.4 percent. The consumer sector is improving with wages & salaries up a strong 0.6 percent after a rise of 0.3 percent in February.
Spending is quite robust. PCEs gained 0.9 percent in March after a 0.5 percent boost the prior month. Spending is making a comeback after adverse weather in January and February. Analysts called for a 0.6 percent increase in spending. Durables jumped 2.6 percent, following a 1.1 percent rise in February. Nondurables increased 0.8 percent, following an increase of 0.4 percent in February. Services jumped 0.7 in March after an advance of 0.4 percent the prior month.
 Inflation firmed a bit. PCE inflation rose 0.2 percent, following a 0.1 percent rise in February. Expectations were for a 0.2 percent rise. Core inflation followed the same pattern with an increase of 0.2 percent, following a boost of 0.1 percent in February. The median forecast was for 0.2 percent. Inflation firmed a bit. PCE inflation rose 0.2 percent, following a 0.1 percent rise in February. Expectations were for a 0.2 percent rise. Core inflation followed the same pattern with an increase of 0.2 percent, following a boost of 0.1 percent in February. The median forecast was for 0.2 percent.
On a year ago basis, headline inflation was 1.1 percent in March versus 0.9 percent the month before. Core inflation on a year-ago basis firmed marginal to 1.2 percent from 1.1 percent in February. The latest numbers leave the Fed room to retain accommodative monetary policy as inflation is well below the 2 percent inflation goal.
Overall, the consumer sector is reflecting the spring thaw. Income and spending are up. The momentum at the end of the first quarter is moderately favorable.
 The consumer was out car shopping again in April, following the weather-related jump in March. But April vehicle sales couldn't match the record setting pace of March but still proved very strong, at an annual pace of 16.0 million vs March's 16.4 million. The consumer was out car shopping again in April, following the weather-related jump in March. But April vehicle sales couldn't match the record setting pace of March but still proved very strong, at an annual pace of 16.0 million vs March's 16.4 million.
Though the results point to solid consumer strength, they don't point to a gain for the motor vehicle component of the April retail sales report. Total sales dipped 2.2 percent, following a jump of 6.9 percent in March.
 Consumer confidence eased in April but still remains over the key 80 level, at 82.3 in April versus March's upwardly revised 83.9. These readings are the highest of the recovery and follow five straight prior readings under 80. Consumer confidence eased in April but still remains over the key 80 level, at 82.3 in April versus March's upwardly revised 83.9. These readings are the highest of the recovery and follow five straight prior readings under 80.
But there was bad news in the April report and that is the present situation component which fell under 80, to 78.3 and sizably below March's 82.5.
The good news in the report was the expectations component which is steady and solid at 84.9 vs 84.8 in March. Those seeing more jobs opening up in the months ahead are up, to 15.0 percent vs March's 14.1 percent, as are those seeing their income going up, to 17.1 percent from 15.3 percent. Nevertheless, those seeing their own income falling rose to 12.9 percent from 11.5 percent.
The latest national data on manufacturing shows this sector continuing to grow. Markit's final manufacturing composite for April was unchanged from mid-month, showing very solid monthly growth at a composite of 55.4. The final reading for March was 55.5. New orders are also unchanged at 58.9 as are backlog orders at 55.2. Output was also unchanged at somewhat robust 58.2.
Turning to the latest ISM reading on manufacturing, the headline composite index rose 1.2 points to 54.9. Employment, which has been very soft in this report, bounced 3.6 points higher to a respectable 54.7.
New orders were at a solid 55.1, unchanged from March, with new export orders up 1.5 points to a very strong 57.0. Backlog orders were solid at 55.5. Production was little changed from March at 55.7.
 The home sales drought may be over. The first sign of spring momentum for the housing sector showed up in the latest pending home sales report. Pending home sales ended nine straight months of declines with a 3.4 percent surge in March. In another positive, February was revised upward by 3 tenths to minus 0.5 percent. The home sales drought may be over. The first sign of spring momentum for the housing sector showed up in the latest pending home sales report. Pending home sales ended nine straight months of declines with a 3.4 percent surge in March. In another positive, February was revised upward by 3 tenths to minus 0.5 percent.
March's gain was led by the West, at plus 5.7 percent, and by the largest region for existing home sales, the South, at plus 5.6 percent. The Northeast showed a small gain and the Midwest a small decline.
 Home-price appreciation was strong in February, gaining 0.8 percent versus increases of 0.8 percent and 0.7 percent in January and December. The unadjusted rate came in unchanged as expected in February which is a seasonally slow month for home sales. Home-price appreciation was strong in February, gaining 0.8 percent versus increases of 0.8 percent and 0.7 percent in January and December. The unadjusted rate came in unchanged as expected in February which is a seasonally slow month for home sales.
A look at adjusted monthly rates show sweeping gains across the country led once again by the West Coast and especially San Francisco. The only city to show any monthly declines over the October to February period is Cleveland, down 0.5 percent in February and down 0.6 percent in December.
However, based on still soft sales, prices look unsustainably high. And year-on-year rates are coming down though slowly. Both the adjusted and unadjusted year-on-year rates were identical over the last four months: plus 12.9 percent in February versus 13.2 percent, 13.4 percent, and 13.7 percent in the three prior months (note that seasonal differences are muted in year-on-year comparisons in contrast to month-to-month comparisons where seasonal differences are heightened). Slowing price appreciation may be helping to boost sales.
 Construction outlays rebounded in March—but only modestly. Outlays gained 0.2 percent after a 0.2 percent decline in February. And again, strength was in multifamily housing. Construction outlays rebounded in March—but only modestly. Outlays gained 0.2 percent after a 0.2 percent decline in February. And again, strength was in multifamily housing.
The latest gain was led by a 0.8 percent increase in private residential outlays, following no change in February. This was largely in the multifamily component which jumped 4.4 percent after a 2.1 percent boost in February. New one-family outlays edged up 0.2 percent in March, following a 0.3 percent decline the prior month.
Public spending declined 0.6 percent after a 0.1 percent dip in February. Private nonresidential outlays rebounded 0.2 percent in March after dropping 0.5 percent in February.
On a year-ago basis, total outlays were up 8.4 percent after a 8.1 percent increase the prior month.
Construction did not contribute to economic growth in the first quarter and weakness may or may not have been due to weather. But clearly, the single-family component is stagnating. This could be due to rising mortgage rates and soft employment. However, it also could be to the view that owning a house is not necessarily a good investment. The multifamily component (rentals) is where the growth is.
After an abysmal first quarter, more recent monthly data indicate stronger growth in the second quarter. Both housing and manufacturing appear to be regaining steam.
Recent data on manufacturing have been positive. This week’s numbers will indicate if the spring thaw is spreading to non-manufacturing with reports from Markit and ISM. A special factor (Olympic fees) widened February’s trade deficit and there could be some reversal. With the surprisingly sharp drop in Friday’s employment report, markets and the Fed will be looking at other labor market data for corroboration of improvement or not. That data includes this week’s JOLTS report with data on job openings, hires, and separations.
The Markit PMI services flash index for April dipped to 54.2 from 55.3 in final March and 55.5 in the flash reading for March. Though the latest reading was still well over 50 to indicate monthly growth, it was however the second slowest rate of growth since October 2013. Growth in new business did pick up 6 tenths to 53.6 compared to the final March reading but the rate was no better than moderate and remains slower than any of last year's readings. Outstanding business was in actual contraction for the third time so far this year, down 3 tenths to 48.0. But business expectations remained very strong, at 74.8, though they are down 1.6 points from March.
Markit PMI services index (final) Consensus Forecast for April 14: 55.3
Range: 54.2 to 56.5
The composite index from the ISM non-manufacturing survey for March was up a sizable 1.5 points to 53.1—a weather-related rebound. The report's employment index, which posted a near record plunge in February, jumped back 6.1 points to 53.6. New orders were also a key positive, rising 2.1 points to a 53.4 level that however is still on the moderate side.
ISM non-manufacturing composite index Consensus Forecast for April 14: 54.2
Range: 53.0 to 55.0
The U.S. international trade gap widened to $42.3 billion in February from $39.3 billion in January. Market expectations were for a $38.8 billion deficit. Curiously, the winter Olympics played a notable role. Exports declined 1.1 percent in February, following a gain of 0.6 percent the month before. Imports rose 0.4 percent after gaining 0.5 percent. The expansion of the trade gap was led by a slowing in the services balance to plus $19.4 billion from plus $20.2 billion in January. Exports of services were virtually unchanged from January to February. Imports of services increased $0.8 billion from January to February. The increase was mainly accounted for by an increase in royalties and license fees ($0.8 billion), which included payments for the rights to broadcast the 2014 Winter Olympic Games. The petroleum deficit expanded to $19.9 billion in February from $19.3 billion the month before. The goods excluding petroleum gap grew to $40.0 billion from $39.2 billion.
International trade balance Consensus Forecast for March 13: -$40.5 billion
Range: -$43.3 billion to -$38.3 billion
Nonfarm business productivity in the fourth quarter rose a revised1.8 percent after a 3.5 percent boost the prior quarter. Unit labor costs declined an annualized 0.1 percent, following a decrease of 2.1 percent in the third quarter. The rise in productivity reflected a 3.4 percent jump in non-farm output, following a boost of 5.4 percent in the third quarter. Hours worked increased 1.6 percent in the fourth after rising an annualized 1.9 in the third quarter. Compensation firmed to a 1.7 percent rate after rising 1.3 percent in the third quarter. With the first quarter GDP growth rate an anemic 0.1 percent annualized and with employment posting moderate gains, productivity in the first quarter is likely to be negative.
Nonfarm Business Productivity Consensus Forecast for initial Q1 14: -1.2 percent annual rate
Range: -1.8 to -0.5 percent annual rate
Unit Labor Costs Consensus Forecast for initial Q1 14: +2.8 percent annual rate
Range: +1.2 to +4.3 percent annual rate
Consumer credit outstanding rose a sharp $16.5 billion in February but the revolving component, where credit cards are tracked, continues to be very soft, down $2.4 billion in the month. Strength once again is entirely in the non-revolving component, up $18.9 billion and reflecting demand for car loans as well as the government's acquisition of student loans.
Consumer credit Consensus Forecast for March 14: +$15.1 billion
Range: +$12.0 billion to +$20.0 billion
Initial jobless claims have been extremely volatile in recent weeks—with seasonal adjustment issues related to Easter likely playing a role. Initial jobless claims have ranged from a low of 301,000 at the beginning of the month to a high of 344,000 in the April 26 week. Continuing claims, which are reported with a one week lag, also rose in the latest data, up a sizable 97,000 in the April 19 week to 2.771 million.
Jobless Claims Consensus Forecast for 5/3/14: 330,000
Range: 320,000 to 335,000
The Labor Department’s Job Openings and Labor Turnover Survey reported that there were 4.173 million job openings on the last business day of February, up from January at 3.874 million. The hires rate (3.3 percent) and separations rate (3.2 percent) were unchanged in February. There were 4.587 million hires in February, compared to 4.516 million in January. There were 4.419 million total separations in February, little changed from January at 4.419 million. The number of total separations was essentially unchanged for total private and government.
JOLTS job openings Consensus Forecast for March 14: 4.125 million
Range: 4.010 million to 4.205 million
Wholesale inventories, following an upward revised 0.8 percent jump in January, rose 0.5 percent in February which was roughly in line with a 0.7 percent rise in wholesale sales to keep the stock-to-sales ratio at 1.19. This ratio was much leaner back in December at 1.16.
Wholesale inventories Consensus Forecast for March 14: +0.5 percent
Range: +0.2 to +1.0 percent
R. Mark Rogers is the author of The Complete Idiot’s Guide to Economic Indicators, Penguin Books.
He can also be found on a weekly broadcast talking about the U.S. economy, the easiest way to find him is by going to iTunes and searching for "Simply Economics."
Econoday Senior Writer Mark Pender contributed to this article.
|
