|
In a relatively quiet week for economic news, traders focused on Fed Chair Janet Yellen's two-day testimony before Congress.
 Equities were mostly down this past week. But stocks got off to a positive start Monday after improvement in the ISM non-manufacturing index and Markit PMI services index. Somewhat offsetting was a weak reading on China's manufacturing sector. Stocks dropped Tuesday despite improvement in the U.S. trade deficit—including a gain on the export side. According to analysts some investors have started expressing concern that economic growth may not be strong enough to support stocks near record highs. Twitter led techs down as about 480 million shares from insiders became eligible for sale. Equities were mostly down this past week. But stocks got off to a positive start Monday after improvement in the ISM non-manufacturing index and Markit PMI services index. Somewhat offsetting was a weak reading on China's manufacturing sector. Stocks dropped Tuesday despite improvement in the U.S. trade deficit—including a gain on the export side. According to analysts some investors have started expressing concern that economic growth may not be strong enough to support stocks near record highs. Twitter led techs down as about 480 million shares from insiders became eligible for sale.
 Equities were mixed at mid-week with techs being moderately on the downside. Markets reacted favorably to Fed Chair Janet Yellen's testimony before Congress which indicated continued loose monetary policy. Stocks were mostly down Thursday even as initial jobless claims fell sharply. Losses were led by the energy and utility sectors. Yellen gave a second day of testimony but with few additional comments on policy. On Friday, on little news, equities were little changed but generally up slightly. Equities were mixed at mid-week with techs being moderately on the downside. Markets reacted favorably to Fed Chair Janet Yellen's testimony before Congress which indicated continued loose monetary policy. Stocks were mostly down Thursday even as initial jobless claims fell sharply. Losses were led by the energy and utility sectors. Yellen gave a second day of testimony but with few additional comments on policy. On Friday, on little news, equities were little changed but generally up slightly.
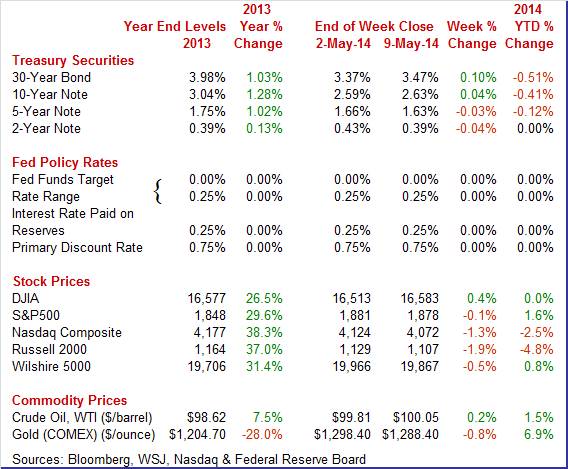
Equities were mostly down this past week. The Dow was up 0.4 percent; the S&P 500, down 0.1 percent; the Nasdaq, down 1.3 percent; the Russell 2000, down 1.9 percent; and the Wilshire 5000, down 0.5 percent.
For the year-to-date, major indexes are mixed as follows: the Dow, unchanged; the S&P 500, up 1.6 percent; the Nasdaq, down 2.5 percent; the Russell 2000, down 4.8 percent; and the Wilshire 5000, up 0.8 percent.
Weekly percent change column reflects percent changes for all components except interest rates. Interest rate changes are reflected in simple differences.
 Treasury yields this past week were down moderately on the short end. However, the 30-year bond rate rose notably. Daily swings were mild. Rates firmed Monday on a gain in the ISM non-manufacturing index. Yields were little changed but down marginally Tuesday ahead of Fed Chair Janet Yellen's testimony before Congress. Violence in Ukraine also put downward pressure on rates. Treasury yields this past week were down moderately on the short end. However, the 30-year bond rate rose notably. Daily swings were mild. Rates firmed Monday on a gain in the ISM non-manufacturing index. Yields were little changed but down marginally Tuesday ahead of Fed Chair Janet Yellen's testimony before Congress. Violence in Ukraine also put downward pressure on rates.
At mid-week, short rates eased slightly after Yellen indicated in Congressional testimony that a high degree of accommodation is still warranted. Rates were mixed Thursday as note yields eased on a second day of Congressional testimony by Yellen. Also weighing on note yields were comments from the European Central Bank that it may cut rates next month. On Friday, long rates firmed slightly. The 30-year bond appears to be drifting upward as taper has become more certain. It is the long end that is most affected by reduction of Fed purchases of bonds.
For this past week Treasury rates were mixed as follows: 3-month T-bill, up 1 basis point; the 2-year note, down 4 basis points; the 5-year note, down 3 basis points; the 7-year note, down 2 basis points; the 10-year note, up 4 basis points; and the 30-year bond, up 10 basis points.
 The spot price of West Texas Intermediate ended the week virtually unchanged. The spot price of West Texas Intermediate ended the week virtually unchanged.
Crude eased slightly Monday after Chinese manufacturing contracted for a fourth month in April. After a flat Tuesday, the largest daily swing of the week was a little over a dollar per barrel on Wednesday on a decline in crude inventories. WTI slipped modestly on Thursday on reconsideration by traders of still high levels of inventories.
Net for the week, the spot price for West Texas Intermediate nudged up 24 cents per barrel to settle at $100.05.
Fed Chair Janet Yellen spoke before Congress and stated that loose monetary policy will continue. Economic data were mostly positive.
Markets got what they wanted from Fed Chair Janet Yellen's Congressional testimony this past week—continued loose monetary policy.
Federal Reserve Chair Janet Yellen testified before the Joint Economic Committee on Wednesday and before the Senate Budget Committee on Thursday. Her remarks on the labor market were largely unchanged from recent speeches. She said that the labor market has improved, but not enough, noting that there is still substantial amount of slack in the labor market. Dr. Yellen's outlook for medium-term growth is unchanged despite the pause in the first quarter. She attributed it to mostly transitory factors, including the effects of the unusually cold and snowy winter weather. But she remains fairly optimistic, noting that rebounds in recent monthly indicators put the economy "on track for solid growth in the current quarter."
The Chair noted two new sources of downside risk to the growth outlook — one foreign and one domestic. They are the risk that adverse developments abroad could undermine confidence in the global economic recovery. The second is that the recent flattening out in housing activity could prove more protracted than currently expected rather than resuming its earlier pace of recovery. She also reiterated that the Fed's decisions about interest rate policy will depend on both realized and expected progress towards the FOMC's objectives.
The bottom line is that taper is still on but in measured steps and that policy rates will remain low for some time after bond purchases end. Also, the end of bond purchases does not change the fact that the Fed's balance sheet is still quite elevated—maintaining large amounts of liquidity.
 The trade deficit improved in March on lower oil imports and a special factor in services. The trade deficit improved in March on lower oil imports and a special factor in services.
The trade deficit in March narrowed to $40.4 billion from $41.9 billion in February. Exports rebounded 2.1 percent, following a 1.3 percent decline in February. Imports gained 1.1 percent after no gain the month before.
 The shrinking of the trade gap was led by a narrowing of the oil deficit with a rebound in the services surplus contributing. The petroleum deficit narrowed to $18.6 billion from $20.0 billion in February. It appears the oil gap narrowed on quantity instead of price as the BLS petroleum import price index rose slightly for the month. The shrinking of the trade gap was led by a narrowing of the oil deficit with a rebound in the services surplus contributing. The petroleum deficit narrowed to $18.6 billion from $20.0 billion in February. It appears the oil gap narrowed on quantity instead of price as the BLS petroleum import price index rose slightly for the month.
The services surplus rebounded to $20.4 billion in March from $19.5 billion the month before. The services surplus in February had been bumped down by license fees for coverage of the winter Olympics. The goods excluding petroleum gap expanded to $40.6 billion from $39.4 billion in February.
While the trade gap improved in March, it does not appear to be large enough to make much change in the next estimate for first quarter GDP which was basically flat.
 While the employment situation numbers for April showed improvement, the most recent JOLTS report points to a still soft labor market. While the employment situation numbers for April showed improvement, the most recent JOLTS report points to a still soft labor market.
The Labor Department's Job Openings and Labor Turnover Survey reported that there were 4.014 million job openings on the last business day of March, down from February at 4.125 million. The hires rate (3.4 percent) and separations rate (3.2 percent) were unchanged in March. There were 4.625 million hires in March, compared to 4.699 million in February. There were 4.431 million total separations in March, little changed from February at 4.459 million.
The latest JOLTS report points to a soft labor market which the doves at the Fed will likely point to for continued easy monetary policy.
 Consumers may be spending more but they are being cautious about using plastic. Consumers may be spending more but they are being cautious about using plastic.
Credit card debt is not building, a plus for consumer wealth perhaps but not helpful for store sales. Consumer credit did expand by a sharp $17.5 billion in March but, as has been the case since the 2008 financial meltdown, the gain was centered almost entirely in non-revolving credit which continues to get a boost from strong vehicle sales and the government's acquisition of school loans from private lenders.
Revolving credit was barely showing any life, up $1.1 billion following a decline of $2.7 billion in February. There should have been a weather rebound in March for revolving credit. Such a modest gain after weather hindered shopping clearly indicates the caution by consumers.
 The latest news on non-manufacturing points to stronger growth in the second quarter. The latest news on non-manufacturing points to stronger growth in the second quarter.
The ISM non-manufacturing index rose a solid 2.1 points to a 55.2 level.
New orders, the most important detail in the report, surged 4.8 points to a 58.2 reading that's the highest since August. Export business, reflecting strength in information and management services, is a highlight of the report, at 57.0. Business activity was especially strong, at 60.9 for a 7.5 point gain and the first plus-60 reading, also since August.
Despite the rise in orders and business activity, ISM's non-manufacturing sample is not hiring, at least not very much. The employment index was barely over 50, at 51.2 for a 2.3 point decline and the second soft reading of the last three months.
The great bulk of the nation's economy is picking up speed this spring but is not yet forcing businesses to add employees at a greater rate.
Also adding to the argument that the second quarter is picking up steam is Markit's service PMI which ended April at 55.0, up from 54.2 in the mid-month flash reading and versus 55.3 in the final March reading.
New business came in at 55.1, up 2.1 points from March. Business expectations are very strong and steady in Markit's sample, at 76.4. Despite the strength in both new business and the outlook for business, employment growth is not strong, at least yet. The employment index was not much over breakeven 50, at 51.2 and down from March's already soft 51.8.
The latest monthly data suggest that the spring thaw continues although hiring is lagging the rebound in business activity. But the Fed continues accommodative monetary policy even though bond purchases are being reduced.
Is the "spring thaw" still on' Two of the biggest reports this week may help answer whether Q2 is picking up. Retail sales jumped in March and there may still be some "catch up" activity in April. Housing has shown little rebound in activity. The earlier report this week is the Housing Market Index which will give an important reading on buyer traffic. The following day, the housing starts report may show a pickup in momentum after employment picked up.
The U.S. Treasury monthly budget report showed the Treasury's debt in March came in far below expectations, at $36.9 billion and reflecting roughly $50 billion in calendar timing adjustments centered in payments to Fannie Mae and Freddie Mac. But the fundamental picture was positive with receipts on the rise led by a 11 percent fiscal year-to-date increase in corporate taxes and a 7 percent increase in individual taxes. And the spending side came down, including a 6 percent decline in defense spending. The government's fiscal year begins in October and the year-to-date deficit is at $413 billion for a 31 percent improvement from this time last year...Looking ahead, the month of April typically shows a surplus for the month. Over the past 10 years, the average surplus for the month of April has been $55.9 billion and $5.6 billion over the past 5 years. The April 2013 surplus came in at $112.9 billion.
Treasury Statement Consensus Forecast for April 14: +$114.0 billion
Range: +$95.0 billion to +$116.0 billion.
The NFIB Small Business Optimism Index in March jumped 2.0 points to 93.4 to nearly reverse a 2.7 point downswing in February. The March gain was led by expectations for future sales and by plans to build inventories -- both pointing to expectations of building strength. Of the 10 components, six are up in the month, two are unchanged, and only two are down. Unfortunately, of the two that are down one is hiring plans.
NFIB Small Business Optimism Index Consensus Forecast for April 14: 94.5
Range: 93.5 to 96.0
Retail sales grew 1.1 percent in March after rebounding 0.7 percent in February (originally up 0.3 percent). Much of the latest advance came from motor vehicles which jumped 3.1 percent, following a 2.5 percent rebound in February. Excluding motor vehicles, sales increased a still healthy 0.7 percent, following a gain of 0.3 percent in February. Gasoline sales held back the total as this component declined 1.3 percent after edging up 0.1 percent in February. Other components were generally strong in March. Retail sales excluding autos and gasoline increased 1.0 percent after gaining 0.4 percent in February. Essentially, consumer spending appeared to be playing catch up after consumers were forced to stay inside during adverse winter weather.
Retail sales Consensus Forecast for April 14: +0.4 percent
Range: -0.1 to +0.6 percent
Retail sales excluding motor vehicles Consensus Forecast for April 14: +0.6 percent
Range: +0.4 to +0.9 percent
Less motor vehicles & gasoline Consensus Forecast for April 14: +0.5 percent
Range: +0.2 to +0.7 percent
Import prices rose 0.6 percent in March and were up 0.3 percent when excluding fuels. A 0.3 percent rise does not sound like much but it is the second 0.3 percent gain in three months. Year-on-year rates remain in the negative column at minus 0.6 percent overall, but here again the reading was up from minus 1.1 percent in the prior month. Export prices also moved up, at plus 0.8 percent in the month following an upward revised 0.7 percent gain in the prior month. Agricultural prices rose 2.7 percent but even when agricultural prices are excluded, export prices are up 0.5 percent.
Import prices Consensus Forecast for April 14: +0.4 percent
Range: -0.4 to +0.6 percent
Export prices Consensus Forecast for April 14: +0.2 percent
Range: -0.3 to +0.2 percent
Business inventories build in February proved moderate despite the month's heavy weather with business inventories up 0.4 percent, well under a 0.8 percent rise in business sales. The larger rise in sales was not, however, enough to lower the inventory-to-sales ratio which held unchanged at 1.31 in February, a bit more heavy than 1.29 in December and 1.28 in February last year.
Business inventories Consensus Forecast for March 14: +0.5 percent
Range: +0.2 to +0.8 percent
The producer price index for final demand jumped 0.5 percent in March. The reading for February was minus 0.1 percent. Total final demand excluding food & energy rose even more, up 0.6 percent after falling 0.2 percent the month before. Total final demand excluding food, energy, and trade services rose 0.3 percent vs a 0.1 percent gain in February. Year-on-year, PPI final demand rose an unadjusted 1.4 percent in March. Final demand excluding food & energy was also up a year-on-year 1.4 percent. Details include a sharp 0.7 percent monthly gain in services prices, more than reversing the prior month's 0.3 percent decline. Final demand food prices rose very sharply, up 1.1 percent in March following a 0.6 percent increase in February.
PPI-FD Consensus Forecast for April 14: +0.2 percent
Range: 0.0 to +0.4 percent
PPI-FD ex Food & Energy Consensus Forecast for April 14: +0.2 percent
Range: 0.0 to +0.3 percent
PPI-FD ex Food & Energy & Trade Services Consensus Forecast for April 14: No consensus numbers are available for this month's report
NAHB housing market index for April posted at a lower-than-expected 47, and remained below breakeven 50 for a third straight month. The weakness was centered in traffic which remained far below 50 at 32. Weakness in traffic points to lack of participation by first-time homebuyers and the importance of all-cash buyers who have been holding up the housing market. But other readings are positive led by strength among prospective buyers where the index is at 57 for a 4 point gain in the month. Present sales show marginal growth, unchanged for a third month at 51.
NAHB housing market index Consensus Forecast for May 14: 49.0
Range: 48.0 to 50.0
The consumer price index warmed up a bit in March, topping expectations at the headline and core levels. Headline inflation firmed to a 0.2 percent rise after posting a 0.1 percent rise in February. Analysts expected 0.1 percent. Increases in the shelter and food indexes accounted for most of the headline increase. Excluding food and energy, CPI inflation also rose to 0.2 percent from 0.1 percent the prior month. Market expectations were for 0.1 percent. The energy component eased 0.1 percent after declining 0.5 percent in February. Gasoline fell 1.7 percent in both March and February. Food price inflation, however, continued strong with a 0.4 percent jump in each of the latest two months. Year-on-year, overall CPI inflation was 1.5 percent in March, compared to 1.1 percent in February (seasonally adjusted). The core rate increased 1.6 percent year-on-year, matching the rate for February.
CPI Consensus Forecast for April 14 +0.3 percent
Range: +0.2 to +0.4 percent
CPI ex food & energy Consensus Forecast for April 14: +0.1 percent
Range: +0.1 to +0.2 percent
Initial jobless claims fell a sharp 26,000 in the May 3rd week to a 319,000 level. Despite the improvement, the 4-week average, reflecting sharp increases in the prior two weeks, was still trending higher, at 324,750 for a third straight gain and nearly 10,000 higher than the month-ago comparison.
Jobless Claims Consensus Forecast for 5/10/14: 317,000
Range: 303,000 to 325,000
The Empire State manufacturing index for April was essentially flat, barely over zero, at 1.29 vs 5.61 in March and 4.48 in February. New orders, the most important of all readings, were in the negative column at minus 2.77. Shipments showed some growth, at plus 3.15, while employment shows better growth, at 8.16 vs March's 5.88. On the negative side were unfilled orders, at minus 13.27. Inventories show a draw while price data do show some upward pressure.
Empire State Manufacturing Survey Consensus Forecast for May 14: 5.00
Range: 3.00 to 8.50
Industrial production in March topped expectations on utilities but the manufacturing component was still quite healthy. Industrial production advanced 0.7 percent, following a rebound of 1.2 percent in February. By major components, manufacturing increased 0.5 percent, following a 1.4 percent jump in February. Analysts projected a 0.5 percent gain. Mining increased 1.5 percent in March after a 0.9 percent boost the month before. Utilities jumped 1.0 percent after dipping 0.3 percent in February. Manufacturing excluding motor vehicles increased 0.6 percent in March, following a 1.1 percent jump in February. Capacity utilization rose to 79.2 percent from 78.8 percent in February. Expectations were for 78.7 percent.
Industrial production Consensus Forecast for April 14: 0.0 percent
Range: -0.3 to +0.3 percent
Manufacturing production component Consensus Forecast for April 14: +0.4 percent
Range: 0.0 to +0.4 percent
Capacity utilization Consensus Forecast for April 14: 79.2 percent
Range: 78.9 to 79.4 percent
The general business conditions index of the Philadelphia Fed's Business Outlook Survey in April jumped 7.6 points to 16.6 to signal the strongest rate of monthly growth since September. New orders were up 9.1 points to 14.8 for the strongest reading since December. Shipments were particularly strong in April, up a very sizable 17.0 points to 22.7 for the strongest reading in more than three years. Employment also popped higher, up 4.2 points to 6.9. Philadelphia Fed survey Consensus Forecast for May 14: 14.3
Range: 8.0 to 22.0
Housing starts picked up in March but not as much as expected. However, strength was in the single-family component while it was expected to be in the multifamily component. Overall starts rose 2.8 percent after a 1.9 percent increase in February. The March annualized pace of 946,000 and was down 5.9 percent on a year-ago basis. Single-family starts jumped 6.0 percent, following a 2.9 percent rise the month before. Multifamily starts slipped 3.1 percent in March after no change the month before. Overall permits dipped 2.4 percent in March after surging 7.3 percent the prior month. The annualized rate of 990,000 was up 11.2 percent on a year-ago basis.
Housing starts Consensus Forecast for April 14: 0.980 million-unit rate
Range: 0.940 million to 1.050 million-unit rate
Housing permits Consensus Forecast for April 14: 1.020 million-unit rate
Range: 0.995 million to 1.100 million-unit rate
The Reuter's/University of Michigan's consumer sentiment index for April was very strong, with the composite index at 84.1 versus the flash April reading of 82.6 and the final March reading of 80.0. The latest reading is tied for the third best of the recovery, only 1.0 point off from the recovery high of 85.1 in July last year. Perhaps the biggest plus in the report was the current conditions component, at 98.7 for a new recovery best and a very strong 3.0 points above March. This comparison points to strong consumer activity for April and confirmed for many that the economy is off to a strong spring start from the heavy weather of the winter.
The expectations component was also higher, at 74.7 for a 4.7 point jump from March and the strongest reading since July last year.
Consumer sentiment Consensus Forecast for preliminary May 14: 84.5
Range: 82.5 to 88.0
R. Mark Rogers is the author of The Complete Idiot's Guide to Economic Indicators, Penguin Books.
He can also be found on a weekly broadcast talking about the U.S. economy, the easiest way to find him is by going to iTunes and searching for "Simply Economics."
Econoday Senior Writer Mark Pender contributed to this article.
|
