|
Economic indicators are still being jostled by recovery from severe winter weather early this year. However, the trend for various sectors is mostly up. But corporate news has been mixed.
 Even though the week got off to a good start, most major indexes ended the week flat to down somewhat. The Dow and S&P 500 closed at record highs Monday. With little indicator news for the day, upward momentum came from belief that the economy is improving and on increased M&A activity. Stocks were flat to down Tuesday on lower-than-expected retail sales. Small caps were notably weak but the Dow and S&P500 nudged up to record closes. Even though the week got off to a good start, most major indexes ended the week flat to down somewhat. The Dow and S&P 500 closed at record highs Monday. With little indicator news for the day, upward momentum came from belief that the economy is improving and on increased M&A activity. Stocks were flat to down Tuesday on lower-than-expected retail sales. Small caps were notably weak but the Dow and S&P500 nudged up to record closes.
 Equities declined Wednesday, led down again by small caps. Weakness was due in part to profit taking. Corporate news was not favorable on downgraded outlooks from IBM, Macy's, Deere, and Bank of America. Stocks continued to fall Thursday as an unexpected drop in manufacturing offset lower initial jobless claims. Also, Wal-Mart shares slid and weighed on both the S&P and Dow. The retailer forecast second quarter profit below analysts' estimates and reported its smallest growth in quarterly sales in nearly five years. Equities declined Wednesday, led down again by small caps. Weakness was due in part to profit taking. Corporate news was not favorable on downgraded outlooks from IBM, Macy's, Deere, and Bank of America. Stocks continued to fall Thursday as an unexpected drop in manufacturing offset lower initial jobless claims. Also, Wal-Mart shares slid and weighed on both the S&P and Dow. The retailer forecast second quarter profit below analysts' estimates and reported its smallest growth in quarterly sales in nearly five years.
At week's close, equities posted moderate gains on higher than expected housing starts. The April figure topped all analysts' forecasts.
Equities were mostly flat to down this past week. The Dow was down 0.6 percent; the S&P 500, unchanged; the Nasdaq, up 0.5 percent; the Russell 2000, down 0.4 percent; and the Wilshire 5000, unchanged.
For the year-to-date, major indexes are mixed as follows: the Dow, down 0.5 percent; the S&P 500, up 1.6 percent; the Nasdaq, down 2.1 percent; the Russell 2000, down 5.2 percent; and the Wilshire 5000, up 0.8 percent.
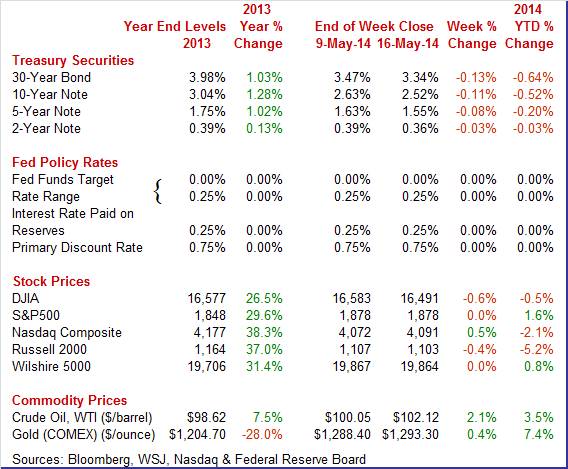
Weekly percent change column reflects percent changes for all components except interest rates. Interest rate changes are reflected in simple differences.
 Treasury rates ended the week moderately down. On Monday, yields headed in the other direction, up on belief of an improving economy. Soft retail sales led rates down Tuesday. At mid-week, yields eased further amid speculation of additional monetary accommodation in Europe. Treasury rates ended the week moderately down. On Monday, yields headed in the other direction, up on belief of an improving economy. Soft retail sales led rates down Tuesday. At mid-week, yields eased further amid speculation of additional monetary accommodation in Europe.
Rates dipped Thursday despite a higher-than-expected CPI, lower jobless claims, and favorable regional manufacturing reports. The big factor was slower-than-expected first quarter GDP growth for the Eurozone plus weak U.S. industrial production. Rates firmed Friday on the housing starts news. For the week, the view increased that the Fed would not be raising policy rates by June 2015 as suggested in Fed forecasts.
For this past week Treasury rates were down as follows: 3-month T-bill, down 1 basis point; the 2-year note, down 3 basis points; the 5-year note, down 8 basis points; the 7-year note, down 9 basis points; the 10-year note, down 11 basis points; and the 30-year bond, down 13 basis points.
 The spot price of West Texas Intermediate rose moderately this past week. WTI rose slightly on Monday on concerns that oil supplies from Russia may be cut back. The biggest daily swing during the week was on Tuesday. Crude rose a buck and a quarter on forecasts that crude inventories will decrease as refinery production is boosted. The spot price of West Texas Intermediate rose moderately this past week. WTI rose slightly on Monday on concerns that oil supplies from Russia may be cut back. The biggest daily swing during the week was on Tuesday. Crude rose a buck and a quarter on forecasts that crude inventories will decrease as refinery production is boosted.
After a marginal uptick Wednesday, WTI dipped modestly Thursday in tandem with equities. Friday saw a slight rise after the favorable report on housing.
Net for the week, the spot price for West Texas Intermediate rose $2.07 per barrel to settle at $102.12.
This past week's data were mixed, still being impacted by the lagged effects of severe winter weather.
 Retail sales were soft in April and below expectations. But April followed two strong months—including an upwardly revised March. Retail sales edged up 0.1 percent, following a 1.5 per jump in March (previously 1.2 percent—including annual revisions) and a 0.9 percent increase in February. The revised March gain was the biggest since March 2010. Retail sales were soft in April and below expectations. But April followed two strong months—including an upwardly revised March. Retail sales edged up 0.1 percent, following a 1.5 per jump in March (previously 1.2 percent—including annual revisions) and a 0.9 percent increase in February. The revised March gain was the biggest since March 2010.
Excluding motor vehicles, sales were flat after a 1.0 percent boost in March. Expectations were for 0.6 percent. Gasoline sales were up notably in April. Excluding autos and gasoline, retail sales slipped 0.1 percent after spiking 1.4 percent in March. Forecasts were for 0.5 percent.
Within the core, there were some bright spots. Department store sales jumped 1.8 percent with strength also seen in clothing & accessories, and health & personal care. A moderate rise in building materials & garden equipment is encouraging for housing after a large boost in March. Weakness was led by declines in electronics & appliance stores and miscellaneous store retailers.
For impacting other economic data, the core number for April suggests acceleration for second quarter GDP. The April level is notably above the first quarter average and consumer spending typically is about two-thirds of GDP.
It appears that retail sales are still oscillating from the adverse winter weather. For April, it may be a leveling off after two strong months of catch up.
 Despite the spring thaw in much indicator data, the consumer mood is still on the cool side. Consumer sentiment has softened noticeably so far this month, to 81.8 versus 84.1 in final April and 82.6 versus mid-month April. Despite the spring thaw in much indicator data, the consumer mood is still on the cool side. Consumer sentiment has softened noticeably so far this month, to 81.8 versus 84.1 in final April and 82.6 versus mid-month April.
Weakness was split evenly between the composite's two components with expectations down 1.5 points from final April to 73.2 and with current conditions down to 95.1 which is 3.6 points below final April and which signals specific monthly weakness for the run of consumer data for May.
It is hard to explain the fall off in this report. Job indications are strong led by the bounce higher in the April employment report and followed by two straight weeks of significant declines in jobless claims. At the time of the sentiment reading, the stock market was making new records and housing prices were gaining—two factors that add to consumer wealth. Perhaps the drop will prove to be an outlier in an otherwise continued trend to new recovery highs.
 Industrial production in April disappointed with a notable decline but perhaps expectations were too high after strong gains the prior two months. April industrial production declined 0.6 percent, following gains of 0.9 percent in March and 1.1 percent in February. Industrial production in April disappointed with a notable decline but perhaps expectations were too high after strong gains the prior two months. April industrial production declined 0.6 percent, following gains of 0.9 percent in March and 1.1 percent in February.
By major components, manufacturing decreased 0.4 percent, following increases of 0.7 percent in March and 1.5 percent in February. Market expectations for April were for a 0.4 percent boost. For the latest month, manufacturing excluding motor vehicles fell 0.4 percent after advancing 0.7 percent in March and 1.2 percent in February.
Mining increased 1.4 percent after a 2.0 percent boost in March. The spring thaw effect did come into play as warmer weather followed an atypically harsh winter. Utilities plunged 5.3 percent in April, following a 0.6 percent rise the month before.
Capacity utilization declined to 78.6 percent from 79.3 percent in March.
Again, April's weakness simply may be coming off two strong months. Manufacturing data have been pointing to improvement in this sector—including durables orders, national manufacturing surveys, and regional manufacturing surveys.
 Large moves in the Empire State report are rare making May's nearly 17.7-point surge to 19.01 a standout signal for spring momentum in the manufacturing sector. This is the highest level since June 2010. Large moves in the Empire State report are rare making May's nearly 17.7-point surge to 19.01 a standout signal for spring momentum in the manufacturing sector. This is the highest level since June 2010.
In another rarity, the latest report was led by employment, up nearly 13 points to 20.88 in a gain that points to business confidence in the outlook. And confidence in the outlook for general conditions is enormously strong, up nearly 6 points to 43.96.
Other details show less strength but are still very convincing, including a more than 13 point gain in new orders to 10.44. Shipments, at 17.44, were very strong and underscore the need for labor. The prior draw in unfilled orders is slowing and inventory change remains narrow. Price pressures are moderate and are moderating further.
 The Philly Fed's general conditions index came in at 15.4 in May to indicate nearly as strong monthly growth as April's 16.6. Both months were well above the breakeven mark of zero. The Philly Fed's general conditions index came in at 15.4 in May to indicate nearly as strong monthly growth as April's 16.6. Both months were well above the breakeven mark of zero.
Details show less but still very solid strength versus April. Growth in new orders was down more than 3 points to a still moderately strong 10.5 while shipments also slowed, down 8.5 points to a still strong 14.2. Employment, like Empire State, was a plus, up nearly 1 point to 7.8 which is very solid for this reading.
Overall, the Empire State and Philly Fed reports point to moderately healthy growth in the manufacturing sector in May, suggesting that the April dip in national manufacturing was merely an oscillation in an upward trend.
 The spring thaw continues in housing. Housing starts advanced notably more than expected in April with a 13.2 percent monthly jump, after rising 2.0 percent the month before. The 1.072 million unit pace was up 26.4 percent on a year-ago basis and was the highest level since November. The spring thaw continues in housing. Housing starts advanced notably more than expected in April with a 13.2 percent monthly jump, after rising 2.0 percent the month before. The 1.072 million unit pace was up 26.4 percent on a year-ago basis and was the highest level since November.
 But the April surge was all multifamily which surged a monthly 39.6 percent, following a 10.6 percent drop in March. Multifamily is a volatile component. All units are counted as started when one unit is started. There probably still is spring thaw effect. The single-family component edged up 0.8 percent in April, following a 9.3 percent jump the prior month. But the April surge was all multifamily which surged a monthly 39.6 percent, following a 10.6 percent drop in March. Multifamily is a volatile component. All units are counted as started when one unit is started. There probably still is spring thaw effect. The single-family component edged up 0.8 percent in April, following a 9.3 percent jump the prior month.
By region, starts were led by a 42.1 percent spike in the Midwest, followed by the Northeast with a 28.7 percent jump. The West and South also posted gains of 11.1 percent and 1.5 percent, respectively.
Housing permits gained 8.0 percent, following a 1.1 percent dip the prior month. The annualized rate of 1.080 million units topped expectations for 1.020 million units and was up 3.8 percent on a year-ago basis. Again, strength was in the multifamily component which was up 19.5 percent while the single-family component rose a modest 0.3 percent.
Housing appears to be on a dual track with the multifamily component growth rate more positive than the single-family component. The divergence in the components is consistent with the housing market index which has leveled off. Permits are less impacted by short changes in weather (permit purchasing is an indoor activity) and suggest that the improvement in multifamily construction is real.
 As expected, energy bumped up consumer price inflation in April. Headline inflation posted at 0.3 percent rise after rising 0.2 percent in March. April matched the market forecast. Excluding food and energy, CPI inflation came in at 0.2 percent, equaling the pace of March but coming in a little higher than analysts' projection for 0.1 percent. As expected, energy bumped up consumer price inflation in April. Headline inflation posted at 0.3 percent rise after rising 0.2 percent in March. April matched the market forecast. Excluding food and energy, CPI inflation came in at 0.2 percent, equaling the pace of March but coming in a little higher than analysts' projection for 0.1 percent.
The energy component rebounded 0.3 percent in April, following a 0.1 percent dip in March. Gasoline jumped 2.3 percent after declining 1.7 percent in March. Food gained 0.4 percent in each of the latest two months.
 Within the core, new vehicles increased 0.3 percent in April while used cars rose 0.5 percent. Education saw a 0.4 percent boost. Food & beverages increased 0.4 percent. Owners' equivalent rent rose 0.2 percent. On the soft side, apparel was flat along with "other." Within the core, new vehicles increased 0.3 percent in April while used cars rose 0.5 percent. Education saw a 0.4 percent boost. Food & beverages increased 0.4 percent. Owners' equivalent rent rose 0.2 percent. On the soft side, apparel was flat along with "other."
Year-on-year, overall CPI inflation was 2.0 percent in April, versus 1.5 percent in March (seasonally adjusted). April's figure was the highest since July 2013. The core rate increased to 1.8 percent year-on-year, up from 1.6 percent in March. April had the highest reading since August 2013. On a not seasonally adjusted based, headline inflation on a year ago basis was up 2.0 percent while excluding food and energy was up 1.8 percent in April.
The latest inflation numbers again are a little on the warm side and will have Fed hawks keeping taper on schedule. Essentially, core inflation is heading up slowly as the Fed intends with quantitative easing.
 The PPI for total final demand jumped 0.6 percent in April, following a 0.5 percent boost the month before. The April increase was the largest gain since September 2012. Total final demand excluding food & energy gained 0.5 percent, following an increase of 0.6 percent in March. The PPI for total final demand jumped 0.6 percent in April, following a 0.5 percent boost the month before. The April increase was the largest gain since September 2012. Total final demand excluding food & energy gained 0.5 percent, following an increase of 0.6 percent in March.
Total final demand excluding food, energy, and trade services increased 0.3 percent, matching the pace in March.
 A big part of the jump in overall final demand was the food component which spiked a monthly 2.7 percent, following a rise of 1.1 percent in March. Energy was subdued with a 0.1 percent rise in April, following a 1.2 percent drop the month before. Tugging down on energy in the latest month was home heating oil, residential natural gas, energy for export, and government purchased energy. Upward pressure on energy largely came from a 1.8 percent rebound in gasoline after a decline of 2.4 percent in March. A big part of the jump in overall final demand was the food component which spiked a monthly 2.7 percent, following a rise of 1.1 percent in March. Energy was subdued with a 0.1 percent rise in April, following a 1.2 percent drop the month before. Tugging down on energy in the latest month was home heating oil, residential natural gas, energy for export, and government purchased energy. Upward pressure on energy largely came from a 1.8 percent rebound in gasoline after a decline of 2.4 percent in March.
Also, light motor trucks rebounded 1.4 percent, following a 0.4 percent dip the month before.
The index for final demand services rose 0.6 percent in April following a 0.7-percent advance in March. In April, over two-thirds of the broad-based increase can be traced to margins for final demand trade services, which climbed 1.4 percent. (Trade indexes measure changes in margins received by wholesalers and retailers.)
On a seasonally adjusted year-ago basis, PPI final demand was up 2.1 percent in April, compared to 1.5 percent in March. Excluding food & energy, this series was up 1.8 percent versus 1.5 percent in March. On a not seasonally adjusted year-ago basis, PPI final demand was up 2.1 percent in April; excluding food & energy, up 1.9 percent. Excluding food, energy & trade services is not yet available on a year-ago basis since the series starts for August 2013.
April's jump in prices was unusual. We may still be in a rebound mode from atypically adverse winter weather. Some analysts see purchases as having been delayed by extreme winter weather, boosting margins.
Monthly data are still oscillating from the impact of severe winter weather early this year. But based on monthly averages, there are moderate uptrends in consumer spending, multifamily housing, and in manufacturing. And the Fed appears to be getting its wish for returning to goal inflation.
There is an abbreviated list of indicators ahead of the Memorial Day weekend. Bond traders in particular will be sensitive to Wednesday's release of FOMC minutes. With Empire State and Philly Fed indexes being healthy for May, the Markit flash PMI for manufacturing may indicate if strength is national. Single-family housing has been sluggish and this week's reading on existing home sales and new home sales could point to whether there is improvement. Finally, most analysts expect the second quarter to show stronger growth and the April leading index may provide some confirmation.
The Minutes of the April 29-30 FOMC meeting are scheduled for release at 2:00 p.m. ET. Traders will be watching for any signs of a slowing or acceleration in taper of Fed bond purchases.
Initial jobless claims declined 24,000 for a second straight week, to 297,000 in the May 10 week for the lowest reading since May 2007. But the 4-week average, inflated by possible Easter-skewed readings through April, showed less improvement, down only 2,000 to 323,250 and above the month-ago comparison by more than 10,000. The improvement for continuing claims is very convincing, down 9,000 in lagging data for the May 3 week to 2.667 million and a recovery low.
Jobless Claims Consensus Forecast for 5/17/14: 310,000
Range: 299,000 to 315,000
The Chicago Fed National Activity Index for March came in at 0.20 versus an upwardly revised 0.53 in February. Despite the slowing, the 3-month average rose to zero from February's revised minus 0.14. A zero reading indicates that economic growth in the month was at historical trend. The slowing in March was tied mostly to slowing in the production component which offset very welcome acceleration in the employment component. The consumption & housing component, still the weakest component, improved slightly in March while the sales/orders/inventories component moved marginally into the negative column following a moderate positive in February.
No consensus numbers are available for this month's report
The Markit PMI manufacturing index (final) for April was unchanged from mid-month, showing very solid monthly growth at a composite of 55.4. The final reading for March was 55.5. New orders are also unchanged at 58.9 as are backlog orders at 55.2. Output was also unchanged at somewhat robust 58.2.
Markit PMI manufacturing flash index Consensus Forecast for May 14: 55.9
Range: 55.4 to 56.2
Existing home sales in March, for the seventh time in eight months, contracted at minus 0.2 percent to an annual rate of 4.59 million. Year-on-year, sales were down 7.5 percent which is the steepest rate of contraction since May 2011. Low supply was a key reason for the sales trouble, though the weakness in sales during March did lift supply relative to sales slightly, to 5.2 months versus 5.0 months in February.
Existing home sales Consensus Forecast for April 14: 4.69 million-unit rate
Range: 4.60 to 4.90 million-unit rate
The Conference Board's index of leading indicators was up a higher-than-expected 0.8 percent in March following an unrevised 0.5 percent gain in February and a 0.2 percent rise in January. March's gain points to accelerating growth over the next six months. As usual the rate spread, reflecting the Federal Reserve's near-zero rate policy, was the largest contributor though the second largest contributor, the factory workweek, was a very strong and welcome positive from the manufacturing sector. This is another sign of improvement in the manufacturing sector. Other positives were followed by the report's credit index, which points to strength in lending, and by strength in the stock market. Negatives were limited but do include building permits, in what was another negative signal out of the housing sector, and a dip in consumer expectations which however may already be reversing given strength in the mid-April consumer sentiment report and the weekly consumer comfort index.
Leading indicators Consensus Forecast for April 14: +0.4 percent
Range: +0.3 to +0.6 percent
The Kansas City Fed manufacturing index eased a bit in April but remained in moderate growth territory. The index posted at 7 versus 10 in March. The new orders index also slipped but continued to reflect growth, coming in at 9, following 13 in March. Mild improvement was seen in backlogs of orders (plus 4 versus minus 1), number of employees (3 versus 0), and workweek (6 versus 3).
Kansas City Fed manufacturing index Consensus Forecast for May 14: 7
Range: 5 to 10
New home sales fell very sharply in March, down 14.5 percent to a 384,000 annual rate. Revisions offered a marginal offset, with February and March revised upward by a combined 19,000. Prices, arguably unsustainably high prices, are a major factor constraining sales of new homes, as they are for sales of existing homes. The median price surged 11.2 percent last month to a record high of $290,000. Year-on-year, new home prices are up 12.6 percent. This compares with a year-on-year decline in sales -- not gain in sales -- of 13.3 percent. Low supply of homes on the market has also been constraining sales although this factor, because of the decline in sales, eased sharply in March. Supply relative to sales rose to 6.0 months, well up from 5.0 and 4.8 months in the prior two months and compared against 4.2 months in March last year.
New home sales Consensus Forecast for April 14: 420 thousand-unit annual rate
Range: 396 thousand to 460 thousand-unit annual rate
SIFMA Recommended Early Close 2:00 ET
R. Mark Rogers is the author of The Complete Idiot's Guide to Economic Indicators, Penguin Books.
He can also be found on a weekly broadcast talking about the U.S. economy, the easiest way to find him is by going to iTunes and searching for "Simply Economics."
Econoday Senior Writer Mark Pender contributed to this article.
|
