|
The first quarter was weaker than earlier believed. But the spring thaw continues as monthly updates for the second quarter are trending upward. And investors are more upbeat than not as some major equity indexes continue to set record highs.
 Equities ended this past holiday shortened week moderately up. The week began Tuesday with healthy gains. . Small-cap and technology stocks led the broad based gains. Better than expected economic data, including durable goods orders and home prices boosted sentiment. The S&P 500 closed at a record high. On Wednesday, stocks fell with weakness led by retailers—notably Dollar General and Lowe's. To a large degree, day's declines in major indexes were seen as traders taking a breather from a four day rally for many indexes, including the S&P 500. Equities ended this past holiday shortened week moderately up. The week began Tuesday with healthy gains. . Small-cap and technology stocks led the broad based gains. Better than expected economic data, including durable goods orders and home prices boosted sentiment. The S&P 500 closed at a record high. On Wednesday, stocks fell with weakness led by retailers—notably Dollar General and Lowe's. To a large degree, day's declines in major indexes were seen as traders taking a breather from a four day rally for many indexes, including the S&P 500.
Thursday saw a jump in stocks even though a downward revision to first quarter GDP was more negative than forecast. Analysts still attribute much of the weakness in GDP to adverse weather. More than offsetting the reading for GDP was a sharp drop in initial unemployment claims. The week ended mixed with Blue Chips up and many other major indexes down. An unexpected dip in consumer spending from the personal income report weighed on stocks.
Equities were up this past week. The Dow was up 0.7 percent; the S&P 500, up 1.2 percent; the Nasdaq, up 1.4 percent; the Russell 2000, up 0.7 percent; and the Wilshire 5000, up 1.6 percent.
 Equities were mostly up in the month of May despite getting off to a bad start. The Dow was up 0.8 percent; the S&P 500, up 2.1 percent Nasdaq was up 3.1 percent; the Russell 2000, up 0.7 percent; and the Wilshire 5000, up 1.9 percent. Equities were mostly up in the month of May despite getting off to a bad start. The Dow was up 0.8 percent; the S&P 500, up 2.1 percent Nasdaq was up 3.1 percent; the Russell 2000, up 0.7 percent; and the Wilshire 5000, up 1.9 percent.
For the year-to-date, major indexes are mostly up as follows: the Dow, up 0.8 percent; the S&P 500, up 4.1 percent; the Nasdaq, up 1.6 percent; the Russell 2000, down 2.5 percent; and the Wilshire 5000, up 3.3 percent.
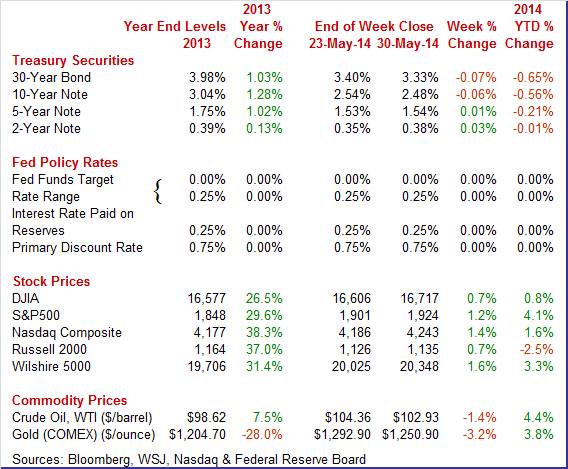
Weekly percent change column reflects percent changes for all components except interest rates. Interest rate changes are reflected in simple differences.
 Treasury yields were mixed this past week. At the start of the week on Tuesday, short rates were unchanged while mid and long rates eased. A slow rise in home prices offset stronger durables orders. Also, belief that the Fed would go slow on taper became more entrenched. With little economic news Wednesday traders focused on competitiveness of alternative bond instruments. A rally in government bonds in Europe made U.S. Treasuries more attractive, pushing yields down. An unexpected rise in unemployment in Germany fueled speculation that the European Central Bank will add stimulus at this week's policy meeting. Treasury yields were mixed this past week. At the start of the week on Tuesday, short rates were unchanged while mid and long rates eased. A slow rise in home prices offset stronger durables orders. Also, belief that the Fed would go slow on taper became more entrenched. With little economic news Wednesday traders focused on competitiveness of alternative bond instruments. A rally in government bonds in Europe made U.S. Treasuries more attractive, pushing yields down. An unexpected rise in unemployment in Germany fueled speculation that the European Central Bank will add stimulus at this week's policy meeting.
Rates firmed Thursday on lower-than-expected initial jobless claims. Mid-range rates bumped up Friday among mixed economic data. The Chicago PMI topped expectations while personal spending fell short.
For this past week Treasury rates were mostly up on the short end and down in the mid and long range as follows: 3-month T-bill, unchanged; the 2-year note, up 3 basis points; the 5-year note, up 1 basis points; the 7-year note, down 1 basis points; the 10-year note, down 6 basis points; and the 30-year bond, down 7 basis points.
 The spot price of West Texas Intermediate declined moderately this past week. The only notable daily swing this past week was on Wednesday. Crude fell about a buck and a quarter belief that U.S. supplies rose. Also, the euro declined against the dollar. On Thursday, the holiday delayed government report indeed showed a gain in crude supplies. The spot price of West Texas Intermediate declined moderately this past week. The only notable daily swing this past week was on Wednesday. Crude fell about a buck and a quarter belief that U.S. supplies rose. Also, the euro declined against the dollar. On Thursday, the holiday delayed government report indeed showed a gain in crude supplies.
Net for the week, the spot price for West Texas Intermediate declined $1.43 per barrel to settle at $102.93.
Looking in the rear view mirror, the first quarter was not so good due to adverse winter weather. But progress is being made in the second quarter although with a spotty upward monthly trend.
 No, it's not a recession but the first quarter was weaker than earlier believed with adverse weather turning growth negative. Real GDP growth for the first quarter was revised down to an annualized minus 1.0 percent from the advance estimate of plus 0.1 percent and compared to the fourth quarter's 2.6 percent. Analysts had expected a downward revision to minus 0.5 percent. The decline was the first since a 0.7 percent dip in the third quarter of 2011. No, it's not a recession but the first quarter was weaker than earlier believed with adverse weather turning growth negative. Real GDP growth for the first quarter was revised down to an annualized minus 1.0 percent from the advance estimate of plus 0.1 percent and compared to the fourth quarter's 2.6 percent. Analysts had expected a downward revision to minus 0.5 percent. The decline was the first since a 0.7 percent dip in the third quarter of 2011.
Final sales of domestic demand gained 0.6 percent after a 2.7 percent boost in the fourth quarter. Final sales to domestic purchasers actually were nudged up to 1.6 percent, matching the pace in the prior quarter.
By components, notable downward revisions were seen in inventory investment and net exports. Government purchases were marginally lower. PCEs, nonresidential fixed investment, and residential investment were nudged up.
The overall price index was unrevised at 1.3 percent which matched expectations. Fourth quarter growth was 1.6 percent. Core chain prices rose 1.3 percent, equaling the advance figure and following 1.9 percent in the fourth quarter.
Overall, while overall growth was bumped down into negative territory, it was mainly due to less robust inventory growth—final demand was little changed. And the second quarter is gaining strength.
 Personal income rose 0.3 percent in April but followed a robust 0.5 percent boost the month before. The key wages & salaries component followed a similar pattern, softening to 0.2 percent from a 0.6 percent jump in March. Personal income rose 0.3 percent in April but followed a robust 0.5 percent boost the month before. The key wages & salaries component followed a similar pattern, softening to 0.2 percent from a 0.6 percent jump in March.
Personal spending dipped 0.1 percent after a 1.0 percent spike in March. Spending on durables, reflecting a pause in auto sales, fell 0.5 percent versus gains of 3.6 and 1.3 percent in the prior two months.
Spending on services, however, also fell, down 0.2 percent on a decline in utilities and healthcare after a 0.5 percent rise in March. In real terms, spending fell 0.3 percent following the prior month's 0.8 percent surge. Price data remain muted, up 0.2 percent overall and up 0.2 percent ex-food and energy.
Year-on-year price rates are at plus 1.6 percent and 1.4 percent for the core. While inflation is still below the Fed goal of 2 percent, it has been firming in recent months—suggesting that the Fed will not slow its taper plan.
 The consumer is still uncertain about the economy. Confidence has been on a slow recovery since 2009 but there have been plenty of oscillations. Currently, the consumer appears to be in pause mode. The consumer is still uncertain about the economy. Confidence has been on a slow recovery since 2009 but there have been plenty of oscillations. Currently, the consumer appears to be in pause mode.
According to the Conference Board, consumer confidence in May held steady at moderately positive levels with the Conference Board's measure up 1.3 points to a third straight plus 80 level at 83.0. The present situation component for May points to strength relative to April, at 80.4 versus 78.5 in a reading that hints at monthly gains for consumer spending for May. The expectations component also showed a gain, up 9 tenths from April to 84.8.
Turning to the Reuters/University of Michigan report, Consumer sentiment had been on the rise but took a pause in May, at 81.9 versus a mid-month reading of 81.8 and down from April's very solid 84.1. Weakness this month is centered in current conditions, down 4.2 points to 94.5 which is not a good omen for the run of May's consumer data. But expectations, which pivot on the jobs and income outlook, are more resilient, down only 1.0 point to 73.7. Inflation expectations, which often rise in the summer as gasoline prices go up, are up 1 tenth from April for both the one-year outlook, at 3.3 percent, and the five-year outlook at 2.8 percent.
 Durables orders for April came in higher than expected, thanks to transportation. Also, March was revised significantly higher—reflecting benchmark revisions. Durables orders advanced 0.8 percent, following a 3.6 percent jump in March. Excluding transportation, durables orders edged up 0.1 percent in April, following a 2.9 percent spike the month before. Durables orders for April came in higher than expected, thanks to transportation. Also, March was revised significantly higher—reflecting benchmark revisions. Durables orders advanced 0.8 percent, following a 3.6 percent jump in March. Excluding transportation, durables orders edged up 0.1 percent in April, following a 2.9 percent spike the month before.
The transportation component gained 2.3 percent in April after a 5.0 percent jump the prior month. Within transportation, the gain was led by a 13.1 percent increase in defense aircraft orders. For April, nondefense aircraft and motor vehicles declined after gaining in March.
Outside of transportation, orders were mixed. Increases were seen in fabricated metals, electrical equipment, and "other." Declines were seen in primary metals and in computers & electronics.
Investment in equipment eased after a robust March. Nondefense capital goods orders excluding aircraft dipped 1.2 percent, following a 4.7 percent jump in March. Shipments for this series slipped 0.4 percent after gaining 2.1 percent the prior month.
Even though April's results were mixed, taking into account broad-based strong March numbers, momentum in manufacturing is upward. And more recent manufacturing surveys add to this view.
 Pending home sales rose 0.4 percent in April, building slightly on top of March's 3.4 percent surge and offering a positive indication for final sales of existing homes. April's gain was narrow, however, centered almost entirely in the Midwest where contract signings rose 5.0 percent. Both the South and West, two very closely followed regions, fell slightly in the month. Pending home sales rose 0.4 percent in April, building slightly on top of March's 3.4 percent surge and offering a positive indication for final sales of existing homes. April's gain was narrow, however, centered almost entirely in the Midwest where contract signings rose 5.0 percent. Both the South and West, two very closely followed regions, fell slightly in the month.
The housing sector is getting a lift not only from spring weather following the unusually heavy winter but also from the dip underway in mortgage rates and the rise underway in supply as more homes come onto the market.
 Home prices gained in March but the recent trend appears to be a slowing in price increases over recent months. Home prices gained in March but the recent trend appears to be a slowing in price increases over recent months.
Home price appreciation was strong in the latest month with Case-Shiller's 20-city adjusted index up a higher-than-expected 1.2 percent in March. The year-on-year rate, however, slowed very slightly, at an adjusted 12.4 percent versus the 13 percent range going back to September.
After months of nearly uniform increases, a couple of negative signs are popping up in the city-by-city breakdown. Still monthly rates were very strong led by cities in the West.
 According to the FHFA, home prices increased 0.7 percent in March on a seasonally adjusted basis, following a 0.6 percent boost the prior month. Expectations were for a 0.5 percent rise. According to the FHFA, home prices increased 0.7 percent in March on a seasonally adjusted basis, following a 0.6 percent boost the prior month. Expectations were for a 0.5 percent rise.
Gains for home prices were widespread with eight of nine Census regions showing price increases in March. Advances were led by a 4.6 percent rebound in New England. Only the East South Central Census region declined but following healthy increases in prior months.
The year-on-year rate for March posted at 6.4 percent, following 6.9 percent in February.
Home prices are not rising as fast as earlier in the recovery but the pace is still moderately strong. Housing is making moderate progress on the price front. Supply shortages continue to put upward pressure on home prices.
Growth in the nation's service sector is accelerating strongly based on Markit's sample where the composite index jumped to 58.4 versus 55.0 in final April and 54.2 in the flash reading for April. New business, in a special positive, was very strong, at 58.7 versus 55.1 in final April. Another positive is improvement in employment, up 1.9 points to a 53.1 level that, however, remains modest. Other readings include a gain for outstanding business and increasing strength for business expectations.
The second quarter is continuing to show improvement over the first quarter even though there have been monthly oscillations. On average, the consumer and housing sectors are making progress. However, housing may be decelerating—showing slower growth over the last few months.
This week's highlight is Friday's employment report for May. Also providing updates on the consumer sector will be motor vehicle sales and the ADP private employment report. The manufacturing sector is showing renewed vigor and early readings at the national level will come from this week's Markit PMI and ISM index.
The Markit PMI manufacturing flash index for mid-May was up noticeably, to 56.2 versus 55.4 in both the mid-month and final readings for April. Strong and sustaining growth in orders was a major highlight of the report, at 58.2 for new orders and at 55.9 for backlog orders. A negative, however, was lagging strength for the export orders which show only modest monthly growth at 51.5. Output for Markit's U.S. sample remained very strong, at 59.6 versus 58.2 in final April.
Markit PMI manufacturing index (final) Consensus Forecast for April 14: 56.2
Range: 55.8 to 56.5
The composite index from the ISM manufacturing survey for April rose 1.2 points to a better-than-expected level of 54.9. Employment, which has been very soft in this report, bounced 3.6 points higher to a respectable 54.7. New orders were at a solid 55.1, unchanged from March, with new export orders up 1.5 points to a very strong 57.0. Backlog orders were solid at 55.5. Production was little changed from March at 55.7—a still notably positive reading.
ISM manufacturing composite index Consensus Forecast for May 14: 55.5
Range: 54.6 to 56.6
Construction spending rebounded in March but not as much as expected. Outlays gained 0.2 percent after a 0.2 percent decline in February. Expectations were for a 0.6 percent boost. The latest gain was led by a 0.8 percent increase in private residential outlays, following no change in February. This was largely in the multifamily component which jumped 4.4 percent after a 2.1 percent boost in February. New one-family outlays edged up 0.2 percent in March, following a 0.3 percent decline the prior month. Public spending declined 0.6 percent after a 0.1 percent dip in February. Private nonresidential outlays rebounded 0.2 percent in March after dropping 0.5 percent in February.
Construction spending Consensus Forecast for April 14: +0.7 percent
Range: +0.4 to +1.2 percent
Sales of total light motor vehicles in April vehicle sales could not match the record setting pace of March but still proved very strong, at an annual pace of 16.0 million versus March's 16.4 million.
Motor vehicle domestic sales Consensus Forecast for May 14: 12.8 million-unit rate
Range: 12.6 to 13.0 million-unit rate
Motor vehicle total sales Consensus Forecast for May 14: 16.1 million-unit rate
Range: 16.1 to 16.3 million-unit rate
Factory orders rising 1.1 percent in March on top of February's revised gain of 1.5 percent. Orders for capital equipment were a top highlight in March, surging 3.5 percent excluding aircraft. This is a core reading for business investment and points to business confidence in the economic outlook. Of the report's two largest components, new orders for durables rose an impressive 2.9 percent that includes high single-digit monthly gains for household appliances, communications equipment, commercial aircraft, turbines & generators, and also computers. The non-durables component held back March's overall strength. This component, pulled down by weak orders for petroleum and coal, fell 0.6 percent. More recently from the advance report for April, durables orders advanced 0.8 percent, following a revised 3.6 percent jump in March.
Factory orders Consensus Forecast for April 14: +0.5 percent
Range: -0.2 to +0.9 percent
ADP private payroll employment for April posted 220,000 gain versus an upwardly revised 209,000 in March. From the two-day later BLS employment situation report, private employment increased 273,000 in April.
ADP private payrolls Consensus Forecast for May 14: 210,000
Range: 120,000 to 235,000
The U.S. international trade gap in March narrowed to $40.4 billion from $41.9 billion in February. Exports rebounded 2.1 percent, following a 1.3 percent decline in February. Imports gained 1.1 percent after no gain the month before. The shrinking of the trade gap was led by a narrowing of the oil deficit with a rebound in the services surplus contributing. The petroleum deficit narrowed to $18.6 billion from $20.0 billion in February. The services surplus rebounded to $20.4 billion in March from $19.5 billion the month before. The services surplus in February had been bumped down by license fees for coverage of the winter Olympics. The goods excluding petroleum gap expanded to $40.6 billion from $39.4 billion in February.
International trade balance Consensus Forecast for April 13: -$41.0 billion
Range: -$43.0 billion to -$38.6 billion
Nonfarm business productivity was hit by adverse winter weather in the first quarter. Productivity in the first quarter fell an annualized 1.7 percent after a 2.3 percent advance the prior quarter. Unit labor costs jumped an annualized 4.2 percent after slipping 0.4 percent in the fourth quarter. The drop in productivity reflected a 0.3 percent rise in non-farm output, following a boost of 3.8 percent in the fourth quarter. Hours worked increased 2.0 percent in the first quarter after rising an annualized 1.4 in the fourth quarter. Compensation firmed to a 2.4 percent rate after rising 1.9 percent in the fourth quarter.
Nonfarm Business Productivity Consensus Forecast for revised Q1 14: -2.9 percent annual rate
Range: -3.4 to -2.0 percent annual rate
Unit Labor Costs Consensus Forecast for revised Q1 14: +5.2 percent annual rate
Range: +4.0 to +5.7 percent annual rate
The Markit PMI services flash index for mid-May index jumped to 58.4 versus 55.0 in final April and 54.2 in the flash reading for April. New business, in a special positive, was very strong, at 58.7 versus 55.1 in final April. Another positive was improvement in employment, up 1.9 points to a 53.1 level that, however, remains modest. Other readings include a gain for outstanding business and increasing strength for business expectations.
No consensus numbers are available for this month's report
The composite index from the ISM non-manufacturing survey in April rose a solid 2.1 points to a 55.2 level. New orders, the most important detail in the report, surged 4.8 points to a 58.2 reading that was the highest since August. Export business, reflecting strength in information and management services, was a highlight of the report, at 57.0. Business activity was especially strong, at 60.9 for a 7.5 point gain and the first plus-60 reading, also since August.
ISM non-manufacturing composite index Consensus Forecast for May 14: 55.3
Range: 54.5 to 57.5
The Beige Book being prepared for the June 117-18 FOMC meeting are released this afternoon. Traders likely will focus on labor market conditions overall as the unemployment has come down but largely due to lower participation rates. Also, jobless claims are down but is hiring up in the Fed Districts'
Initial jobless claims fell sharply in the May 24 week, down 27,000 to 300,000. The 4-week average was down a very sharp 11,250 to a new recovery low of 311,500. Continuing claims were also down, falling 17,000 in lagging data for the May 17 week to a new recovery low of 2.631 million. The 4-week average was down 33,000 to 2.655 million, also a recovery low. The unemployment rate for insured workers, also at a recovery low, held steady at 2.0 percent. There were no special factors in the latest report.
Jobless Claims Consensus Forecast for 5/31/14: 310,000
Range: 300,000 to 319,000
Nonfarm payroll employment increased 288,000 in April after a 203,000 gain in March and a 222,000 increase in February. The net revision for the prior two months was up 36,000. The unemployment rate fell sharply to 6.3 percent from 6.7 percent in March. The labor force fell a whopping 806,000 in April. The U-6 underemployment rate declined to 12.3 percent from 12.7 percent in March. Average weekly hours held steady at 34.5 hours. Average hourly earnings for all workers were unchanged after nudging up 0.1 percent in March. The labor market is improving but a weather-related rebound may have come into play.
Nonfarm payrolls Consensus Forecast for May 14: 213,000
Range: 110,000 to 240,000
Private payrolls Consensus Forecast for May 14: 215,000
Range: 177,000 to 225,000
Unemployment rate Consensus Forecast for May 14: 6.4 percent
Range: 6.2 to 6.5 percent
Average workweek Consensus Forecast for May 14: 34.5 hours
Range: 34.5 to 34.5 hours
Average hourly earnings Consensus Forecast for May 14: +0.2 percent
Range: +0.1 to +0.4 percent
Consumer credit outstanding expanded by a sharp $17.5 billion in March but, as has been the case since the 2008 financial meltdown, the gain was centered almost entirely in non-revolving credit which continues to get a boost from strong vehicle sales and the government's acquisition of school loans from private lenders. Revolving credit is barely showing any life, up $1.1 billion following a decline of $2.7 billion in February.
Consumer credit Consensus Forecast for April 14: +$15.0 billion
Range: +$13.3 billion to +$20.5 billion
R. Mark Rogers is the author of The Complete Idiot's Guide to Economic Indicators, Penguin Books.
He can also be found on a weekly broadcast talking about the U.S. economy, the easiest way to find him is by going to iTunes and searching for "Simply Economics."
Econoday Senior Writer Mark Pender contributed to this article.
|
