|
The second quarter rebound continues for manufacturing. However, housing is a question mark. But monetary policy remains loose, boosting equities.
 Equities posted steadily healthy gains this past week. Fed policy is encouraging and still leaves other investment options as largely unattractive. Economic news has mostly been supportive. Stocks have risen despite skittish news from overseas which weighed on equities all week. M&A activity has helped lift equities. Equities posted steadily healthy gains this past week. Fed policy is encouraging and still leaves other investment options as largely unattractive. Economic news has mostly been supportive. Stocks have risen despite skittish news from overseas which weighed on equities all week. M&A activity has helped lift equities.
Monday was an information crunching day. U.S. industrial production was robust. M&A activity included medical device giant Medtronic which unveiled a $42.9 billion takeover of Irish rival Covidien. Russia cut off natural gas supplies to Ukraine in a dispute over unpaid bills. Traders worried about events in Iraq. But overall, economic news and M&A activity led to small gains at the start of the week. Tuesday, investors shrugged off mildly disappointing economic reports on inflation (CPI warm) and housing (starts and permits soften). They also kept a wary eye on the turmoil in Iraq. They were also awaiting Wednesday's FOMC policy announcement and Chair Janet Yellen's post meeting press conference.
 At midweek, traders reacted positively to the Federal Reserve's monetary policy announcement sending stocks higher especially in afternoon trading day. Traders were encouraged by continued loose monetary stance even though taper is still on as planned. On Thursday, it was back to encouraging economic news, with a dip in jobless claims, healthy Philly Fed, and stronger-than-expected leading indicators. The week ended quietly but still on a positive note. Stocks continued upward on momentum from the Fed's policy decision. Energy stocks were notably strong from worries about Iraqi insurgents disrupting oil supplies. At midweek, traders reacted positively to the Federal Reserve's monetary policy announcement sending stocks higher especially in afternoon trading day. Traders were encouraged by continued loose monetary stance even though taper is still on as planned. On Thursday, it was back to encouraging economic news, with a dip in jobless claims, healthy Philly Fed, and stronger-than-expected leading indicators. The week ended quietly but still on a positive note. Stocks continued upward on momentum from the Fed's policy decision. Energy stocks were notably strong from worries about Iraqi insurgents disrupting oil supplies.
Overall, favorable economic news (including Fed news) outweighed worries about the Ukraine and Iraq.
Equities were up this past week. The Dow was up 1.0 percent; the S&P 500, up 1.4 percent; the Nasdaq, up 1.3 percent; the Russell 2000, up 2.2 percent; and the Wilshire 5000, up 1.5 percent.
For the year-to-date, major indexes are up as follows: the Dow, up 2.2 percent; the S&P 500, up 6.2 percent; the Nasdaq, up 4.6 percent; the Russell 2000, up 2.1 percent; and the Wilshire 5000, up 5.7 percent.
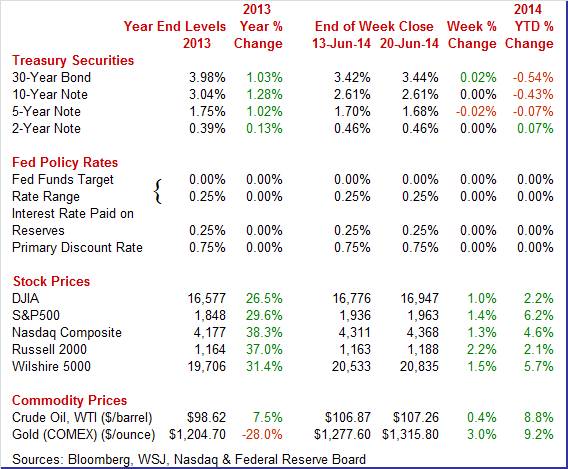
Weekly percent change column reflects percent changes for all components except interest rates. Interest rate changes are reflected in simple differences.
 Treasury yields were essentially unchanged this past week although there were a few mild daily swings. Treasury yields were essentially unchanged this past week although there were a few mild daily swings.
After a flat Monday (little news), rates firmed Tuesday on higher-than-expected CPI numbers. But this was more than offset Wednesday on news from the Fed confirming continuing loose monetary policy, reflecting the FOMC statement, quarterly forecasts, and chair press conference.
Yields firmed a bit Thursday after favorable economic indicators. Friday was flat.
For this past week Treasury rates were little changed as follows: 3-month T-bill, down 2 basis points; the 2-year note, unchanged; the 5-year note, down 2 basis points; the 7-year note, down 1 basis point; the 10-year note, unchanged; and the 30-year bond, up 2 basis points.
 It was a quiet week in oil markets as key events had already been priced in—including jockeying between Ukraine and Russia and also rebellion in Iraq. There were no daily swings higher than half a buck except slightly so on Friday. The spot price of West Texas Intermediate rose somewhat over half a dollar Friday on increased belief that the U.S. would send some 300 "advisors" (aka specialized military forces) to Iraq to stabilize the Iraqi government against insurgents. It was a quiet week in oil markets as key events had already been priced in—including jockeying between Ukraine and Russia and also rebellion in Iraq. There were no daily swings higher than half a buck except slightly so on Friday. The spot price of West Texas Intermediate rose somewhat over half a dollar Friday on increased belief that the U.S. would send some 300 "advisors" (aka specialized military forces) to Iraq to stabilize the Iraqi government against insurgents.
Net for the week, the spot price for West Texas Intermediate nudged up 39 cents per barrel to settle at $107.26.
The Fed in its latest policy statement indicated continued loose monetary policy. Manufacturing is picking up while housing is mixed.
 The Fed acted largely as expected. Policy rates were unchanged and taper remains on schedule. The Fed funds target rate remains at a range of zero to 0.25 percent. Bond purchases were cut another $10 billion to $35 billion, starting in July. The Fed acted largely as expected. Policy rates were unchanged and taper remains on schedule. The Fed funds target rate remains at a range of zero to 0.25 percent. Bond purchases were cut another $10 billion to $35 billion, starting in July.
Regarding the economy, the Fed is still concerned about the labor market.
"Information received since the Federal Open Market Committee met in April indicates that growth in economic activity has rebounded in recent months. Labor market indicators generally showed further improvement. The unemployment rate, though lower, remains elevated."
Taper remains on schedule despite the latest firming in consumer price inflation. There was no mention of the latest CPI report-which, of course, was just one month of data. Also, policy rates are expected to remain low for some time as indicated by policy rate forecasts still putting the first rise in 2015.
To no one's surprise, the Fed's GDP forecast was downgraded somewhat due to adverse weather in the first quarter. The Fed's statement was largely as expected as well as forecasts.
 During Q&A at the chair press conference, Yellen described inflation data as "noisy"-indicating that the FOMC is being patient about interpreting CPI data. She sees the timing of the change in policy rates being dependent on the pace of the economy. During Q&A at the chair press conference, Yellen described inflation data as "noisy"-indicating that the FOMC is being patient about interpreting CPI data. She sees the timing of the change in policy rates being dependent on the pace of the economy.
There were only minor changes to Fed policy timing. Most FOMC participants see the first rise in the fed funds rate to be in 2015.
Regarding the Fed's balance sheet, the Fed is debating continuance of reinvestment of principal on rollovers of Treasuries and agency debt. The Fed chair anticipates announcing a revised exit strategy to be announced later this year. Though not stated, she likely means reverse repos which have been practiced in recent weeks as trial balloons and to determine practical issues in heavier-duty unwinding of the balance sheet.
Yellen emphasized that the Fed is taking a "balanced approach" to monetary policy and is being very attentive to unfolding economic events.
 Housing seems to be at a modest tipping point. May data suggest slowing but June data suggest possible improvement. Housing seems to be at a modest tipping point. May data suggest slowing but June data suggest possible improvement.
Housing took a step back in May. Starts fell a monthly 6.5 percent but followed a strong 12.7 percent spike in April. The 1.001 million unit pace was up 9.4 percent on a year-ago basis and fell short of expected 1.036 million units.
Single-family starts dropped 5.9 percent after a 4.6 percent rise. Multifamily starts declined 7.6 percent, following a 29.2 percent spike in April.
Building permits followed a similar pattern, suggesting some moderation in construction. Permits fell 6.4 percent after a 5.9 percent rise in April. Permits posted at 0.991 million units and were down 1.9 percent on a year-ago basis. Analysts forecast 1.062 million units.
 The latest housing starts report was disappointing. But there may be improvement ahead. The June housing market index (HMI) rose to 49 from May's reading of 45. So, the question is whether housing rebounds in June or not. The HMI suggests that at least the single-family sector improves. And as always, the multifamily component is volatile. But, on average, that sector is trending upward. Notably, Q2 starts are still running above the Q1 average. This points to improvement in residential investment in Q2 GDP. The latest housing starts report was disappointing. But there may be improvement ahead. The June housing market index (HMI) rose to 49 from May's reading of 45. So, the question is whether housing rebounds in June or not. The HMI suggests that at least the single-family sector improves. And as always, the multifamily component is volatile. But, on average, that sector is trending upward. Notably, Q2 starts are still running above the Q1 average. This points to improvement in residential investment in Q2 GDP.
 The manufacturing sector appears to be making a comeback. Industrial production posted a strong 0.6 percent rebound in May after a 0.3 percent dip the month before. May topped analysts' expectations of a 0.5 percent gain. The manufacturing component jumped 0.6 percent after slipping 0.1 percent in April. The May boost matched market expectations. Mining increased 1.3 percent in May after a 1.6 percent boost the month before. Utilities declined 0.8 percent, following a 4.5 percent plunge in April. The manufacturing sector appears to be making a comeback. Industrial production posted a strong 0.6 percent rebound in May after a 0.3 percent dip the month before. May topped analysts' expectations of a 0.5 percent gain. The manufacturing component jumped 0.6 percent after slipping 0.1 percent in April. The May boost matched market expectations. Mining increased 1.3 percent in May after a 1.6 percent boost the month before. Utilities declined 0.8 percent, following a 4.5 percent plunge in April.
Manufacturing excluding motor vehicles increased 0.5 percent in May after a 0.1 percent decrease in April.
The overall capacity utilization rate rose to 79.1 percent from 78.9 percent.
Essentially, manufacturing is making a comeback. The latest production numbers will bolster the view that second quarter GDP growth will be notably stronger than the first quarter.
Manufacturing momentum is carrying forward to June based on the latest regional manufacturing surveys.
 Activity is very strong and steady in the New York manufacturing sector based on the Empire State index which firmed slightly to a 4-year high of 19.28. Growth in new orders is exceptionally strong, at another 4-year high of 18.36. Activity is very strong and steady in the New York manufacturing sector based on the Empire State index which firmed slightly to a 4-year high of 19.28. Growth in new orders is exceptionally strong, at another 4-year high of 18.36.
Shipments were strong, at 14.15, and manufacturers in the region continue to hire, at 10.75 for the fourth double-digit gain in a positive streak that goes back six months. Manufacturers in the region were also aggressively building their inventories, at 9.68 for a 3-year high.
Turning to the Philly Fed report, acceleration is very strong right now in the Mid-Atlantic manufacturing region. The general business activity index rose 2.4 points to 17.8 in June to signal the strongest rate of monthly growth since October last year. New orders rose 6.1 points from May to 16.8 with unfilled orders turning higher, at a very strong 11.5 for a 14.0 point gain.
 Inventories are being drawn down as shipments, at 15.5, move higher. There are two special positives in the latest report, acceleration for employment to 11.9 for a 4.1 point gain, and a major gain for the general six-month outlook, to 52.0 from 37.4. Both of these gains ultimately reflect confidence in order books. Inventories are being drawn down as shipments, at 15.5, move higher. There are two special positives in the latest report, acceleration for employment to 11.9 for a 4.1 point gain, and a major gain for the general six-month outlook, to 52.0 from 37.4. Both of these gains ultimately reflect confidence in order books.
Both the reports from the Philly and New York Feds show a major upswing beginning in the spring following the heavy winter which hit these two Fed districts especially hard.
 Consumer price inflation was warmer than expected in May. Energy and food were particularly strong. Overall CPI inflation posted at 0.4 percent, following 0.3 percent in April. Market expectations were for 0.2 percent. Excluding food & energy the monthly rise was 0.3 percent in May after a 0.2 percent gain the month before. May topped analysts' forecast for 0.2 percent and was the largest increase since August 2011. Consumer price inflation was warmer than expected in May. Energy and food were particularly strong. Overall CPI inflation posted at 0.4 percent, following 0.3 percent in April. Market expectations were for 0.2 percent. Excluding food & energy the monthly rise was 0.3 percent in May after a 0.2 percent gain the month before. May topped analysts' forecast for 0.2 percent and was the largest increase since August 2011.
Energy spiked 0.9 percent in May, following 0.3 percent in April. Gasoline rose 0.7 percent after spiking 2.3 percent in April. Food jumped 0.5 percent, following 0.4 percent the month before.
 Within the core, the indexes for shelter and airline fares, medical care, apparel, and new vehicles all increased in May. The indexes for household furnishings and operations and for used cars and trucks declined. Within the core, the indexes for shelter and airline fares, medical care, apparel, and new vehicles all increased in May. The indexes for household furnishings and operations and for used cars and trucks declined.
On a not seasonally adjusted based, headline inflation on a year ago basis was up 2.1 percent while excluding food and energy was up 2.0 percent in May.
Inflation in May was stronger than expected. This will have the hawks at the Fed speaking a little louder-but it is just one month of data. Also, the labor market is improving but it is not robust.
 Strength is solid and broad-based in the index of leading economic indicators which rose 0.5 percent in May, accelerating from a revised 0.3 percent gain in April. The yield spread, reflecting the Fed's near zero rate policy, once again is the leading component by a wide margin. But there were still solid positives for jobless claims, which point to improvement in the labor market, and the factory workweek, which point to gains for income and output. The report's leading credit index is also solid pointing to improved lending strength. Strength is solid and broad-based in the index of leading economic indicators which rose 0.5 percent in May, accelerating from a revised 0.3 percent gain in April. The yield spread, reflecting the Fed's near zero rate policy, once again is the leading component by a wide margin. But there were still solid positives for jobless claims, which point to improvement in the labor market, and the factory workweek, which point to gains for income and output. The report's leading credit index is also solid pointing to improved lending strength.
A negative in the report, however, was weakness in building permits in what points to continuing struggles for the housing sector. Other details in the report include a surprisingly slow back-to-back rise of 0.1 percent for the coincident index, marginal gains that are not consistent with strong expectations for second-quarter GDP growth. The lagging index is steady for a second month at a modest plus 0.2 percent.
The economy is gradually improving but the Fed is not taking chances. Monetary policy is on planned schedule and staying loose. Overall—as with leading indicators—news points to healthier growth.
Housing has been sputtering in recent months and the focus is on this sector. Home prices have been decelerating and updates from FHFA and Case-Shiller will stand out along with existing and new home sales. Also, manufacturing has shown new signs of life and the durables report will confirm or not whether strength is national. Finally, the highlight for the consumer sector is the personal income report.
The Chicago Fed National Activity Index showed a sharp deceleration for the economy in April, to minus 0.32 from March's revised plus 0.34. The biggest negative was a sizable reversal in production which was hit by the heavy 0.4 percent decline in the manufacturing component of the industrial production report. Consumption & housing is still pulling down activity while employment, importantly, is an increasing positive. The sales/orders/inventories component remains flat.
No consensus numbers are available for this month's report
The Markit PMI manufacturing index (final) for May, at 56.4, was 2 tenths higher than the mid-month reading. The final reading for April was 55.4. Order readings were very strong led by 58.8 for new orders and including 56.0 for backlog orders. Growth in new export orders is lagging but is improving, at a plus 50 reading of 52.2 for a 5 tenths gain from April.
Markit PMI manufacturing flash index Consensus Forecast for June 14: 56.5
Range: 56.0 to 58.4
Existing home sales finally showed some life in April, up 1.3 percent to a 4.65 million annual rate for only the second gain in the last nine months. And the key single-family component was also showing life, up 0.5 percent for the first gain of the year. Sales of condos, which have been much stronger than sales of single-family homes, jumped 7.3 percent in April. In a positive for the outlook, supply was rushing into the market, to 2.29 million units for a 16.8 percent increase from March. Supply at the monthly sales rate was sharply higher, to 5.9 months from March's 5.1 months.
Existing home sales Consensus Forecast for May 14: 4.75 million-unit rate
Range: 4.68 to 4.80 million-unit rate
The FHFA purchase only house price index increased 0.7 percent in March on a seasonally adjusted basis, following a 0.6 percent boost the prior month. Gains for home prices were widespread with eight of nine Census regions showing price increases in March. Advances were led by a 4.6 percent rebound in New England. Only the East South Central Census region declined but following healthy increases in prior months.
FHFA purchase only house price index Consensus Forecast for April 14: +0.5 percent
Range: +0.4 to +0.9 percent
The S&P/Case-Shiller 20-city home price index (SA) was up a higher-than-expected 1.2 percent in March. The year-on-year rate, however, slowed very slightly, to an adjusted 12.4 percent versus the 13 percent range going back to September. After months of nearly uniform increases, a couple of negative signs are popping up in the city-by-city breakdown. Still monthly rates were very strong led by cities in the West.
The S&P/Case-Shiller 20-city HPI (SA, m/m) Consensus Forecast for April 14: +0.8 percent
Range: +0.4 to +1.9 percent
The S&P/Case-Shiller 20-city HPI (NSA, m/m) Consensus Forecast for April 14: +0.8 percent
Range: +0.3 to +1.0 percent
The S&P/Case-Shiller 20-city HPI (NSA, y/y) Consensus Forecast for April 14: +11.4 percent
Range: +10.2 to +12.0 percent
New home sales in April jumped 6.4 percent jump to a higher-than-expected 433,000 annual rate. Also positive was an upward net revision of 11,000 to the two prior months. But, unlike the existing home sales report that showed a sudden swelling in supply, supply on the new home side remains scarce and will remain a negative for sales. Supply was hardly changed on the month, at 192,000 units for sale, while supply at the current sales rate fell to 5.3 months from March's 5.6 months.
New home sales Consensus Forecast for May 14: 441 thousand-unit annual rate
Range: 425 thousand to 461 thousand-unit annual rate
The Conference Board's consumer confidence index in May held steady at moderately positive levels with the Conference Board's measure up 1.3 points to a third straight plus 80 level at 83.0. The present situation component for May points to strength relative to April, at 80.4 versus 78.5 in a reading that hints at monthly gains for consumer spending for May. The expectations component also showed a gain, up 9 tenths from April to 84.8.
Consumer confidence Consensus Forecast for June 14: 83.7
Range: 81.0 to 86.0
The Richmond Fed manufacturing index slowed to 3 in May versus 10 in April though backlog orders do show a rare gain to 1 versus minus 9 and minus 13 in the prior two months. But shipments and employment, both rising smartly to 10, are strong positives. Price readings are steady and moderate with inventory readings pointing to moderate and desired builds.
Richmond Fed manufacturing index Consensus Forecast for June 14: 7
Range: 5 to 12
Durable goods orders or April came in higher than expected, thanks to transportation. Also, March was revised significantly higher—reflecting benchmark revisions. Durables orders advanced 0.6 percent, following a 3.7 percent jump in March. Excluding transportation, durables orders edged up 0.3 percent in April, following a 3.0 percent spike the month before. Outside of transportation, orders were mixed. Increases were seen in fabricated metals, electrical equipment, and "other." Declines were seen in primary metals and in computers & electronics.
New orders for durable goods Consensus Forecast for May 14: +0.4 percent
Range: -1.7 percent to +1.0 percent
New orders for durable goods, ex-trans., Consensus Forecast for May 14: +0.3 percent
Range: +0.1 percent to +0.7 percent
GDP growth for the first quarter was revised down to an annualized minus 1.0 percent from the advance estimate of plus 0.1 percent and compared to the fourth quarter's 2.6 percent. Analysts had expected a downward revision to minus 0.5 percent. The decline was the first since a 0.7 percent dip in the third quarter of 2011. Final sales of domestic demand gained 0.6 percent after a 2.7 percent boost in the fourth quarter. Final sales to domestic purchasers actually were nudged up to 1.6 percent, matching the pace in the prior quarter. The overall price index was unrevised at 1.3 percent. Fourth quarter growth was 1.6 percent. Core chain prices rose 1.3 percent, equaling the advance figure.
Real GDP Consensus Forecast for third estimate Q1 14: -1.8 percent annual rate
Range: -2.4 to -1.0 percent annual rate
GDP price index Consensus Forecast for third estimate Q1 14: +1.3 percent annual rate
Range: +1.2 to +1.3 percent annual rate
The Markit PMI services index accelerated strongly in May and finished the month far over 50 at 58.1 versus 58.4 at mid-month and versus 55.0 in final the reading for April. This is the highest reading since March last year. New business shows strong acceleration, at 58.7 in May versus April's 55.1, while outstanding business moved out of contraction to 52.4 versus 47.4 in April. Business expectations were especially bright, at 79.3 for a 2.9 point gain. Less bright, unfortunately, was employment which is not much over 50 at 52.8. Still, employment in May shows better growth than April's 51.2.
No consensus numbers are available for this month's report
Initial jobless claims for the June 14 week provided a boost to the outlook for the June employment report. Initial jobless claims data showed a 6,000 dip to 312,000. The 4-week average, at 311,750, is down 11,000 from mid-month May. The mid-month readings compare the sample weeks of the government's monthly employment report.
Jobless Claims Consensus Forecast for 6/21/14: 310,000
Range: 305,000 to 315,000
Personal income rose 0.3 percent in April but followed a robust 0.5 percent boost the month before. The key wages & salaries component followed a similar pattern, softening to 0.2 percent from a 0.6 percent jump in March. Personal spending dipped 0.1 percent after a 1.0 percent spike in March. Spending on durables, reflecting a pause in auto sales, fell 0.5 percent versus gains of 3.6 and 1.3 percent in the prior two months. Spending on services, however, also fell, down 0.2 percent on a decline in utilities and healthcare after a 0.5 percent rise in March. In real terms, spending fell 0.3 percent following the prior month's 0.8 percent surge. Price data remain muted, up 0.2 percent overall and up 0.2 percent ex-food and energy. Year-on-year price rates are at plus 1.6 percent and 1.4 percent for the core. While PCE price inflation is still below the Fed goal of 2 percent, it has been firming in recent months.
Personal income Consensus Forecast for May 14: +0.4 percent
Range: +0.2 to +0.5 percent
Personal consumption expenditures Consensus Forecast for May 14: +0.4 percent
Range: +0.3 to +0.6 percent
PCE price index Consensus Forecast for May 14: +0.3 percent
Range: +0.2 to +0.3 percent
Core PCE price index Consensus Forecast for May 14: +0.2 percent
Range: +0.1 to +0.2 percent
The Kansas City Fed manufacturing index expanded solidly in May, and producers' expectations for future factory activity remained at healthy levels. Most price indexes increased somewhat, particularly current selling prices. The month-over-month composite index was 10 in May, up from 7 in April and equal to 10 in March. Other month-over-month indexes were mixed. The production index inched higher from 12 to 14, and the new orders and employment indexes also rose. In contrast, the shipments index fell from 14 to 5, and the order backlog and new orders for exports indexes also decreased. The raw materials inventory index increased from minus 1 to 11, and the finished goods inventory index also edged up.
Kansas City Fed manufacturing index Consensus Forecast for June 14: 9
Range: 5 to 14
The Reuter's/University of Michigan's consumer sentiment index for preliminary June looked soft, at a lower-than-expected 81.2, but some of the details were positive in the consumer sentiment report, especially a gain for current conditions. The current conditions component was up 1.0 point from final May to 95.4. This offers an early signal of steady strength, if not a slight increase in strength, for June consumer activity. Weakness in the report was in the expectations component which was down 1.5 points to 72.2. Expectations usually center on job and income prospects, which are weak links in the economic outlook.
Consumer sentiment Consensus Forecast for final June 14: 81.9
Range: 81.0 to 83.0
R. Mark Rogers is the author of The Complete Idiot's Guide to Economic Indicators, Penguin Books.
He can also be found on a weekly broadcast talking about the U.S. economy, the easiest way to find him is by going to iTunes and searching for "Simply Economics."
Econoday Senior Writer Mark Pender contributed to this article.
|
