|
Simply Economics will be on vacation next week but will return July 25
Although it was a quiet week for indicators, it was not quiet in the financial markets. Several concerns bumped down stocks—including from overseas. Meanwhile, the Fed is working on its exit strategy and the economy actually improved.
 Major indexes ended the week down—especially small caps and techs. Major indexes ended the week down—especially small caps and techs.
On Monday, traders reconsidered the prior week's record highs and pulled back somewhat. Also, traders worried that the Fed will start raising rates sooner than many believe. Stocks retreated for a second day as investors were cautious ahead of the start of earnings season which would begin after markets closed for the day on Tuesday. The day's declines were led by the Nasdaq which fell 1.3 percent, heavily due to sharp decreases in key Internet company stocks.
 At mid-week, equities rebounded somewhat on optimism about earnings. Alcoa rose sharply after kicking off earnings season with results that topped forecasts. Also, minutes from the last FOMC meeting showed the Bank has begun detailing how it will end its easy monetary policy. Many traders saw the minutes to indicate no change in planned policy changes—which means continued low policy rates. At mid-week, equities rebounded somewhat on optimism about earnings. Alcoa rose sharply after kicking off earnings season with results that topped forecasts. Also, minutes from the last FOMC meeting showed the Bank has begun detailing how it will end its easy monetary policy. Many traders saw the minutes to indicate no change in planned policy changes—which means continued low policy rates.
Stocks fell Thursday despite a favorable drop in initial jobless claims—and the reason came from Europe. Shares declined as concerns about the financial health of Portugal's top listed bank gave investors a reason to cash in recent gains and head to safety. Losses in European markets quickly spread to the U.S. The week closed on a positive note with a modest rebound, largely on bargain hunting—especially for some Internet stocks with Amazon and EBay up notably.
Equities were down this past week. The Dow was down 0.7 percent; the S&P 500, down 0.9 percent; the Nasdaq, down 1.6 percent; the Russell 2000, down 4.0 percent; and the Wilshire 5000, down 1.3 percent.
For the year-to-date, major indexes are mostly up as follows: the Dow, up 2.2 percent; the S&P 500, up 6.4 percent; the Nasdaq, up 5.7 percent; the Russell 2000, down 0.3 percent; and the Wilshire 5000, up 5.7 percent.
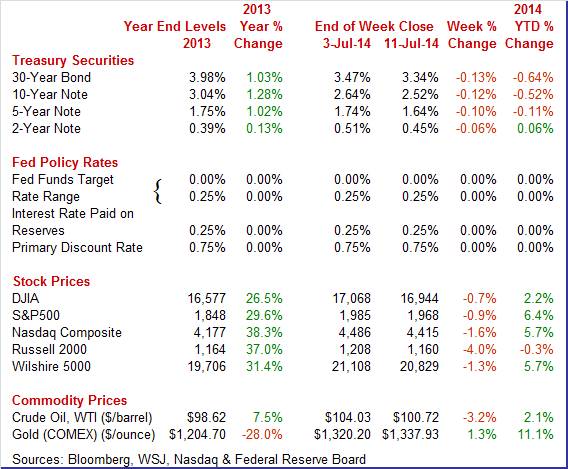
Weekly percent change column reflects percent changes for all components except interest rates. Interest rate changes are reflected in simple differences.
 Treasury yields were down notably this past week with flight to safety the primary reason as economic news was light but positive. The biggest swing down for rates was Tuesday but yields edged down each of the other trading days. Treasury yields were down notably this past week with flight to safety the primary reason as economic news was light but positive. The biggest swing down for rates was Tuesday but yields edged down each of the other trading days.
Monday was a relatively quiet day but traders began to reconsider the view that rates are headed up soon and moved back into Treasuries. Tuesday, rates fell moderately after a reasonably healthy 3-year auction and on the continued reconsideration that Friday's employment report was overblown and that the recovery is still soft.
On Wednesday, bond traders took a different view than stock traders as yields eased after the release of Fed FOMC minutes indicated that policy is on track for balance-sheet unwinding and that rate increases will not be hurried. Yields slipped marginally Thursday on worries about the impact of Portugal's Banco Espirito Santo SA after its parent company missed debt payments. Rate declines on both Thursday and Friday reflected outflow from equities to safe havens after equity declines in Europe spread to the U.S.
For this past week Treasury rates were down as follows: the 2-year note, down 6 basis points; the 5-year note, down 10 basis points; the 7-year note, down 11 basis points; the 10-year note, down 12 basis points; and the 30-year bond, down 13 basis points. The 3-month T-bill firmed 2 basis points.
 The spot price of West Texas Intermediate fell notably, closing the week below $101 per barrel. The spot price of West Texas Intermediate fell notably, closing the week below $101 per barrel.
After quiet Monday and Tuesday, crude fell Wednesday about $1-1/2 per barrel on a boost in supplies at Cushing. Thursday saw a moderate rise of somewhat under a dollar a barrel on belief that the U.S. economy is improving, reflecting a decline in initial jobless claims and continued loose monetary policy. Friday was the biggest daily swing—down over $2 per barrel. Iraq came into play after Kurdish authorities took over the Bai Hassan and Kirkuk oilfields. Also weighing on prices not just on Friday were improvement in Libyan production and exports and the lack of disruption of Iraq's southern oilfields as civil strife has not moved south in that country.
Net for the week, the spot price for West Texas Intermediate dropped $3.31 per barrel to settle at $100.72.
During a light week for economic news, the consumer sector was favorable while the Fed continued to discuss its plans for unwinding quantitative easing.
 According to the minutes of the June 17 and June 18 FOMC meeting, the Federal Reserve intends to end its bond-buying program in October provided the economy continues to grow. The FOMC will continue to announce the fed funds target but suggested that they would continue to use a range rather than a fixed point target. In order to start unwinding the balance sheet the Fed may stop reinvestment of paid principal on bonds starting with or after the first policy rate increase—which generally is expected no later than mid-2015. Reinvestments are to be curtailed gradually. According to the minutes of the June 17 and June 18 FOMC meeting, the Federal Reserve intends to end its bond-buying program in October provided the economy continues to grow. The FOMC will continue to announce the fed funds target but suggested that they would continue to use a range rather than a fixed point target. In order to start unwinding the balance sheet the Fed may stop reinvestment of paid principal on bonds starting with or after the first policy rate increase—which generally is expected no later than mid-2015. Reinvestments are to be curtailed gradually.
 Interest on excess reserves (IOER) will be the key tool and reverse repos will play a supporting role. Discussion included having a 20 basis point spread (or more) between these two rates with IOER on the upper end and the reverse repo rate on the bottom. However, some members noted concern that the overnight reverse repo facility (ON RRP) could disrupt financial markets in times of stress. The possibility was seen that the facility's counterparties could shift investments toward the facility and away from financial and nonfinancial corporations. More details on the use of these rates are expected later this year. Interest on excess reserves (IOER) will be the key tool and reverse repos will play a supporting role. Discussion included having a 20 basis point spread (or more) between these two rates with IOER on the upper end and the reverse repo rate on the bottom. However, some members noted concern that the overnight reverse repo facility (ON RRP) could disrupt financial markets in times of stress. The possibility was seen that the facility's counterparties could shift investments toward the facility and away from financial and nonfinancial corporations. More details on the use of these rates are expected later this year.
On the economy, the minutes indicated that there is evidence that inflation "moved up recently." However, many participants noted that labor market slack remained elevated even though there has been improvement in this sector. Wage pressures were viewed as modest. Staff economists repeated the view of many Fed officials that first quarter GDP has held down by severe winter weather and that growth has bounced back in recent months. There was concern that housing has remained subdued on average.
Overall, the minutes confirm that policy changes are and will be moving slowly unless incoming data diverge from forecast. Taper is still on track to end new bond purchases later this year. Policy rates will rise gradually, likely starting no later than mid-2015. And the Fed will be telegraphing its upcoming moves.
 There is another sign of improvement in the labor market. There were 4.635 million job openings on the last business day of May, up somewhat from 4.464 million in April. The hires rate (3.4 percent) and separations rate (3.2 percent) were essentially unchanged in May. Within separations, the quits rate (1.8 percent) was unchanged and the layoffs and discharges rate (1.1 percent) was little changed. There is another sign of improvement in the labor market. There were 4.635 million job openings on the last business day of May, up somewhat from 4.464 million in April. The hires rate (3.4 percent) and separations rate (3.2 percent) were essentially unchanged in May. Within separations, the quits rate (1.8 percent) was unchanged and the layoffs and discharges rate (1.1 percent) was little changed.
The number of job openings was little changed for total private and government. The job openings level increased for nondurable manufacturing and for health care and social assistance in May, while it decreased for retail trade and for arts, entertainment, and recreation.
 However, hires are lagging openings. There were 4.718 million hires in May, little changed from 4.770 million in April. The lag in hires relative to openings may reflect difficulty of employers to find qualified workers. However, hires are lagging openings. There were 4.718 million hires in May, little changed from 4.770 million in April. The lag in hires relative to openings may reflect difficulty of employers to find qualified workers.
Total separations include quits, layoffs and discharges, and other separations. Total separations are referred to as turnover. Quits are generally voluntary separations initiated by the employee. Layoffs and discharges are involuntary separations initiated by the employer. Other separations include separations due to retirement, death, and disability, as well as transfers to other locations of the same firm.
There were 4.495 million total separations in May, little changed from April's 4.550 million. The quits rate was unchanged at 1.8 percent in May. The layoffs and discharges rate was little changed in May at 1.1 percent.
Overall, there is a slow uptrend in job openings. This report currently appears to be lagging the more recently favorable jobs reports for June and May, including gains in payroll jobs.
 After a robust April, one might think May would be soft. While May's gain was less than April's, it certainly was not soft. After a robust April, one might think May would be soft. While May's gain was less than April's, it certainly was not soft.
Consumer credit rose $19.6 billion in May following a revised gain of $26.1 billion in April. Gains for revolving credit, up $1.8 billion in the month following an $8.8 billion surge in April, point to strong credit card use which is a big plus for retailers.
Non-revolving credit, up $17.8 billion, continues to be driven by car loans as well as the government's acquisition of student loans. Based on not-seasonally-adjusted data, the boost in non-revolving credit was largely led by car loans.
The consumer sector has regained some prominence in the recovery and appears to be supporting the rebound in economic growth from the second quarter.
The Fed is staying on track with planned taper, policy rates are likely to remain low for some time although they likely will begin nudging up in 2015. And the consumer sector continues to improve.
This week's long list of releases covers a variety of sectors with highlights for the consumer, manufacturing, and housing. Retail sales slowed in May but will recent job gains boost June sales' Industrial production was robust in May but according to production worker hours, there could be some softening in June. This sector has provided key strength to the economy in recent months. Housing has been oscillating recently with starts falling sharply in May. Sluggish traffic at new home developments may point to sluggishness in starts.
Retail sales in May disappointed but upward revisions to April numbers were partly offsetting. Retail sales rose 0.3 percent in May, following a 0.5 percent jump the month before (originally up 0.1 percent). Strength was in motor vehicles which jumped 1.4 percent in May after a rise of 0.9 percent the prior month. Excluding motor vehicles sales edged up 0.1 percent, following a boost of 0.4 percent in April (originally flat). Forecasts were for 0.4 percent. Excluding motor vehicles and gasoline, sales were flat in May after a 0.3 percent increase the month before. Analysts expected 0.5 percent for May.
Retail sales Consensus Forecast for June 14: +0.6 percent
Range: +0.5 to +1.3 percent
Retail sales excluding motor vehicles Consensus Forecast for June 14: +0.6 percent
Range: +0.4 to +1.2 percent
Less motor vehicles & gasoline Consensus Forecast for June 14: +0.5 percent
Range: +0.3 to +1.0 percent
The Empire State manufacturing index in June firmed slightly to a 4-year high of 19.28. Growth in new orders was exceptionally strong, at another 4-year high of 18.36. Shipments were strong, at 14.15, and manufacturers in the region continued to hire, at 10.75 for the fourth double-digit gain in a positive streak that goes back six months.
Empire State Manufacturing Survey Consensus Forecast for July 14: 17.80
Range: 12.00 to 20.50
Import prices in May edged up 0.1 percent. Import prices of petroleum products jumped 1.1 percent in the month to nearly reverse April's 1.2 monthly downswing. Excluding petroleum, import prices fell 0.1 percent in May. Excluding all fuels including big downswings for coal and natural gas, import prices showed no change in May. Export prices in the latest month gained 0.1 percent. When excluding fuels and also food on the export side, export prices also showed no change.
Import prices Consensus Forecast for June 14: +0.4 percent
Range: +0.2 to +0.6 percent
Export prices Consensus Forecast for June 14: +0.2 percent
Range: 0.0 to +0.4 percent
The producer price index for final demand in May declined 0.2 percent, following an increase 0.6 percent in April. Total final demand excluding food & energy slipped 0.1 percent after gaining 0.5 percent in April. Analysts forecast a 0.1 percent rise. Total final demand excluding food, energy, and trade service was flat after a 0.3 percent increase in April. Energy dipped 0.2 percent in May after a 0.1 percent rise the month before. Foods declined 0.2 percent, following a 2.7 percent spike in April. Prices for final demand services moved down 0.2 percent in May, the first decrease since a 0.3-percent drop in February. The index for final demand goods fell 0.2 percent in May, the largest decrease since a 0.7-percent drop in April 2013.
PPI-FD Consensus Forecast for June 14: +0.3 percent
Range: +0.2 to +0.4 percent
PPI-FD ex Food & Energy Consensus Forecast for June 14: +0.2 percent
Range: +0.1 to +0.3 percent
Industrial production posted a strong 0.6 percent rebound in May after a 0.3 percent dip the month before. The manufacturing component jumped 0.6 percent after slipping 0.1 percent in April. Mining increased 1.3 percent in May after a 1.6 percent boost the month before. Utilities declined 0.8 percent, following a 4.5 percent plunge in April. Manufacturing excluding motor vehicles increased 0.5 percent in May after a 0.1 percent decrease in April. The overall capacity utilization rate rose to 79.1 percent from 78.9 percent.
Industrial production Consensus Forecast for June 14: +0.4 percent
Range: +0.1 to +0.7 percent
Manufacturing production component Consensus Forecast for June 14: +0.4 percent
Range: +0.2 to +0.5 percent
Capacity utilization Consensus Forecast for June 14: 79.2 percent
Range: 79.0 to 79.7 percent
NAHB housing market index for June was still below breakeven 50, at 49 which nevertheless was the best reading since January. And for the first time since January, the current sales component was back above 50, at 54 for a 6 point gain. The future sales component also moved higher, up 3 points to 59 and also the best reading since January. The third component, however, is traffic which remained in deep contraction at 36. Weakness in traffic underscores the lack of participation by first-time home buyers and the importance in the housing market of all cash buyers.
NAHB housing market index Consensus Forecast for July 14: 51
Range: 49 to 53
The Beige Book being prepared for the July 29-30 FOMC meeting are released 2:00 ET. Traders again will focus on signs of improvement in the labor market that could lead to modest acceleration in the timetable for increases in policy rates.
Housing starts took a step back in May. Starts fell a monthly 6.5 percent but followed a strong 12.7 percent spike in April. The 1.001 million unit pace was up 9.4 percent on a year-ago basis and fell short of expected 1.036 million units. Single-family starts dropped 5.9 percent after a 4.6 percent rise. Multifamily starts declined 7.6 percent, following a 29.2 percent spike in April. Building permits followed a similar pattern, suggesting some moderation in construction. Permits fell 6.4 percent after a 5.9 percent rise in April. Permits posted at 0.991 million units and were down 1.9 percent on a year-ago basis.
Housing starts Consensus Forecast for June 14: 1.026 million-unit rate
Range: 0.985 million to 1.085 million-unit rate
Housing permits Consensus Forecast for June 14: 1.038 million-unit rate
Range: 1.005 million to 1.090 million-unit rate
Initial jobless claims declined 11,000 in the July 5 week to a lower-than-expected 304,000. The 4-week average was down 3,500 to a 311,500 level that is slightly lower than the month-ago comparison. Continuing claims, in lagging data for the June 28 week, did rise 10,000 to 2.584 million but the 4-week average is at a new recovery low, down 8,000 to 2.571 million. The Labor Department noted that effects tied to the July 4 holiday will be most apparent in next week's report. Also, annual retooling in the auto sector will begin to become a special factor for the summer readings.
Jobless Claims Consensus Forecast for 7/12/14: 310,000
Range: 300,000 to 325,000
The general business conditions index of the Philadelphia Fed's Business Outlook Survey rose 2.4 points to 17.8 in June to signal the strongest rate of monthly growth since October last year. New orders rose 6.1 points from May to 16.8 with unfilled orders turning higher, at a very strong 11.5 for a 14.0 point gain.
Philadelphia Fed survey Consensus Forecast for July 14: 16.9
Range: -12.0 to 21.0
The Reuter's/University of Michigan's consumer sentiment index edged higher the last two weeks in June, coming in at a final 82.5 for June versus a mid-month reading of 81.2 and versus a final May reading of 81.9. The current conditions component rose to 96.6 compare to a final May reading of 94.5 for a 2.1 point gain that points to monthly strength for the consumer sector during June. The expectations component held little changed, at 73.5.
Consumer sentiment Consensus Forecast for preliminary July 14: 83.0
Range: 82.0 to 93.0
The Conference Board's index of leading indicators rose 0.5 percent in May, accelerating from a revised 0.3 percent gain in April. The yield spread, reflecting the Fed's near zero rate policy, once again is the leading component by a wide margin. But there were still solid positives for jobless claims, which point to improvement in the labor market, and the factory workweek, which point to gains for income and output. The report's leading credit index is also solid pointing to improved lending strength. A negative in the report, however, was weakness in building permits in what points to continuing struggles for the housing sector.
Leading indicators Consensus Forecast for June 14: +0.5 percent
Range: +0.3 to +0.7 percent
R. Mark Rogers is the author of The Complete Idiot's Guide to Economic Indicators, Penguin Books.
He can also be found on a weekly broadcast talking about the U.S. economy, the easiest way to find him is by going to iTunes and searching for "Simply Economics."
Econoday Senior Writer Mark Pender contributed to this article.
|
