|
It was a bad week for stocks even as the Fed maintained a steady and loose monetary policy and second quarter GDP beat expectations notably.
 Equities ended the week down sharply. The week began quietly, mixed and little changed for the most part. Geopolitical problems (Gaza and Ukraine) and weaker pending home sales data weighed on stocks. Equities were mostly down Tuesday as concerns about the new sanctions on Russia imposed by the European Union and later in the day by the US more than offset positive July consumer confidence data and earnings reports. Equities ended the week down sharply. The week began quietly, mixed and little changed for the most part. Geopolitical problems (Gaza and Ukraine) and weaker pending home sales data weighed on stocks. Equities were mostly down Tuesday as concerns about the new sanctions on Russia imposed by the European Union and later in the day by the US more than offset positive July consumer confidence data and earnings reports.
At midweek, blue chips were flat to down slightly while other major indexes were mostly up. The Fed's afternoon policy announcement was seen as continuing easy monetary policy for a "considerable" period after the end of taper. Also, earlier in the day, a better-than-expected advance estimate for second quarter GDP was seen as favorable.
 Stocks dropped sharply Thursday with no one reason being the driver. Traders began to take the view that the Fed may raise policy rates sooner than earlier believed after a healthy second quarter GDP number. There were also concerns about the impact of EU and U.S. sanctions against Russia. And there were worries about Argentine debt as that country could not reach an agreement with bondholders and defaulted late Wednesday. Major indexes in the U.S. fell about 2 percent on the day. Stocks dropped sharply Thursday with no one reason being the driver. Traders began to take the view that the Fed may raise policy rates sooner than earlier believed after a healthy second quarter GDP number. There were also concerns about the impact of EU and U.S. sanctions against Russia. And there were worries about Argentine debt as that country could not reach an agreement with bondholders and defaulted late Wednesday. Major indexes in the U.S. fell about 2 percent on the day.
Friday, equities declined but at a much more muted pace. Stocks eased despite a "Goldilocks" employment report for July (not too hot, not too cold for the Fed) and a healthy ISM manufacturing report. Traders focused more on news from overseas—including the default by Argentina. Additionally, Portugal's Banco Espírito Santo SA was ordered to raise capital.
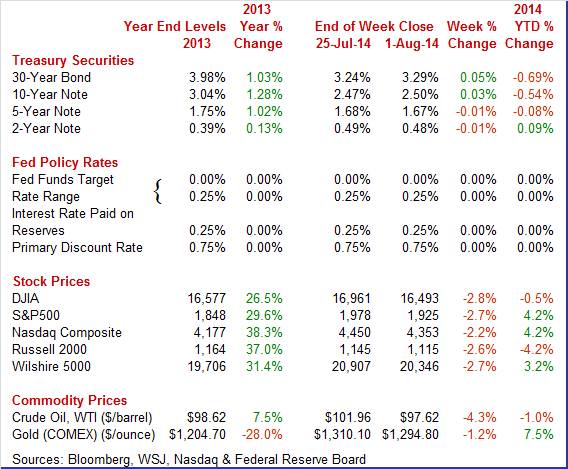
 Equities were down this past week. The Dow was down 2.8 percent; the S&P 500, down 2.7 percent; the Nasdaq, down 2.2 percent; the Russell 2000, down 2.6 percent; and the Wilshire 5000, down 2.7 percent. Equities were down this past week. The Dow was down 2.8 percent; the S&P 500, down 2.7 percent; the Nasdaq, down 2.2 percent; the Russell 2000, down 2.6 percent; and the Wilshire 5000, down 2.7 percent.
For the month of July, major indexes were down as follows: the Dow, down 3.0 percent; the S&P 500, down 2.8 percent; the Nasdaq, down 2.6 percent; the Russell 2000, down 7.3 percent; and the Wilshire 5000, down 3.3 percent.
For the year-to-date, major indexes are mixed as follows: the Dow, down 0.5 percent; the S&P 500, up 4.2 percent; the Nasdaq, up 4.2 percent; the Russell 2000, down 4.2 percent; and the Wilshire 5000, up 3.2 percent.
Weekly percent change column reflects percent changes for all components except interest rates. Interest rate changes are reflected in simple differences.
 Rates on Treasuries ended the week mixed but with modest net change for the week. On Monday, yields nudged up despite a disappointing pending home sales report. Tuesday, rates eased marginally on modest flight to safety after the European Union and the U.S. added new sanctions against Russia for supporting separatists in eastern Ukraine. Rates rose notably at mid-week after a strong report on second quarter GDP. Bond traders worried more than stock traders about the possibility of an early rise in Fed policy rates. Rates on Treasuries ended the week mixed but with modest net change for the week. On Monday, yields nudged up despite a disappointing pending home sales report. Tuesday, rates eased marginally on modest flight to safety after the European Union and the U.S. added new sanctions against Russia for supporting separatists in eastern Ukraine. Rates rose notably at mid-week after a strong report on second quarter GDP. Bond traders worried more than stock traders about the possibility of an early rise in Fed policy rates.
Treasury yields were little changed Thursday ahead of the Friday jobs report. Rates declined Friday after the payroll jobs number for July came in below expectations.
For this past week Treasury rates were mixed as follows although long rates firmed: 3-month T-bill, unchanged; the 2-year note, down 1 basis point; the 5-year note, down 1 basis point; the 7-year note, up 2 basis points; the 10-year note, up 3 basis points; and the 30-year bond, up 5 basis points.
 The spot price of West Texas Intermediate fell significantly this past week. After little change Monday, WTI dipped somewhat under a dollar barrel Tuesday on news of shutdown of a Kansas refinery due to fire damage. This was seen as cutting into demand for crude. Spot crude declined over a dollar a barrel at midweek after the release of the weekly inventory report which showed gasoline supplies up as demand weakened. The spot price of West Texas Intermediate fell significantly this past week. After little change Monday, WTI dipped somewhat under a dollar barrel Tuesday on news of shutdown of a Kansas refinery due to fire damage. This was seen as cutting into demand for crude. Spot crude declined over a dollar a barrel at midweek after the release of the weekly inventory report which showed gasoline supplies up as demand weakened.
The Kansas refinery shut down continued to weigh on prices Thursday after an announcement that the refinery would be shut longer than expected. Friday saw WTI ease slightly after the below expectations payroll jobs report.
Net for the week, the spot price for West Texas Intermediate dropped $4.34 per barrel to settle at $97.62.
While equities have taken a downturn, it was the opposite for most of the economy this past week. Housing gave mixed signals. And the Fed appears prepared to keep the economy growing with easy monetary policy.
 With this past week's policy decision, the Fed essentially re-iterated and emphasized recent decisions—notably on guidance. Policy rates were unchanged with the fed funds target at a range of zero to 0.25 percent. Taper remains on schedule to end with the October FOMC meeting. With this past week's policy decision, the Fed essentially re-iterated and emphasized recent decisions—notably on guidance. Policy rates were unchanged with the fed funds target at a range of zero to 0.25 percent. Taper remains on schedule to end with the October FOMC meeting.
There was new language for guidance on rates. Policy rates are to remain low for a "considerable time" after the end of taper. However, the language was consistent with earlier Fed forecasts for the fed funds rate. Philly Fed's Charles Plosser dissented, objecting to "considerable time" phrase.
 Regarding the economy, emphasis was on the labor market which was upgraded with the comment, "Labor market conditions have improved , with the unemployment rate declining further." But it was also noted, "a range of labor market indicators suggests that there remains significant underutilization of labor resources." Regarding the economy, emphasis was on the labor market which was upgraded with the comment, "Labor market conditions have improved , with the unemployment rate declining further." But it was also noted, "a range of labor market indicators suggests that there remains significant underutilization of labor resources."
The economy is seen as having rebounded from the anemic first quarter with household spending rising moderately and business fixed investment advancing. Housing is seen as remaining slow.
Inflation is closer to the Fed's long-term goal and longer-term inflation expectations have remained stable.
Due to continued progress in the labor market, the FOMC decided to take a further measured reduction in asset purchases.
"Beginning in August, the Committee will add to its holdings of agency mortgage-backed securities at a pace of $10 billion per month rather than $15 billion per month, and will add to its holdings of longer-term Treasury securities at a pace of $15 billion per month rather than $20 billion per month. The Committee is maintaining its existing policy of reinvesting principal payments from its holdings of agency debt and agency mortgage-backed securities in agency mortgage-backed securities and of rolling over maturing Treasury securities at auction."
The Fed noted that further asset purchases are likely to be cut back at a measured pace even though the reductions are not on a preset course.
The FOMC statement noted "that it likely will be appropriate to maintain the current target range for the federal funds rate for a considerable time after the asset purchase program ends, especially if projected inflation continues to run below the Committee's 2 percent longer-run goal, and provided that longer-term inflation expectations remain well anchored."
The Fed also indicated that the rise in policy rates is likely to be slow with the comment that even after the Fed achieves policy mandates (unemployment and inflation), that the fed funds rate may be below levels the Committee views as normal in the longer run.
 It appears that nearly everyone was right in thinking that the first quarter decline in GDP was due to atypically cold weather. The second quarter rebounded more than expected from the adverse weather impacted first quarter. While there were a number of strong components, the rebound was led by inventory growth. The advance estimate for the second quarter posted at a healthy 4.0 percent annualized, following an upwardly revised decline of 2.1 percent in the first quarter (previously down 2.9 percent). The median forecast was for 3.1 percent. The latest GDP release includes annual revisions. It appears that nearly everyone was right in thinking that the first quarter decline in GDP was due to atypically cold weather. The second quarter rebounded more than expected from the adverse weather impacted first quarter. While there were a number of strong components, the rebound was led by inventory growth. The advance estimate for the second quarter posted at a healthy 4.0 percent annualized, following an upwardly revised decline of 2.1 percent in the first quarter (previously down 2.9 percent). The median forecast was for 3.1 percent. The latest GDP release includes annual revisions.
Final sales of domestic product rebounded 2.3 percent after dipping 1.0 percent in the first quarter. Final sales to domestic purchasers gained 2.8 percent in the second quarter, compared to 0.7 percent in the first quarter.
Turning to components, inventory investment jumped $93.4 billion after rising $35.2 billion in the first quarter. Importantly, personal spending posted a robust 6.2 percent gain, following a 1.0 percent rise in the prior quarter. Durables PCEs were particularly strong with nondurables healthy. Services posted on the soft side.
Residential investment rebounded notably in the second quarter and nonresidential investment was healthy. Government purchases were up but soft and net exports worsened notably.
On the price front, the chain-weighted price index firmed to a 2.0 percent increase, up from 1.3 percent in the first quarter. The core chain index increased 1.8 percent in the second quarter from 1.2 percent in the prior quarter.
Turning to annual revisions, 2013 on an annual average basis was revised up to 2.2 percent versus the prior estimate of 1.9 percent; 2012 revised down to 2.3 percent from 2.8 percent; and 2011 revised down to 1.6 percent from 1.8 percent.
Overall, the second quarter numbers point to a return to forward momentum after the deep freeze first quarter. While inventories led second quarter growth, this should not be disconcerting as the lack of production in the first quarter meant that significant inventory rebuilding was needed. Additionally, other GDP components (net exports being the key exception) were healthy.
 While job growth for July was disappointing there was a bright side. Payroll growth was on the soft side in July but still moderately positive. Markets see the latest numbers as not moving up the Fed's schedule for interest rate increases. While job growth for July was disappointing there was a bright side. Payroll growth was on the soft side in July but still moderately positive. Markets see the latest numbers as not moving up the Fed's schedule for interest rate increases.
Total nonfarm payroll jobs rose 209,000 in July after a 298,000 gain in June and a 229,000 rise in May. The net revision for the prior two months was up 15,000. Expectations for July were for 233,000.
The unemployment rate nudged up to 6.2 percent from 6.1 percent in June. Expectations were for 6.1 percent. The expanded underemployment rate ("U-6") rose to 12.2 percent from 12.1 percent in June.
 Turning back to the payroll report, private jobs advanced 198,000 after a 270,000 increase the month before. Analysts forecast 233,000. It was the goods-producing sector that was relatively healthy, gaining 58,000 in July, following a 38,000 rise in June. Both manufacturing and construction were healthy. Turning back to the payroll report, private jobs advanced 198,000 after a 270,000 increase the month before. Analysts forecast 233,000. It was the goods-producing sector that was relatively healthy, gaining 58,000 in July, following a 38,000 rise in June. Both manufacturing and construction were healthy.
Private service-providing jobs decelerated to a gain of 140,000 after a boost of 232,000 in June. Slowing was seen in retail trade, education & health services, and professional & business services.
Government jobs rose 11,000 after a 28,000 boost in June.
Average weekly hours were unchanged at 34.5 hours, matching expectations. Growth in average hourly earnings was flat at 0.0 percent after a 0.2 percent rise in June. The median market forecast was for 0.2 percent.
Looking ahead to the personal income report, from the payroll survey, private aggregate weekly earnings rose 0.2 percent in July, pointing to a modest rise in private wages & salaries. Production worker hours in manufacturing were up 0.3 percent for the month, suggesting a rise in the manufacturing component for July industrial production.
Overall, the latest report was on the soft side and will not tip the Fed's hand to accelerate rate increases.
 The latest personal income report bolsters the view that the consumer will continue to play a leading role in upcoming economic growth. While lagging by one month, the June personal income report was quite favorable compared to the soft employment report for July. Income and spending were up while inflation numbers were restrained at the core level. The latest personal income report bolsters the view that the consumer will continue to play a leading role in upcoming economic growth. While lagging by one month, the June personal income report was quite favorable compared to the soft employment report for July. Income and spending were up while inflation numbers were restrained at the core level.
Personal income rose 0.4 percent in June, matching the pace the month before. The important wages & salaries component increased 0.4 percent in both of the most two recent months. This suggests ample fuel for consumer spending in the near term.
 Personal consumption improved to a 0.4 percent boost in June after rising 0.3 percent the month before. For June, spending strength was in durables (up 0.4 percent) and nondurables (up 0.3 percent). Services edged up only 0.1 percent in June. Personal consumption improved to a 0.4 percent boost in June after rising 0.3 percent the month before. For June, spending strength was in durables (up 0.4 percent) and nondurables (up 0.3 percent). Services edged up only 0.1 percent in June.
July inflation numbers likely kept the Fed happy. PCE inflation eased to a monthly 0.2 percent in June from 0.3 percent in May. Core PCE inflation softened to a 0.1 percent rise after a 0.2 percent gain in May. On a year-ago basis, headline PCE inflation posted at 1.6 percent versus 1.7 percent in June. Year-ago core inflation was 1.5 percent in both June and May. These figures give the Fed some leeway to keep policy loose as inflation is still below the Fed's goal of 2.0 percent.
 The two key measures of the consumer mood painted slightly different pictures for July—confidence advanced while sentiment was flat. The two key measures of the consumer mood painted slightly different pictures for July—confidence advanced while sentiment was flat.
According to the Conference Board, consumer confidence was by far at its best level of the recovery, at a much higher-than-expected 90.9 in July versus an already very strong and upwardly revised 86.4 in June. July's level was the highest since December 2007 while the June reading was the second highest since January 2008.
July's gain is led by the expectations component which was up a very sharp 6.3 points to 92.7 for the highest reading since February 2011. The present situation component was up 2.0 points to 88.3 for the highest reading since March 2008.
The Reuters/University of Michigan consumer sentiment index in July finished the month at 81.8 versus a mid-month reading of 81.3 and a final June reading of 82.5. But there was strength in the report and that's for the current conditions component, which came in at 97.4 versus 97.1 at mid-month and versus 96.6 in June. The comparison with June points to slight acceleration for consumer activity in July.
The weakness in the report was in the expectations component which, at 71.8, was up 7 tenths from mid-month but was down 1.7 points from final June.
 The housing market appears to be split with sales of new homes weak but sales of existing homes still respectable. The pending home sales index, for existing home sales, came in at a solid 102.7 in June, healthy but down a bit from a revised 103.8 in May. The monthly percentage change, at minus 1.1 percent, followed a monthly 6.0 percent spike in May. The housing market appears to be split with sales of new homes weak but sales of existing homes still respectable. The pending home sales index, for existing home sales, came in at a solid 102.7 in June, healthy but down a bit from a revised 103.8 in May. The monthly percentage change, at minus 1.1 percent, followed a monthly 6.0 percent spike in May.
The regional breakdown showed a dip in the South but a gain for the Midwest and a fractional gain for the West.
 Home-price unexpectedly declined in May at a seasonally adjusted minus 0.3 percent for Case-Shiller's 20-city index and followed a 0.1 percent rise the month before. May's dip was the first negative reading since January 2012. Home-price unexpectedly declined in May at a seasonally adjusted minus 0.3 percent for Case-Shiller's 20-city index and followed a 0.1 percent rise the month before. May's dip was the first negative reading since January 2012.
Year-on-year, both adjusted and unadjusted, home prices are at plus 9.3 percent, down substantially from 10.8 percent and 12.4 percent in the two prior months.
Unadjusted data showed deceptive strength, at a monthly plus 1.1 percent. But this reflects seasonal strength in the spring months for housing and was not a sign of pricing power.
Growth slowed but was still very strong in Markit's US manufacturing sample where the composite index remained well above 50, at 55.8 for the final July reading versus 56.3 in the flash July reading and vs 57.3 in June which was a multi-year high. Details are provided only to subscribers but the report does note that, despite the slowing in the composite, production remains very strong. It said new orders held strong and steady though exports orders slowed to a six-month low.
 ISM's manufacturing survey reported solid acceleration in July with the composite index rising a sizable 1.8 points to 57.1 in July. This was the best reading since April 2011. And there was a sharp gain in new orders, to 63.4 vs June's 58.9 for the best reading of the year. ISM's manufacturing survey reported solid acceleration in July with the composite index rising a sizable 1.8 points to 57.1 in July. This was the best reading since April 2011. And there was a sharp gain in new orders, to 63.4 vs June's 58.9 for the best reading of the year.
Another big positive, and one that contrasts with Markit's manufacturing report was a big jump in employment growth, to 58.2 for a 5.4 point surge. This marks the strongest rate of monthly employment for ISM's sample since June 2011.
The economy appears to be poised for decent growth for the rest of the year. The consumer and manufacturing sectors are healthy. However, housing is mixed. And Fed policy rates are likely to remain below historical averages for a considerable period.
With a light schedule for indicators, the standouts are factory orders, international trade, and initial jobless claims. For orders traders will watch to see if the durables component is revised notably. The international trade report will get attention on whether demand is picking up for non-petroleum goods. Finally, traders will watch initial jobless claims to see if it hints that the Fed may raise policy rates sooner than believed.
The Markit PMI services flash index for July posted well above breakeven 50 at 61.0. The report, however, does note without detail that new business growth, after hitting a five-year high in June, is slowing. Hiring is also slowing while backlog orders are being worked down. The report also notes an easing in input price pressures to the lowest level since April last year. Output price pressures are also easing.
Markit PMI services index (final) Consensus Forecast for July 14: 61.0
Range: 61.0 to 62.0
Factory orders fell 0.5 percent in May but, when excluding defense, orders rose 0.2 percent. Yet most categories do show a softening with orders for transportation equipment down 2.9 percent, electrical equipment down 2.2 percent, computers down 2.0 percent, and the important machinery group down 0.3 percent. One big positive was a 0.7 percent order gain for nondefense capital goods excluding aircraft, which is an important core reading for business investment. More recently, orders for durables rebounded 0.7 percent in June. Excluding transportation, orders advanced 0.8 percent in June.
Factory orders Consensus Forecast for June 14: +0.6 percent
Range: 0.0 to +0.8 percent
The composite index from the ISM non-manufacturing survey
In June showed very solid growth, at a composite 56.0 in June versus May's 56.3. Both of these readings are among the very best of the recovery and compare with a winter low of 51.6 in February. New orders, at 61.2 for a 7 tenths gain, posted their strongest growth in 3-1/2 years. Backlog orders, at 53.0, were also growing as are export orders, at 55.0.
ISM non-manufacturing composite index Consensus Forecast for July 14: 56.5
Range: 55.0 to 57.5
The U.S. international trade gap in May narrowed somewhat more than expected. The trade gap shrank to $44.4 billion from $47.0 billion in April. Exports rebounded 1.0 percent in May after slipping 0.1 percent the prior month. Imports dipped 0.3 percent, following a 1.1 percent boost in April. The shrinking of the trade deficit was led by the petroleum gap which narrowed to $15.2 billion from $18.0 in April. Also, the services surplus improved to $18.9 billion from $18.6 billion. However, the goods excluding petroleum gap widened a bit to $47.0 billion from $46.6 billion in April.
International trade balance Consensus Forecast for June 13: -$45.0 billion
Range: -$46.7 billion to -$41.0 billion
Initial jobless claims rose 23,000 in the July 26 week to 302,000. But the prior week was a standout, revised 5,000 lower from its initial reading to 279,000 which is the lowest reading since before the prior business cycle in May 2000. The 4-week average was also a standout, down 3,500 to a sub 300,000 level of 297,250 which is the lowest of this business cycle, specifically going back to April 2006.
Jobless Claims Consensus Forecast for 8/2/14: 305,000
Range: 295,000 to 315,000
Consumer credit outstanding rose $19.6 billion in May following a revised gain of $26.1 billion in April. Gains for revolving credit, up $1.8 billion in the month following an $8.8 billion surge in April, point to strong credit card use which is a big plus for retailers. Non-revolving credit, up $17.8 billion, continues to be driven by car loans as well as the government's acquisition of student loans. Based on not-seasonally-adjusted data, the boost in non-revolving credit was largely led by car loans.
Consumer credit Consensus Forecast for June 14: +$18.3 billion
Range: +$14.0 billion to +$22.0 billion
Nonfarm business productivity in the first quarter fell an annualized 3.2 percent, following a 2.3 percent gain in the first quarter. The original estimate for the first quarter was down 1.7 percent. Again, severe winter weather is blamed for the first quarter performance and is heavily discounted. Unit labor costs spiked a revised 5.7 percent after slipping 0.6 percent in the fourth quarter. The prior estimate for the first quarter was up 4.2 percent. Turning to detail, nonfarm output declined an annualized 1.1 percent, following a 3.8 percent jump in the fourth quarter. Hours worked picked up to 2.2 percent after a 1.4 percent rise the prior quarter. Compensation growth accelerated to 2.3 percent from 1.7 percent in the fourth quarter.
Nonfarm Business Productivity Consensus Forecast for initial Q2 14: +1.4 percent annual rate
Range: -5.0 to +3.5 percent annual rate
Unit Labor Costs Consensus Forecast for initial Q2 14: +1.6 percent annual rate
Range: +0.3 to +7.5 percent annual rate
Wholesale inventories rose 0.5 percent in May, a solid and balanced rise in line with a 0.7 percent gain in sales that leaves the stocks-to-sales ratio unchanged at a lean 1.18. There were large inventory gains for lumber, metals, machinery, and drugs, all matched by large gains in sales. Inventories of autos also rose sharply but less so for sales. But heavy wholesale inventory of autos is a likely plus given the building strength in retail sales of autos.
Wholesale inventories Consensus Forecast for June 14: +0.7 percent
Range: +0.3 to +0.9 percent
R. Mark Rogers is the author of The Complete Idiot's Guide to Economic Indicators, Penguin Books.
He can also be found on a weekly broadcast talking about the U.S. economy, the easiest way to find him is by going to iTunes and searching for "Simply Economics."
Econoday Senior Writer Mark Pender contributed to this article.
|
