|
The U.S. economy appears to have been in moderately healthy shape in the second quarter and also now early third quarter. And earnings are decent. But you wouldn't know it from recent declines in equities—largely due to worries over events and potential events abroad. But there was a rally at the end of the week.
 Markets swung sharply this past week, mostly on news from overseas. U.S. news was mostly favorable. Markets swung sharply this past week, mostly on news from overseas. U.S. news was mostly favorable.
The week got off to a good start as equities rose on Portugal's bailout of Banco Espirito Santo SA. Also, Berkshire Hathaway topped earnings estimates. Tuesday, stocks were down despite healthy news on factory orders, ISM non-manufacturing, and Markit PMI services. Traders were worried about concern about possible escalation of military action in eastern Ukraine. Russian President Vladimir Putin showed no sign of backing down over Ukraine after the US and the European Union tightened sanctions the prior week. Poland's foreign affairs minister indicated that an invasion by Russia into Ukraine was imminent. Also, good news was bad news on the economic front as there were concerns that the Fed might raise policy rates sooner than expected.
 Equities were mostly little changed at mid-week even as the U.S. trade deficit unexpectedly improved. This economic good news was offset by a report by NATO that Russia had about 20,000 troops on the eastern border of Ukraine. Also, Putin ordered restrictions on food imports from Western countries, including the U.S. Equities were mostly little changed at mid-week even as the U.S. trade deficit unexpectedly improved. This economic good news was offset by a report by NATO that Russia had about 20,000 troops on the eastern border of Ukraine. Also, Putin ordered restrictions on food imports from Western countries, including the U.S.
Equities declined Thursday despite improvement in initial jobless claims. Russia's ban on Western food imports weighed on markets. Also, on the international front, Italy appeared to slip back into recession.
The week ended on a positive note with equities up sharply. There was little economic news but favorable news from Russia. Stocks surged on reports that Russia may be seeking a de-escalation of the conflict in Ukraine. Reports from that country suggested that military forces are returning to permanent areas of deployment rather than being deployed on the eastern border of Ukraine. This news offset concerns regarding Gaza and renewed bombing of Iraqi militants by the U.S.
Yes, the U.S. economy is looking better but distractions currently are from overseas.
Equities were up this past week. The Dow was up 0.4 percent; the S&P 500, up 0.3 percent; the Nasdaq, up 0.4 percent; the Russell 2000, up 1.5 percent; and the Wilshire 5000, up 0.4 percent.
For the year-to-date, major indexes are mixed as follows: the Dow, down 0.1 percent; the S&P 500, up 4.5 percent; the Nasdaq, up 4.7 percent; the Russell 2000, down 2.8 percent; and the Wilshire 5000, up 3.7 percent.
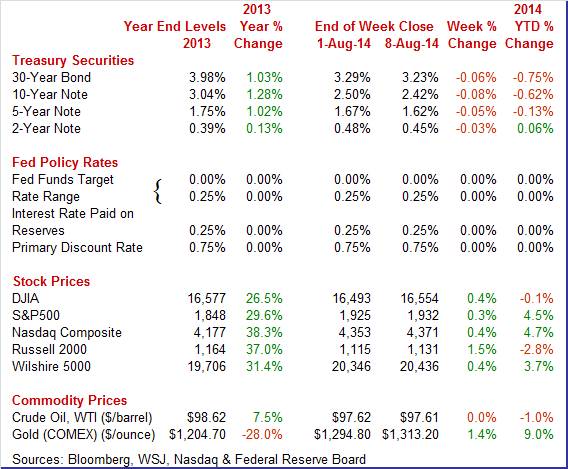
Weekly percent change column reflects percent changes for all components except interest rates. Interest rate changes are reflected in simple differences.
 Treasury rates fell moderately this past week. Monday and Tuesday were relatively quiet. Yields dipped somewhat Wednesday on flight to safety over concerns regarding tensions in Ukraine and Gaza. The U.S., NATO, and Poland warned about the possibility of Russia sending troops into eastern Ukraine. Flight to safety continued Thursday and as soft economic growth was seen globally, including in Europe (German growth) and Australia (soft labor market). Treasury rates fell moderately this past week. Monday and Tuesday were relatively quiet. Yields dipped somewhat Wednesday on flight to safety over concerns regarding tensions in Ukraine and Gaza. The U.S., NATO, and Poland warned about the possibility of Russia sending troops into eastern Ukraine. Flight to safety continued Thursday and as soft economic growth was seen globally, including in Europe (German growth) and Australia (soft labor market).
Rates nudged up Friday as funds moved from Treasuries to equities on news of possibly easing tensions regarding eastern Ukraine.
For this past week Treasury rates were down as follows: the 2-year note, down 3 basis points; the 5-year note, down 5 basis points; the 7-year note, down 7 basis points; the 10-year note, down 8 basis points; and the 30-year bond, down 6 basis points. The 3-month T-bill was unchanged throughout the week.
 It actually was a boring week for oil markets despite overseas events affecting other markets. Spot WTI essentially was unchanged for the week and there were no notable daily swings in price. The largest daily change was barely over half a dollar per barrel. It actually was a boring week for oil markets despite overseas events affecting other markets. Spot WTI essentially was unchanged for the week and there were no notable daily swings in price. The largest daily change was barely over half a dollar per barrel.
But the trend is for lower crude prices due in part to technical factors in supply in the U.S. and due to apparent continued flow from Iraq despite internal conflict there.
Net for the week, the spot price for West Texas Intermediate slipped 1 cent per barrel to settle at $97.61.
The economy is showing signs of improvement—notably for manufacturing but non-manufacturing also is gaining ground.
 For international trade data, there can be mixed implications for the near term versus months out. That appears to be the case for June trade data. For international trade data, there can be mixed implications for the near term versus months out. That appears to be the case for June trade data.
The trade deficit in June narrowed again after an unexpectedly large narrowing the month before. The trade gap shrank to $41.5 billion from $44.7 billion in May. Exports edged up 0.1 percent in June after jumping 1.1 percent the month before. Imports fell 1.2 percent, following a 0.1 percent dip in May.
 The improvement in the trade deficit was led by the goods excluding petroleum gap which decreased to $44.8 billion from $47.1 billion in May. Also the petroleum balance contracted to $14.7 billion in June from $15.2 billion the prior month. The services balance was steady at $18.7 billion. The improvement in the trade deficit was led by the goods excluding petroleum gap which decreased to $44.8 billion from $47.1 billion in May. Also the petroleum balance contracted to $14.7 billion in June from $15.2 billion the prior month. The services balance was steady at $18.7 billion.
However, the detail in goods imports suggests lack of confidence by businesses in upcoming consumer demand and business investment. For imports, capital goods excluding autos declined $0.3 billion in June; automotive fell $1.1 billion; and consumer goods fell $1.3 billion.
The auto import number is volatile, often reflecting movement of inventories across the Canadian border around Detroit. But the drop in consumer goods is worrisome unless there is some pick up in coming months. This also applies to capital goods as businesses remain cautious. June data are good for second quarter GDP but raise questions about domestic demand in later quarters. Another point to remember is that there are significant lags between when imports are ordered and when they arrive. The softness in import subcomponents could be a lagged reflection of businesses' view of the economy.
 In contrast to trade data, factory orders suggest improved demand ahead. The key news was an upward revision to durables orders. In contrast to trade data, factory orders suggest improved demand ahead. The key news was an upward revision to durables orders.
The factory sector surged higher in June following a weak May with new orders up a much higher-than-expected 1.1 percent following a downward revised 0.6 percent decline in May. The durable goods component, previously released, was revised sharply higher to show a 1.7 percent jump, up from an initial reading of plus 0.7 percent. The component for non-durable goods, the new reading in the full report, also showed strength, up a solid 0.6 percent following a 0.2 percent decline in May.
The outstanding area of strength in the report was core capital goods where a big 3.3 percent jump for nondefense capital goods excluding aircraft points to solid business investment in equipment which reflects solid business confidence in the outlook. This subcomponent had been sluggish and the latest number suggests slowly growing optimism in the business community.
Month-to-month readings can be bumpy in the factory sector, but this was a very balanced and very solid report that confirms manufacturing as the economy's leading sector.
Manufacturing currently is leading the recovery. But non-manufacturing is starting to play catch up—and notably so.
 In July, ISM's non-manufacturing sample reported the strongest rates of monthly growth of the whole recovery with strength led by construction but included 16 of 18 industries. The July composite index was at a recovery best of 58.7, up a very sizable 2.7 points from June, with new orders also at a recovery best of 64.9, up 3.7 points which points to rising activity ahead. In July, ISM's non-manufacturing sample reported the strongest rates of monthly growth of the whole recovery with strength led by construction but included 16 of 18 industries. The July composite index was at a recovery best of 58.7, up a very sizable 2.7 points from June, with new orders also at a recovery best of 64.9, up 3.7 points which points to rising activity ahead.
And production is already very strong with the business activity index near a recovery best of 62.4 for 4.9 point surge. Employment also gained, up 1.6 points to 56.0 which is very strong for this reading.
Markit's US service sector sample reports continued strong growth in general activity, at an index that was well above breakeven 50 at 60.8 in final July versus 61.0 in both the mid-month July reading and the final reading for June.
Other readings are strong though less strong than recent months including for new business volumes and the 12-month outlook.
 Consumer credit is a lagging indicator but it can confirm consumer sentiment. The latest report indicates that the consumer is feeling a little more confident about the economy. But technical issues remain important in recent consumer credit data. Consumer credit is a lagging indicator but it can confirm consumer sentiment. The latest report indicates that the consumer is feeling a little more confident about the economy. But technical issues remain important in recent consumer credit data.
Consumer credit rose $17.3 billion in June and was driven once again by the nonrevolving component, which rose $16.3 billion on vehicle financing and also the government's continued acquisition of student loans from private lenders. The gain in auto purchases reflects both an aging auto fleet and consumer belief that the economy—and notably the labor market—is building momentum. Student loan increases are largely a technicality of moving loans from private lender balance sheets to government balance sheets.
The revolving component, which is key for retailers, did rise but moderately, up $0.9 billion following a revised $1.7 billion rise in May that followed a rare surge in this category of $8.8 billion April. Revolving credit has been volatile recently but modestly healthy on average.
While it was a light week for economic indicators, the bottom line is that the economy has largely recovered from first quarter weakness—not just in the second quarter but also early third quarter. The Fed may need to marginally move ahead its policy rate plans—emphasis on marginally.
This week ahead has a variety of key releases. Two stand out. Manufacturing has been strong recently with the latest surveys. The Fed's industrial production report posts Friday and will confirm or not the strength seen in surveys. Next, the consumer sector has shown moderate renewed strength—especially with improvement in jobless claims. The proof will be in the pudding with retail sales for July which are released Wednesday. Markets may also move on Friday's consumer sentiment report. Also, though not expected, a high PPI figure could raise worries about early Fed tightening.
The NFIB Small Business Optimism Index fell back 1.6 points in June to 95.0. The pullback was centered in those who expect the economy to improve which fell back a very sharp 10 points. Declines were also seen in those who expect their sales to move higher and those who say now is a good time to expand. The gains among components were isolated and moderate but were centered in the key category of employment with more planning to hire and more reporting an increase in job openings.
NFIB Small Business Optimism Index Consensus Forecast for July 14: 95.8
Range: 94.0 to 96.0
The Labor Department's Job Openings and Labor Turnover Survey showed that there were 4.635 million job openings on the last business day of May, up somewhat from 4.464 million in April. The hires rate (3.4 percent) and separations rate (3.2 percent) were essentially unchanged in May. Within separations, the quits rate (1.8 percent) was unchanged and the layoffs and discharges rate (1.1 percent) was little changed. There were 4.718 million hires in May, little changed from 4.770 million in April. There were 4.495 million total separations in May, little changed from April's 4.550 million. The quits rate was unchanged at 1.8 percent in May. The layoffs and discharges rate was little changed in May at 1.1 percent. Overall, there is a slow uptrend in job openings. This report currently appears to be lagging the more recently favorable jobs report, including gains in payroll jobs.
JOLTS job openings Consensus Forecast for June 14: 4.588 million
Range: 4.550 million to 4.700 million
The U.S. Treasury monthly budget report showed the cumulative-to-date fiscal year (nine months through June) deficit, at $365.9 billion, down 28 percent from this time last year. Higher tax receipts, up 8.2 percent year-on-year, were the main factor with lower defense spending, down 5.5 percent, a second major factor. For June alone, the government posted a surplus of $70.5 billion. Looking ahead, the month of July typically shows a deficit for the month. Over the past 10 years, the average deficit for the month of July has been $93.7 billion and $128.5 billion over the past 5 years. The July 2013 deficit came in at $97.6 billion.
Treasury Statement Consensus Forecast for July 14: -$96.0 billion
Range: -$100.0 billion to -$90.0 billion.
Retail sales disappointed for June but again there were upward revisions to the prior month. Retail sales posted a 0.2 percent rise in June, following a 0.5 percent increase the month before (originally up 0.3 percent). Motor vehicles surprised on the downside, declining 0.3 percent in June after jumping 0.8 percent the month before. Excluding motor vehicles, sales gained 0.4 percent, following a rise of 0.4 percent in May (originally up 0.1 percent). Excluding motor vehicles and gasoline, sales increased 0.4 percent after gaining 0.3 percent the month before (originally flat). Outside the core, strength was seen in general merchandise, health & personal care, and nonstore retailers. Notable declines were seen in building materials & garden equipment and food services & drinking places.
Retail sales Consensus Forecast for July 14: +0.2 percent
Range: -0.1 to +0.4 percent
Retail sales excluding motor vehicles Consensus Forecast for July 14: +0.4 percent
Range: +0.1 to +0.5 percent
Less motor vehicles & gasoline Consensus Forecast for July 14: +0.3 percent
Range: +0.2 to +0.7 percent
Business inventories rose 0.5 percent in May, in line with a 0.4 percent rise in business sales that left the inventory-to-sales ratio unchanged at 1.29. Looking at sectors, inventory build relative to sales was steady with retailers and wholesalers who showed no change in their inventory-to-sales ratios. Inventories to sales did build for manufacturers but not much, to 1.31 from 1.30. But this build is no threat given the leading strength of the manufacturing sector. Inventory build is likely to give a desirable lift to second-quarter GDP. More recently factory inventories gained 0.3 percent in June while wholesaler inventories also rose 0.3 percent for the month.
Business inventories Consensus Forecast for June 14: +0.4 percent
Range: +0.3 to +0.6 percent
Initial jobless claims continue to move lower in convincing proof of improvement underway in the labor market. Initial claims fell a very sizable 14,000 in the August 2 week to a 289,000 level. The 289,000 level is just slightly above the recovery low hit in the July 19 week of 279,000. But the 4-week average is at a new recovery low, down 4,000 to 293,500 which is about 20,000 below the month-ago trend. Continuing claims, in lagging data for the July 26 week, fell 24,000 to a new recovery low of 2.518 million while the 4-week average is down 17,000 to a new recovery low of 2.519 million.
Jobless Claims Consensus Forecast for 8/9/14: 295,000
Range: 295,000 to 300,000
Import prices rose only 0.1 percent in June while export prices fell 0.4 percent. Details on the import side showed wide declines including a 1.7 percent retreat for food/feeds/beverages and similar declines for coal and natural gas. Prices of imported petroleum products, however, did show pressure, up 1.4 percent in the month. The decline in export prices was centered in agricultural prices which fell 1.8 percent in the month. Almost all other categories showed declines.
Import prices Consensus Forecast for July 14: -0.2 percent
Range: -0.6 to 0.0 percent
Export prices Consensus Forecast for July 14: -0.1 percent
Range: -0.6 to +0.2 percent
The producer price index for final demand rebounded notably in June-but it largely was energy related. The PPI for total final demand rebounded 0.4 percent, following a decline of 0.2 percent the prior month. Total final demand excluding food & energy gained 0.2 percent after slipping 0.1 percent in May. Total final demand excluding food, energy, and trade services increased 0.2 percent in June after no change the month before. Energy jumped a monthly 2.1 percent after dipping 0.2 percent in May. Foods declined 0.2 percent in both June and May. Prices for final demand goods jumped 0.5 percent, following a decrease of 0.2 percent in May. In June, a 6.4-percent advance in gasoline prices accounted for most of the increase in the final demand goods index. Prices for final demand services rebounded 0.3 percent, following a decline of 0.2 percent in May. While the monthly PPI numbers have been volatile recently-largely due to swings in energy-the overall trend is still moderate.
PPI-FD Consensus Forecast for July 14: +0.1 percent
Range: -0.1 to +0.3 percent
PPI-FD ex Food & Energy Consensus Forecast for July 14: +0.2 percent
Range: +0.1 to +0.2 percent
The Empire State manufacturing index posted at a very strong 25.60 in the July reading. New orders were very strong at 18.77, up from an already strong 18.36 in June, as were shipments at 23.64. Employment was a special positive, at 17.05 versus 10.75 in June. Other readings, however, were less favorable with unfilled orders in contraction at minus 6.82. Price readings showed some pressure with input prices at plus 25.00 and finished prices up about 2.5 points to 6.82.
Empire State Manufacturing Survey Consensus Forecast for August 14: 20.0
Range: 15.0 to 26.0
Industrial production in June slowed to a rise of 0.2 percent, following a jump of 0.5 percent in May. The manufacturing component decelerated to a modest 0.1 percent gain after jumping 0.4 percent the prior month. Mining was healthy with a 0.8 percent increase, following a 1.1 percent surge in May. Utilities declined 0.3 percent, following a drop of 0.4 percent in May. Manufacturing excluding motor vehicles increased 0.2 percent in June after a 0.3 percent rise in May. The overall capacity utilization rate in June held steady at 79.1 percent. The latest number came in slightly lower than the consensus projection for 79.2 percent. We are seeing some volatility in manufacturing numbers recently. But on average, growth is healthy. Looking ahead, production worker hours in manufacturing were up 0.3 percent for the month, suggesting a rise in the manufacturing component for July industrial production.
Industrial production Consensus Forecast for July 14: +0.3 percent
Range: 0.0 to +0.6 percent
Manufacturing production component Consensus Forecast for July 14: +0.5 percent
Range: +0.3 to +0.8 percent
Capacity utilization Consensus Forecast for July 14: 79.2 percent
Range: 79.0 to 79.5 percent
The Reuters/University of Michigan's consumer sentiment index in July finished the month at 81.8 versus a mid-month reading of 81.3 and a final June reading of 82.5. But there was strength in the report and that was for the current conditions component, which came in at 97.4 versus 97.1 at mid-month and versus 96.6 in June. The comparison with June points to slight acceleration for consumer activity in July. The weakness in the report was in the expectations component which, at 71.8, was up 7 tenths from mid-month but was down 1.7 points from final June.
Consumer sentiment index Consensus Forecast for preliminary August 14: 82.3
Range: 80.0 to 83.9
R. Mark Rogers is the author of The Complete Idiot's Guide to Economic Indicators, Penguin Books.
He can also be found on a weekly broadcast talking about the U.S. economy, the easiest way to find him is by going to iTunes and searching for "Simply Economics."
Econoday Senior Writer Mark Pender contributed to this article.
|
