|
It likely is subtle—but the economy appears to be gaining strength. Exceptions may be the labor market and home prices.
 Equities made moderately strong gains this past week with the S&P 500 closing over 2,000—to some traders a notable benchmark. Equities made moderately strong gains this past week with the S&P 500 closing over 2,000—to some traders a notable benchmark.
Monday, in intraday trading the S&P 500 topped the 2,000 mark for the first time ever but closed just under. M&A activity led markets up with Burger King's planned purchase of Canada's Tim Hortons boosting stocks with talk of tax inversion. New home sales were down in the latest month but upward revisions to prior data were offsetting. Equities gained Tuesday on economic news with durables orders up sharply and consumer confidence better than expected. However, home price appreciation slowed. Still, the S&P 500 edged above a 2,000 close for the day.
 With no notable economic news on Wednesday, equities were little changed. Stocks slipped Thursday despite a modest decline in initial jobless claims and an upward revision to second quarter GDP growth. The deteriorating situation in Ukraine overshadowed positive U.S. economic data. Friday, stocks gained on unexpected improvement in consumer confidence which more than offset a dip in consumer spending in the latest personal income report. With no notable economic news on Wednesday, equities were little changed. Stocks slipped Thursday despite a modest decline in initial jobless claims and an upward revision to second quarter GDP growth. The deteriorating situation in Ukraine overshadowed positive U.S. economic data. Friday, stocks gained on unexpected improvement in consumer confidence which more than offset a dip in consumer spending in the latest personal income report.
Trading was light the past week ahead of the U.S. Labor Day weekend.
Equities were up this past week. The Dow was up 0.6 percent; the S&P 500, up 0.8 percent; the Nasdaq, up 0.9 percent; the Russell 2000, up 1.2 percent; and the Wilshire 5000, up 0.9 percent.
 Equities were up in August. The Dow was up 3.2 percent; the S&P 500, up 3.8 percent; the Nasdaq, up 4.8 percent; the Russell 2000, up 4.8 percent; and the Wilshire 5000, up 4.0 percent. Equities were up in August. The Dow was up 3.2 percent; the S&P 500, up 3.8 percent; the Nasdaq, up 4.8 percent; the Russell 2000, up 4.8 percent; and the Wilshire 5000, up 4.0 percent.
For the year-to-date, major indexes are up as follows: the Dow, up 3.1 percent; the S&P 500, up 8.4 percent; the Nasdaq, up 9.7 percent; the Russell 2000, up 0.9 percent; and the Wilshire 5000, up 7.8 percent.
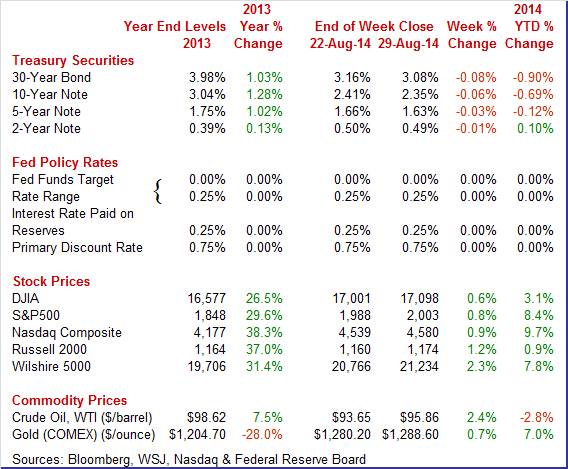
Weekly percent change column reflects percent changes for all components except interest rates. Interest rate changes are reflected in simple differences.
 Treasury yields fell moderately this past week with the biggest daily movements (though still very moderate) being Monday, Wednesday, and Thursday. Treasury yields fell moderately this past week with the biggest daily movements (though still very moderate) being Monday, Wednesday, and Thursday.
Longer maturity rates edged down Monday on continuing momentum from the Fed symposium at Jackson Hole that indicated Fed and ECB policies would remain loose. Rates slipped again Wednesday in concert with moves in European rates as ECB policy was seen as loose. Thursday, U.S. rates nudged down on belief of ECB quantitative easing and over flight to safety over Ukraine.
For this past week Treasury rates were down as follows: the 2-year note, down 1 basis point; the 5-year note, down 3 basis points; the 7-year note, down 5 basis points; the 10-year note, down 6 basis points; and the 30-year bond, down 8 basis points. The 3-month T-bill nudged up 1 basis point.
 The spot price of West Texas Intermediate rebounded this past week, rising a net $2.21 per barrel after dropping $3.47 the week before. The spot price of West Texas Intermediate rebounded this past week, rising a net $2.21 per barrel after dropping $3.47 the week before.
Key daily swings were Thursday and Friday—and on the upside. A better-than-expected revision to second quarter GDP growth lifted WTI on Thursday. Strong consumer sentiment boosted oil on Friday. Essentially, the oil market is seeing the recovery as stronger than earlier believed.
Net for the week, the spot price for West Texas Intermediate rebounded $2.21 per barrel to settle at $95.86. Nonetheless, WTI is well below the $105 level seen in mid-July.
Economic news remains more favorable than otherwise. Manufacturing continues to improve while the housing sector is mixed. The consumer sector decelerated in July but indications are that slowing in growth in income and spending were temporary.
 Economic growth is a little better than earlier believed. The second estimate for second quarter GDP growth came in a little stronger than expected, rising 4.2 percent annualized versus a 4.0 percent forecast and coming off a 2.1 percent weather related drop in the first quarter. With this second estimate for the second quarter, the general picture of economic growth remains the same; the increase in nonresidential fixed investment was larger than previously estimated, while the increase in private inventory investment was smaller than previously estimated. Economic growth is a little better than earlier believed. The second estimate for second quarter GDP growth came in a little stronger than expected, rising 4.2 percent annualized versus a 4.0 percent forecast and coming off a 2.1 percent weather related drop in the first quarter. With this second estimate for the second quarter, the general picture of economic growth remains the same; the increase in nonresidential fixed investment was larger than previously estimated, while the increase in private inventory investment was smaller than previously estimated.
Real final sales of domestic product-GDP less change in private inventories-increased 2.8 percent in the second quarter, in contrast to a decrease of 1.0 percent in the first. Real final sales to domestic purchasers gained 3.1 percent versus 0.7 in the first quarter.
Chain-weighted prices gained 2.1 percent annualized, compared to the consensus for 2.0 percent and the first quarter number of 1.3 percent.
Overall, the weather-related rebound in the second quarter was stronger than expected. Personal spending made a comeback and inventories were rebuilt. The economy is gradually regaining momentum—emphasis on gradually.
 It likely is temporary. Personal income growth decelerated in July after two strong months. Personal income rose 0.2 percent in July after gains of 0.5 percent in both June and May. The wages & salaries component followed a similar track, advancing 0.2 percent in July after increases of 0.4 percent in each of the prior two months. It likely is temporary. Personal income growth decelerated in July after two strong months. Personal income rose 0.2 percent in July after gains of 0.5 percent in both June and May. The wages & salaries component followed a similar track, advancing 0.2 percent in July after increases of 0.4 percent in each of the prior two months.
Personal spending unexpectedly declined 0.1 percent after a 0.4 percent jump in June. Weakness was in the durables component which fell 0.7 percent after increasing 0.5 percent in June and 0.9 percent in May-reflecting volatility in auto sales. Nondurable slipped 0.1 percent in July after spiking 1.0 percent the month before. True weakness was in services which were flat in the latest month after a 0.2 percent increase in June.
 PCE inflation slowed to a monthly 0.1 percent in July from 0.2 percent in June. The latest figure equalled expectations. Core PCE inflation posted at 0.1 percent-the same pace as in June. Analysts projected 0.1 percent. PCE inflation slowed to a monthly 0.1 percent in July from 0.2 percent in June. The latest figure equalled expectations. Core PCE inflation posted at 0.1 percent-the same pace as in June. Analysts projected 0.1 percent.
On a year-ago basis, headline PCE inflation came in at 1.6 percent-the same rate as in June. Year-ago core inflation was 1.5 percent in July and the month before. PCE inflation is not yet at the Fed goal of 2 percent but is edging upward.
Overall, July personal income and consumption likely will dampen third quarter GDP growth. Still, third quarter growth looks moderately strong while inflation-though rising-is still below Fed goal. Improvement in consumer confidence indicates that the consumer sector is holding up decently.
 The consumer sector makes up about two-thirds of the economy—and despite modest job gains, the consumer is more optimistic. The consumer sector makes up about two-thirds of the economy—and despite modest job gains, the consumer is more optimistic.
According the Conference Board's report, consumer confidence is up and is led by strength in the current assessment which points to gains for consumer readings in August. Consumer confidence rose 2.1 points to a new recovery high of 92.4 reflecting a 6.7 point surge in the present situation component to 94.6. The gain in this component reflects improvement in August employment with substantially more consumers saying jobs are now plentiful, at 18.2 percent vs July's 15.6 percent, and a bit fewer saying jobs are currently hard to get, at 30.6 percent vs July's 30.9 percent.
The gain in the present situation offsets softness in the expectations component which is down 1.0 point to 90.9. But expectations is a comparatively vague component, reflecting the long-term outlook for jobs and income. Other details include gains for home and auto buying plans and a minimal 1 tenth uptick in 12-month inflation expectations to 5.5 percent.
Turning to the Reuters/University of Michigan sentiment measure, consumer sentiment is up in the final August reading, to 82.5 vs 79.2 at mid-month and vs 81.8 in final July. The gain was centered in current conditions. The current conditions component in this report was at 99.8 versus 99.6 at mid-month and 97.4 in final July. A rise in current conditions points to general month-to-month strength for consumer activity.
Expectations were lagging. The expectations component came in at 71.3, well up from 66.2 at mid-month but down 5 tenths from 71.8 in final July.
 Upward revisions offset a lower-than-expected 412,000 annual sales rate for new home sales in July with the two prior months revised higher by a total of 28,000. July's gain was centered entirely in the South which rose 8.1 percent in the month. The South is by far the largest region for new home sales, outdistancing all other regions combined. Upward revisions offset a lower-than-expected 412,000 annual sales rate for new home sales in July with the two prior months revised higher by a total of 28,000. July's gain was centered entirely in the South which rose 8.1 percent in the month. The South is by far the largest region for new home sales, outdistancing all other regions combined.
Lack of new homes on the market has been constraining sales but perhaps less so now. Supply on the market rose to 205,000 versus 197,000 in June, pulling up the monthly supply to 6.0 months at the current sales rate vs 5.6 in June.
 More and more indications of improvement are coming out of the housing sector, now led by a very strong 3.3 percent rise in the pending home sales index to 105.9. More and more indications of improvement are coming out of the housing sector, now led by a very strong 3.3 percent rise in the pending home sales index to 105.9.
Regional data show convincing gains led by the Northeast at 6.2 percent in the month followed by the South, at 4.2 percent, and the West at 4.0 percent. The Midwest is the only region in the minus column, and only at 0.4 percent.
Home sales are getting a boost from new supply coming into the market and a slowing in price appreciation. An improving jobs market and still low mortgage rates are also important pluses. Today's report points squarely at further gains ahead for final sales of existing homes. The Dow is moving off opening lows following the report.
 Home price appreciation improved in June according to FHFA with a rise of 0.4 percent in June, compared to 0.2 percent in May. But the year-ago rate slowed to 5.1 percent from 5.3 percent in May. Home price appreciation improved in June according to FHFA with a rise of 0.4 percent in June, compared to 0.2 percent in May. But the year-ago rate slowed to 5.1 percent from 5.3 percent in May.
Regionally, nine Census regions showed gains in June; two declined; and one was unchanged.
Home prices are sputtering with the Case-Shiller measure even worse than FHFA.
 Home price appreciation continues to unwind as S&P Case-Shiller 20-city adjusted data showed a 0.2 percent decline in June following a 0.3 percent decline in May. Year-on-year, the adjusted rate was plus 8.1 percent versus 9.3 percent in May. Monthly declines swept 13 of the 20 cities with Minneapolis, Detroit, Atlanta and Chicago showing special weakness. Home price appreciation continues to unwind as S&P Case-Shiller 20-city adjusted data showed a 0.2 percent decline in June following a 0.3 percent decline in May. Year-on-year, the adjusted rate was plus 8.1 percent versus 9.3 percent in May. Monthly declines swept 13 of the 20 cities with Minneapolis, Detroit, Atlanta and Chicago showing special weakness.
Home price appreciation is softening, This is a plus for buyer but is a negative for sellers wanting to put property on the market.
 Durables orders soared in July due to aircraft orders but otherwise came off a moderately strong core number in June. New factory orders for durables soared a monthly 22.6 percent in July, following a 2.7 percent boost in June. Econoday's consensus called for a 5.1 percent gain in July. The high end of forecasts was 24.5 percent. Durables orders soared in July due to aircraft orders but otherwise came off a moderately strong core number in June. New factory orders for durables soared a monthly 22.6 percent in July, following a 2.7 percent boost in June. Econoday's consensus called for a 5.1 percent gain in July. The high end of forecasts was 24.5 percent.
Excluding transportation, durables orders slipped 0.8 percent, following a 3.0 boost in June. But June earlier had been estimated to be up "only" 1.9 percent from the full factory orders report.
Transportation spiked a monthly 74.2 percent after rising 2.1 percent in June. Nondefense aircraft (Boeing) surged 318.0 percent (that is not a typo) after gaining 11.1 percent in June. Another but more moderate positive was motor vehicle orders which gained 10.2 percent, following a 1.3 percent dip in June. Defense aircraft fell 28.8 percent in July, following a rise of 9.2 percent the month before.
Outside of transportation, gains were limited with "other" gaining. Other categories slipped but followed upward revisions to June.
Growth in the nation's service sector remains strong but has moderated this month, to 58.5 versus 61.0 in both the readings for final and mid-month July. Service businesses report strength among both household and business clients as new business remains strong. Employment was up but only slightly though the general outlook is very strong.
The economy appears to be slowly gaining steam although it is uneven. Manufacturing is moderately healthy. Housing is decent in terms of sales but prices may be stalling. Improvement is spreading to the services sector. However, the labor market may still be soft and the next key reading is this coming Friday's employment report for August.
The week's highlight can be considered the Monday Labor Day holiday or Friday's employment situation report for August—depending on whether one is on vacation or not. The Fed's chair, Janet Yellen, has recently emphasized that the labor market is not where it needs to be. Traders will be parsing the employment numbers and thinking whether she is right or not. And Fed hawks will be analyzing the numbers also. The employment report likely will play a key role in the next round of Fed forecasts for the economy, posted with the September 17 FOMC statement.
U.S. Holiday: Labor Day. All Markets Closed.
The Markit PMI manufacturing flash index at 58.0 for the August flash reading, was up a sharp 2.2 points from final July's 55.8 and up 1.7 points from the July flash of 56.3. Details are only provided to Markit subscribers, but the report did note that all five components of the composite contributed to the month's growth led by employment which, now showing its strongest reading since March last year, had been soft in July's report.
Markit PMI manufacturing index (final) Consensus Forecast for August 14: 57.8
Range: 55.5 to 58.0
The composite index from the ISM manufacturing survey reported solid acceleration in July with the composite index rising a sizable 1.8 points to 57.1 in July. This was the best reading since April 2011. And there was a sharp gain in new orders, to 63.4 vs June's 58.9 for the best reading of the year.
ISM manufacturing composite index Consensus Forecast for August 14: 56.8
Range: 55.8 to 58.5
Construction spending unexpectedly fell in June. Construction outlays declined 1.8 percent in June after advancing 0.8 percent in May (upwardly revised from an original 0.1 percent rise). The latest number came in below market expectations for a 0.5 percent increase. The latest drop was led by a 4.0 percent decrease in public outlays in June after a 1.6 percent gain in May. The private sector also was sluggish in the latest month. Private residential outlays dipped 0.3 percent after falling 1.1 percent in May. For the latest month the multifamily component posted a gain while the single-family component fell. Private nonresidential spending declined 1.6 percent in June after a 2.1 percent boost the prior month.
Construction spending Consensus Forecast for July 14: +0.9 percent
Range: +0.6 to +2.0 percent
ADP private payroll employment estimate for July was 218,000. The BLS private payroll gain for July was 198,000.
ADP private payrolls Consensus Forecast for August 14: 223,000
Range: 190,000 to 244,000
Factory orders sector surged higher in June following a weak May with new orders up a much higher-than-expected 1.1 percent following a downward revised 0.6 percent decline in May. The durable goods component, previously released, was revised sharply higher to show a 1.7 percent jump, up from an initial reading of plus 0.7 percent. The component for non-durable goods, the new reading in the latest report, also showed strength, up a solid 0.6 percent following a 0.2 percent decline in May. More recently, new factory orders for durables soared a monthly 22.6 percent in July, following a 2.7 percent boost in June. The surge was due to a huge boost in aircraft orders.
Factory orders Consensus Forecast for July 14: +10.9 percent
Range: +9.6 to +11.6 percent
The Beige Book being prepared for the September 16-17 FOMC meeting is released this afternoon. The most recent Beige Book stated that the pace of economic growth was characterized as moderate in New York, Chicago, Minneapolis, Dallas, and San Francisco, while the remaining Districts reported modest expansion. The consumer and manufacturing sectors saw broad-based growth while real estate activity varied. Labor market conditions improved, as all twelve Districts reported slight to moderate employment growth. Price pressures were generally contained, with most Districts reporting slight to modest price increases for both inputs and finished goods. Overall, the latest Beige Book indicates that growth is improving but at a moderately strong pace while inflation is somewhat subdued.
The U.S. international trade gap in June narrowed again after an unexpectedly large narrowing the month before. The trade gap shrank to $41.5 billion from $44.7 billion in May. Exports edged up 0.1 percent in June after jumping 1.1 percent the month before. Imports fell 1.2 percent, following a 0.1 percent dip in May. The improvement in the trade deficit was led by the goods excluding petroleum gap which decreased to $44.8 billion from $47.1 billion in May. Also the petroleum balance contracted to $14.7 billion in June from $15.2 billion the prior month. The services balance was steady at $18.7 billion. However, the detail in goods imports suggests lack of confidence by businesses in upcoming consumer demand and business investment. For imports, capital goods excluding autos declined $0.3 billion in June; automotive fell $1.1 billion; and consumer goods fell $1.3 billion.
International trade balance Consensus Forecast for July 13: -$42.3 billion
Range: -$43.6 billion to -$40.0 billion
Initial jobless claims continue to move incrementally to lower levels pointing squarely to improvement underway in the labor market. Initial claims edged 1,000 lower in the August 23 week to 298,000. The 4-week average was down 1,250 to 299,750. Continuing claims, which lag by a week, did rise 25,000 in data for the August 16 week, but the 4-week average was down 4,000 to 2.524 million. The unemployment rate for insured workers is unchanged at a recovery low of 1.9 percent.
Jobless Claims Consensus Forecast for 8/30/14: 300,000
Range: 290,000 to 310,000
Nonfarm business productivity in the second quarter rebounded from the first quarter deep freeze. Second quarter productivity growth posted at an annualized 2.5 percent, following a revised 4.5 percent drop in the first quarter. Unit labor costs edged up 0.6 percent after surging 11.8 percent annualized in the first quarter. Looking at components, output jumped 5.2 percent in the nonfarm business sector, following a 2.4 percent decline in the first quarter. Hours worked increased at a 2.7 percent pace after 2.1 percent the prior quarter. But compensation growth slowed to 3.1 percent in the second quarter after jumping an annualized 6.8 percent in the prior quarter.
Nonfarm Business Productivity Consensus Forecast for revised Q2 14: +2.4 percent annual rate
Range: +2.3 to +2.7 percent annual rate
Unit Labor Costs Consensus Forecast for revised Q2 14: +0.5 percent annual rate
Range: -0.1 to +0.8 percent annual rate
The Markit PMI services flash index moderated in August to 58.5 versus 61.0 in both the readings for final and mid-month July. Service businesses report strength among both household and business clients as new business remains strong. Employment was up but only slightly though the general outlook is very strong.
Markit PMI services index (final) Consensus Forecast for August 14: 58.5
Range: 58.3 to 61.5
The composite index from the ISM non-manufacturing survey for July was at a recovery best of 58.7, up a very sizable 2.7 points from June, with new orders also at a recovery best of 64.9, up 3.7 points which points to rising activity ahead. And activity was very strong with the business activity index (akin to a production index) near a recovery best of 62.4 for 4.9 point surge. Employment is also gaining, up 1.6 points to 56.0 which is very strong for this reading.
ISM non-manufacturing composite index Consensus Forecast for August 14: 57.5
Range: 53.2 to 59.8
Nonfarm payroll employment was on the soft side in July but still moderately positive. Total nonfarm payroll jobs rose 209,000 in July after a 298,000 gain in June and a 229,000 rise in May. The net revision for the prior two months was up 15,000. The unemployment rate nudged up to 6.2 percent from 6.1 percent in June. Expectations were for 6.1 percent. The expanded underemployment rate ("U-6") rose to 12.2 percent from 12.1 percent in June. Turning back to the payroll report, private jobs advanced 198,000 after a 270,000 increase the month before. Analysts forecast 233,000. It was the goods-producing sector that was relatively healthy, gaining 58,000 in July, following a 38,000 rise in June. Both manufacturing and construction were healthy. Average weekly hours were unchanged at 34.5 hours. Growth in average hourly earnings was flat at 0.0 percent after a 0.2 percent rise in June.
Nonfarm payrolls Consensus Forecast for August 14: 230,000
Range: 195,000 to 279,000
Private payrolls Consensus Forecast for August 14: 220,000
Range: 187,000 to 270,000
Unemployment rate Consensus Forecast for August 14: 6.1 percent
Range: 6.0 to 6.2 percent
Average workweek Consensus Forecast for August 14: 34.5 hours
Range: 34.5 to 34.6 hours
Average hourly earnings Consensus Forecast for August 14: +0.2 percent
Range: +0.1 to +0.3 percent
R. Mark Rogers is the author of The Complete Idiot's Guide to Economic Indicators, Penguin Books.
He can also be found on a weekly broadcast talking about the U.S. economy, the easiest way to find him is by going to iTunes and searching for "Simply Economics."
Econoday Senior Writer Mark Pender contributed to this article.
|
