|
This past week's economic news was mostly favorable. And stocks dipped on corporate news and Fed worries. But traders will largely be on the sidelines until Wednesday's Fed decision. Don't expect any actual changes in current policy (taper or current policy rates) but there is a good chance of change in guidance.
 Overall, stocks were down for the week. On Monday, equities were mixed in lackluster trading. The energy sector was the biggest negative. Also, traders continued to reflect on the disappointing jobs report. Equities declined Tuesday largely on corporate news. Apple dropped after announcing a new smartwatch. Home Depot dropped a day after the company confirmed its payment security system had been breached. McDonald's declined after it reported lower August same-store sales in all regions. Overall, stocks were down for the week. On Monday, equities were mixed in lackluster trading. The energy sector was the biggest negative. Also, traders continued to reflect on the disappointing jobs report. Equities declined Tuesday largely on corporate news. Apple dropped after announcing a new smartwatch. Home Depot dropped a day after the company confirmed its payment security system had been breached. McDonald's declined after it reported lower August same-store sales in all regions.
 On Wednesday, traders reversed course on Apple with the stock up over 3 percent for the day, helping to lift overall equities. New polls from Scotland also showed that a majority favor remaining part of the U.K. after an earlier poll said it favored independence. Traders prefer unification as there will be financial disruptions otherwise. On Wednesday, traders reversed course on Apple with the stock up over 3 percent for the day, helping to lift overall equities. New polls from Scotland also showed that a majority favor remaining part of the U.K. after an earlier poll said it favored independence. Traders prefer unification as there will be financial disruptions otherwise.
Stocks were mixed Thursday but with the Dow the notable decliner. Other major indexes were mostly up marginally as a modest rise in initial jobless claims weighed on stocks. Good news was bad news Friday as strong retail sales raised bets that the Fed will rates earlier in 2015 than later. Equities were down moderately for the day.
Equities were down this past week. The Dow was down 0.9 percent; the S&P 500, down 1.1 percent; the Nasdaq, down 0.3 percent; the Russell 2000, down 0.8 percent; and the Wilshire 5000, down 1.1 percent.
For the year-to-date, major indexes mostly are up as follows: the Dow, up 2.5 percent; the S&P 500, up 7.4 percent; the Nasdaq, up 9.4 percent; and the Wilshire 5000, up 6.8 percent. The Russell 2000 is down 0.3 percent.
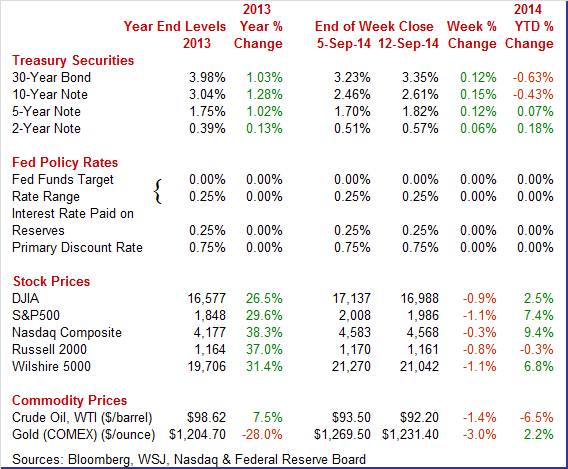
Weekly percent change column reflects percent changes for all components except interest rates. Interest rate changes are reflected in simple differences.
 It was a mostly quiet week for Treasury yields. The daily exception was Friday. Yields rose on news of healthy retail sales. This fueled speculation that the Fed may start to raise policy rates early in 2015 and with the upcoming FOMC meeting the Fed may remove a reference to interest rates staying low for a "considerable time" after it ends bond buying. It was a mostly quiet week for Treasury yields. The daily exception was Friday. Yields rose on news of healthy retail sales. This fueled speculation that the Fed may start to raise policy rates early in 2015 and with the upcoming FOMC meeting the Fed may remove a reference to interest rates staying low for a "considerable time" after it ends bond buying.
For this past week Treasury rates were up as follows: the 2-year note, up 6 basis points; the 5-year note, up 12 basis points; the 7-year note, up 14 basis points; the 10-year note, up 15 basis points; and the 30-year bond, up 12 basis points. The 3-month T-bill nudged down 1 basis point.
 The spot price of West Texas Intermediate continued to ease lower this past week. After a very quiet Monday, crude slipped Tuesday on comments that Libyan production was rising. WTI fell just over a dollar a barrel Wednesday on news that inventories were not as low as expected. Oil rose Thursday about a dollar a barrel on higher tensions between Ukraine and Russia. However, the trend is lower on slower growth in Europe and Asia. The spot price of West Texas Intermediate continued to ease lower this past week. After a very quiet Monday, crude slipped Tuesday on comments that Libyan production was rising. WTI fell just over a dollar a barrel Wednesday on news that inventories were not as low as expected. Oil rose Thursday about a dollar a barrel on higher tensions between Ukraine and Russia. However, the trend is lower on slower growth in Europe and Asia.
Net for the week, the spot price for West Texas Intermediate declined $1.30 per barrel to settle at $92.20.
The economy appears to be improving in the third quarter with labor market numbers being the exception. But the consumer sector is a relatively good mood regardless—raising the question of the reliability of labor data.
 The latest retail sales report suggests that the consumer sector is stronger than indicated by labor market numbers. The consumer is out spending. Retail sales jumped 0.6 percent in August after a rise of 0.3 percent the month before. The July upward revision was significant—previous estimate was zero. The latest retail sales report suggests that the consumer sector is stronger than indicated by labor market numbers. The consumer is out spending. Retail sales jumped 0.6 percent in August after a rise of 0.3 percent the month before. The July upward revision was significant—previous estimate was zero.
Excluding autos, sales gained 0.3 percent in both August and July, matching expectations. Excluding both autos and gasoline sales were quite healthy, increasing 0.5 percent, following a rise of 0.3 percent in July.
By detail, not surprisingly, motor vehicles increased 1.5 percent. Next, building materials & garden equipment gained 1.4 percent—suggesting some improvement in housing. Food services & drinking places sales were up 0.6 percent, showing healthy improvement in discretionary spending. This is a good sign for the consumer sector.
Weakness was led by a 0.8 percent decline in gasoline sales—clearly a price effect to a large degree. Also, general merchandise dipped 0.1 percent.
Overall, August retail sales were healthy and point to moderately strong third quarter GDP growth. Economic news has oscillated in recent months but consumer spending may be suggesting that the economy is stronger than suggested by labor market numbers.
 Consumer spending appears to being lifted by improved optimism. Consumer spending appears to being lifted by improved optimism.
Consumer sentiment is on the rise the first half of this month, climbing to 84.6 versus a final August reading of 82.5 and a mid-month August reading of 79.2. The gain, however, is centered in the expectations component, not the current conditions component which slipped to 98.5 versus 99.8 in final August and 99.6 in mid-month August.
A key question is whether the dip in current conditions overrides expectations for near-term consumer spending.
The gain in expectations, to 75.6 versus 71.3 in final August and well up from 66.2 in mid-month August, does point to long-term confidence in the jobs and income outlooks. This gain may be tied in part to lower gasoline prices and lack of concern over inflationary pressures. One-year inflation expectations are definitely coming down, to 3.0 percent vs 3.2 percent in final August and 3.4 percent at mid-month August. Five-year expectations are at 2.8 percent, down 1 tenth from final August and unchanged from mid-month August.
Labor market numbers are still sluggish. That point will be well noted at this coming week's FOMC meeting. After last week's disappointing employment report, the latest JOLTS report fits the same pattern.
 There were 4.673 million job openings on the last business day of July, little changed from June's 4.675 million. The hires rate (3.5 percent) and the separations rate (3.3 percent) were unchanged in July. Within separations, the quits rate (1.8 percent) and the layoffs and discharges rate (1.2 percent) were unchanged. There were 4.673 million job openings on the last business day of July, little changed from June's 4.675 million. The hires rate (3.5 percent) and the separations rate (3.3 percent) were unchanged in July. Within separations, the quits rate (1.8 percent) and the layoffs and discharges rate (1.2 percent) were unchanged.
There were 4.872 million hires in July, compared to 4.791 million in June and the rate was 3.5 percent.
Over the 12 months ending in July, the number of hires (not seasonally adjusted) increased for total nonfarm and total private and was little changed for government. The hires level increased over the year for construction and retail trade but decreased for educational services.
There were 4.559 million total separations in July and the rate was 3.3 percent. The number of separations was little changed from June for total nonfarm, total private, and government.
The latest JOLTS report will likely add argument to Fed doves to keep policy easy.
 Consumers are reaching for the plastic. Is that a sign of consumer confidence or sign of financial distress' Based on detail in the retail sales report, it appears to be confidence as discretionary sales have picked up. Consumers are reaching for the plastic. Is that a sign of consumer confidence or sign of financial distress' Based on detail in the retail sales report, it appears to be confidence as discretionary sales have picked up.
Consumer credit jumped an outsized $26.0 billion in July on top of an upward revised $18.8 billion jump in June. But it's revolving credit, the component where credit cards are tracked, that especially stands out in the report, up $5.4 billion vs a $1.8 billion gain in June. This component has been stubbornly flat throughout the recovery and further gains in future reports would mark a long-awaited upturn in consumer spirits.
The non-revolving component, as usual, is very strong, up $20.6 billion in July versus a $17.0 billion gain in June. But July's gain, unlike prior gains, is centered entirely in vehicle financing, not the government's acquisition of student loans from private lenders which contracted in the month.
This report offers a very strong positive signal for the consumer sector.
 The doves within the Fed clearly will have liked the latest inflation news—although it is the narrowly focused import and export prices report. The doves within the Fed clearly will have liked the latest inflation news—although it is the narrowly focused import and export prices report.
Import prices fell 0.9 percent in August but were skewed by a 4.4 percent fall in petroleum products. Excluding petroleum, import prices edged 0.1 percent lower. The year-on-year rate, which had been edging higher in recent months, is back in the negative column at minus 0.4 percent. But here again excluding petroleum, the year-on-year is in the plus column at 0.8 percent.
 Export prices fell 0.5 percent in the month for a year-on-year rate of plus 0.4 percent. Excluding agricultural products, prices fell 0.3 percent for a year-on-year rate of plus 0.5 percent. Export prices fell 0.5 percent in the month for a year-on-year rate of plus 0.4 percent. Excluding agricultural products, prices fell 0.3 percent for a year-on-year rate of plus 0.5 percent.
A look at prices of finished goods, both imports and exports, shows no major red flags. The largest year-on-year increase is exported consumer goods at plus 1.0 percent. Exported capital goods and imported consumer goods are both at a year-on-year plus 0.8 percent. The year-on-year rate for imported motor vehicles is minus 0.7 percent.
Consumers are back spending. Inflation is low—at least from imports. This past week's data likely raise the volume of internal Fed debate at this week's FOMC meeting. Is the economy growing stronger' Are the labor data suspect' And despite low import inflation, what is the outlook for PCE inflation' And we do get an update on Fed forecasts this week.
This week's news is wide ranging. The Fed posts its decision Wednesday along with updated forecasts. Both manufacturing and housing have shown some renewed vigor. Regional surveys have not always been in line with national data on manufacturing. The New York Fed's survey has been soft and posts Monday for September while national industrial production hits the wires the same day. Housing has shown improvement with a jump in July starts and with a rise in the NAHB housing market index. But mortgage purchase applications have slipped. Thursday's housing starts report will be an important update on this sector.
The Empire State manufacturing index slowed in August but remained very solid, at 14.69 versus 25.60 in July. New orders were still strong, at 14.14 versus 18.77, while shipments actually accelerated slightly, to a very strong 24.59 from 23.64.
Empire State Manufacturing Survey Consensus Forecast for September 14: 15.9
Range: 10.0 to 18.0
Industrial production led the economy in July and was stronger than earlier believed in June. Industrial production increased a robust 0.4 percent in July, equaling the revised June pace (originally up 0.2 percent). The manufacturing component surged 1.0 percent in July, following a 0.3 percent increase in June. Mining advanced 0.3 percent after jumping 1.3 percent in June. Utilities dropped 3.4 percent, following a 0.7 percent dip in June. The overall capacity utilization rate in July firmed to 79.2 percent from 79.1 percent the month before.
Industrial production Consensus Forecast for August 14: +0.3 percent
Range: 0.0 to +0.5 percent
Manufacturing production component Consensus Forecast for August 14: +0.1 percent
Range: -0.2 to +0.5 percent
Capacity utilization Consensus Forecast for August 14: 79.3 percent
Range: 79.1 to 79.5 percent
The producer price index for final demand slowed to a 0.1 percent gain in July after rebounding 0.4 percent in June. Total final demand excluding food & energy rose 0.2 percent in both July and June and equaled the consensus forecast. Total final demand excluding food, energy, and trade services increased 0.2 percent in July, matching the June pace. On a seasonally adjusted year-ago basis, PPI final demand was up 1.7 percent in July versus 1.9 percent in June. Excluding food & energy, PPI final demand was up 1.6 percent compared to 1.7 percent in June.
PPI-FD Consensus Forecast for August 14: 0.0 percent
Range: -0.2 to +0.2 percent
PPI-FD ex Food & Energy Consensus Forecast for August 14: +0.1 percent
Range: 0.0 to +0.2 percent
The consumer price index rose 0.1 percent in July after a strong 0.3 percent boost the month before. Excluding food and energy, the CPI gained only 0.1 percent-the same as in June and coming slightly below forecasts for 0.2 percent. Energy dipped 0.3 percent in July after jumping 1.6 percent in June. Food was on the hot side with a 0.4 percent jump, following a 0.1 percent increase in June. Within the core, gains were seen in shelter, medical care, new vehicles, personal care, and apparel. Indexes for airline fares, recreation, used cars and trucks, for household furnishings and operations, and for tobacco declined in July.
CPI Consensus Forecast for August 14 0.0 percent
Range: -0.1 to +0.1 percent
CPI ex food & energy Consensus Forecast for August 14: +0.2 percent
Range: 0.0 to +0.2 percent
The U.S. current account deficit shot back higher in the first quarter to $111.2 billion from a revised $87.3 billion in the fourth quarter. The rise in the gap reflects a softening in exports, a rise in imports, a dip in income from overseas holding companies, and an increase in government transfers. The current account as a percentage of GDP rose to 2.6 percent from 2.0 percent in the prior quarter.
Current account Consensus Forecast for Q2 14: -$114.0 billion
Range: -$115.0 billion to -$103.9 billion
The NAHB housing market index for August came in at a very solid 55, up 2 points from July for the best reading since January. All components improved led by future sales, up 2 points to 65, and followed by present sales, also up 2 points to 58. Up 3 points is the lagging component of traffic which, however, at 42 shows its best reading since December.
NAHB housing market index Consensus Forecast for September 14: 56
Range: 54 to 58
The FOMC announcement at 2:00 p.m. ET for the September 16-17 FOMC policy meeting is expected to leave policy rates unchanged. Market focus will be on guidance for rates. Little is expected on changes to taper. There may be discussion of preparing for actual unwinding of the Fed's balance sheet. Also, the Fed will release its quarterly forecasts at the same time as the statement.
FOMC Consensus Forecast for 9/17/13 policy vote on fed funds target range: unchanged at a range of zero to 0.25 percent
Chair press conference after the FOMC meeting statement is scheduled for 2:30 p.m. ET. Fed Chair Janet Yellen conducts a press conference after FOMC meetings in which participants present their quarterly economic forecasts. Yellen is expected to comment on the forecast and take Q&A.
Housing starts for July jumped to an annualized pace of 1.093 million units-up from 0.945 million units the prior month. July was up a sharp 15.7 percent (monthly), after dipping 4.0 percent in June. July's pace was the highest level since November 2013. Strength was led by the multifamily component which surged 28.9 percent after a 3.1 percent decline in June. But the single-family component showed health with an 8.3 percent rebound after falling 4.4 percent in June. According to building permits, momentum is building-but largely for the multifamily component. Permits jumped a monthly 8.1 percent to an annualized pace of 1.052 million units. For July, the multifamily component gained 21.5 percent while the single-family component edged up 0.9 percent.
Housing starts Consensus Forecast for August 14: 1.038 million-unit rate
Range: 0.995 million to 1.100 million-unit rate
Housing permits Consensus Forecast for August 14: 1.055 million-unit rate
Range: 0.990 million to 1.111 million-unit rate
Initial jobless claims remain at low levels but are edging slightly higher. Initial claims rose 11,000 in the September 6 week to 315,000, pulling up the 4-week average slightly to a 304,000 level that is 8,000 above the month-ago comparison. Data for continuing claims, which lag by a week, showed a 9,000 rise in the August 30 week to 2.487 million. But here, the 4-week average is trending slightly lower, down 15,000 in the week to a 2.499 million level that is a new recovery low and 20,000 below the month-ago comparison.
Jobless Claims Consensus Forecast for 9/13/14: 305,000
Range: 290,000 to 325,000
The general business conditions index of the Philadelphia Fed's Business Outlook Survey posted at 28.0 for August versus July's 23.9. However, the new orders index slowed very sharply to 14.7 versus July's 34.2, while shipments were at 16.5, likewise well down from another 34.2 in July.
Philadelphia Fed survey Consensus Forecast for September 14: 23.0
Range: 15.0 to 29.0
The Conference Board's index of leading indicators jumped 0.9 percent in July versus a sharply upward revised 0.6 percent gain in June (plus 0.3 percent prior). May's gain was also revised and was also at 0.6 percent (plus 0.7 percent prior). The drop underway in unemployment claims is a leading and very convincing factor for the strength in July. The yield spread, as usual, was the month's strongest factor reflecting the Federal Reserve's stimulative monetary policy. Building permits were also especially strong but come off a very low base in June. Strength in the manufacturing sector was another factor behind the month's gain, specifically the ISM's new orders index. The report's credit component was also strong pointing to rising demand and access to loans.
Leading indicators Consensus Forecast for August 14: +0.4 percent
Range: +0.3 to +0.6 percent
R. Mark Rogers is the author of The Complete Idiot's Guide to Economic Indicators, Penguin Books.
He can also be found on a weekly broadcast talking about the U.S. economy, the easiest way to find him is by going to iTunes and searching for "Simply Economics."
Econoday Senior Writer Mark Pender contributed to this article.
|
