|
Sometimes good news is bad news if markets believe the Fed will speed up policy actions. However, this past week's better-than-expected jobs gain for September was seen as good news. Earlier in the week, geopolitical events and some indicator news tugged down on equities.
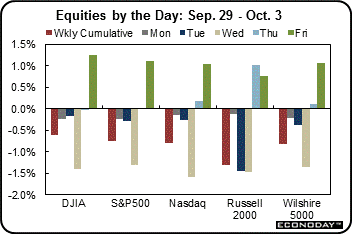 Equities were down sharply through Thursday but good numbers from the employment report on Friday cut losses notably. Equities were down sharply through Thursday but good numbers from the employment report on Friday cut losses notably.
 At the start of the week, stocks fell, after the worst week in almost two months for the Standard & Poor's 500 Index, as protests in Hong Kong were added to geopolitical concerns. Also, a rebound in consumer spending raised speculation that the Fed may raise interest rates sooner than earlier anticipated. Stocks declined Tuesday due to disappointing economic data and declining energy and materials shares. Consumer confidence unexpectedly declined in September to a four month low. The Case-Shiller home price index dipped in July. At the start of the week, stocks fell, after the worst week in almost two months for the Standard & Poor's 500 Index, as protests in Hong Kong were added to geopolitical concerns. Also, a rebound in consumer spending raised speculation that the Fed may raise interest rates sooner than earlier anticipated. Stocks declined Tuesday due to disappointing economic data and declining energy and materials shares. Consumer confidence unexpectedly declined in September to a four month low. The Case-Shiller home price index dipped in July.
At midweek, stocks began the new quarter and month by sinking after a string of disappointing economic numbers and as the first diagnosis of Ebola in a patient in the United States pressured shares of airlines and other transportation shares. Stocks hit their lowest levels since mid-August. The Institute for Supply Management reported that its manufacturing index for September was 56.6, below forecasts for 58.0. August construction spending slipped 0.8 percent from the previous month, while an increase of 0.5 percent was expected. Overseas news also had impact. In the Eurozone, Germany's manufacturing PMI contracted for the first time in 15 months with a reading of 49.9. The Russell 2000 dropped into correction territory.
Thursday, stocks ended nearly unchanged Thursday, while small-cap shares rebounded. There was a notable amount of bottom fishing and initial jobless claims declined more than expected. At the end of the week, better-than-expected payroll gains were seen as good news for the economy and stocks recouped part of the losses seen earlier in the week.
 Equities were down this past week. The Dow was down 0.6 percent; the S&P 500, down 0.8 percent; the Nasdaq, down 0.8 percent; the Russell 2000, down 1.3 percent; and the Wilshire 5000, down 0.8 percent. Equities were down this past week. The Dow was down 0.6 percent; the S&P 500, down 0.8 percent; the Nasdaq, down 0.8 percent; the Russell 2000, down 1.3 percent; and the Wilshire 5000, down 0.8 percent.

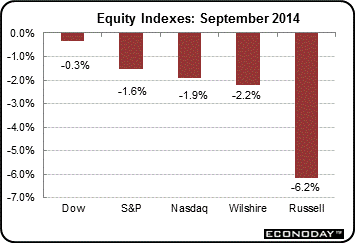
Equities were down for September. The Dow was down 0.3 percent; the S&P 500, down 1.6 percent; the Nasdaq, down 1.9 percent; the Russell 2000, down 6.2 percent; and the Wilshire 5000, down 2.2 percent.
Equities were mixed for the third quarter. The Dow was up 1.3 percent; the S&P 500, up 0.6 percent; the Nasdaq, up 1.9 percent; the Russell 2000, down 7.7 percent; and the Wilshire 5000, down 0.5 percent.
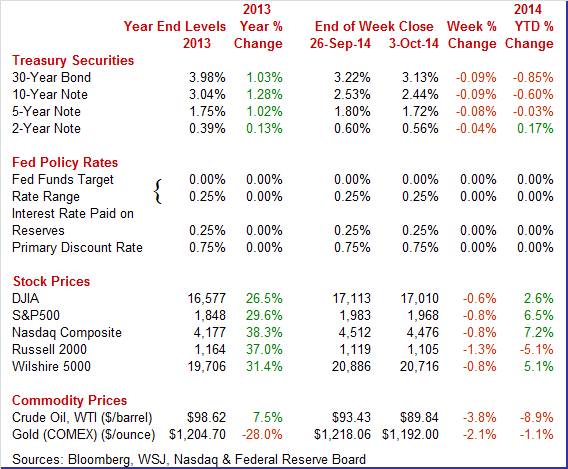
For the year-to-date, major indexes are mostly up as follows: the Dow, up 2.6 percent; the S&P 500, up 6.5 percent; the Nasdaq, up 7.2 percent; the Russell 2000, down 5.1 percent; and the Wilshire 5000, up 5.1 percent.
Weekly percent change column reflects percent changes for all components except interest rates. Interest rate changes are reflected in simple differences.
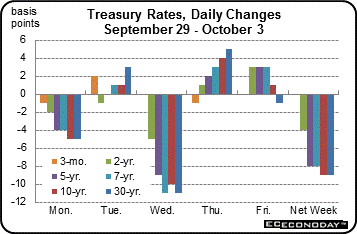 Treasury yields were down moderately this past week. Monday, yields dipped on flight to safety on news of protests in Hong Kong. After little change Tuesday, rates declined notably Wednesday as traders shifted funds from overseas funds to U.S. funds as most Group of Seven nations had less attractive rates along with concern that global growth is slowing. Thursday, yields firmed on lower-than-expected initial jobless claims. At week's close, rates edged up on the jobs report. Treasury yields were down moderately this past week. Monday, yields dipped on flight to safety on news of protests in Hong Kong. After little change Tuesday, rates declined notably Wednesday as traders shifted funds from overseas funds to U.S. funds as most Group of Seven nations had less attractive rates along with concern that global growth is slowing. Thursday, yields firmed on lower-than-expected initial jobless claims. At week's close, rates edged up on the jobs report.
For this past week Treasury rates were down as follows: the 2-year note, down 4 basis points; the 5-year note, down 8 basis points; the 7-year note, down 8 basis points; the 10-year note, down 9 basis points; and the 30-year bond, down 9 basis points. The 3-month T-bill was unchanged.
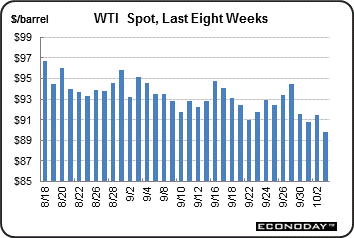 The spot price of West Texas Intermediate ended the week down sharply. However, the week started in the other direction with a gain of a dollar a barrel Monday on belief that stronger U.S. growth would boost demand. But Tuesday, crude fell $3 per barrel on news of supply gains from OPEC—notably led by a rebound in Libyan output. The supply issue more than offset concerns about demand from military actions against ISIS. The spot price of West Texas Intermediate ended the week down sharply. However, the week started in the other direction with a gain of a dollar a barrel Monday on belief that stronger U.S. growth would boost demand. But Tuesday, crude fell $3 per barrel on news of supply gains from OPEC—notably led by a rebound in Libyan output. The supply issue more than offset concerns about demand from military actions against ISIS.
Crude slipped Wednesday after Saudi Arabia cut its benchmark price. Thursday saw a nudge up in price after a drop in initial jobless claims. But on Thursday, West Texas Intermediate crude fell below $90 for the first time in 17 months in intraday trading. At week's end, crude was at the lowest in 1-1/2 years. Oil production in the U.S., Saudi Arabia, and Russia were outstripping demand.
Net for the week, the spot price for West Texas Intermediate dropped $3.59 per barrel to settle at $89.84.
Economic news was very mixed this past week. But the highlight was a mostly favorable employment situation report.
 The labor market improved in September for the most part. Job growth topped expectations, The unemployment rate declined. However, wage inflation is oscillating but remaining on a low trajectory up. The labor market improved in September for the most part. Job growth topped expectations, The unemployment rate declined. However, wage inflation is oscillating but remaining on a low trajectory up.
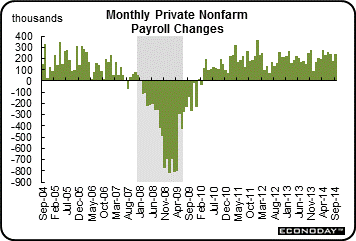
Nonfarm payroll jobs gained 248,000, after a 180,000 rise in August and 243,000 increase in July. Revisions to July and August were quite sizeable and positive. Net revisions for July and August were up a sharp 69,000. The median market forecast for September was for a 215,000 gain.
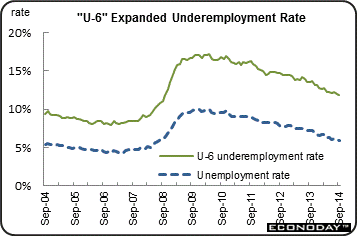 The unemployment rate declined to 5.9 percent from 6.1 percent in August. Expectations were for 6.1 percent. The jobless rate is at a six year low. From the household survey in September, the labor force declined 97,000, employment gained 232,000, and the number of unemployed dropped 329,000. The unemployment rate declined to 5.9 percent from 6.1 percent in August. Expectations were for 6.1 percent. The jobless rate is at a six year low. From the household survey in September, the labor force declined 97,000, employment gained 232,000, and the number of unemployed dropped 329,000.
The "U-6" under-employment rate dipped to 11.8 percent from 12.0 percent in August. This figure includes unemployed, those working part time for economic reasons, and those marginally attached to the labor force.
Going back to the payroll report, private payrolls advanced 236,000 in September after a 175,000 boost in August. Expectations were for 215,000.
Goods-producing jobs jumped 29,000 in September after a 14,000 rise the month before. Manufacturing employment increased 4,000 in September, following a decrease of 4,000 in August. Motor vehicles and parts rebounded 3,000, after dipping 5,000 in August. Construction advanced 16,000 in each of the two latest months. Mining jumped 9,000 in September, following a 2,000 rise in August.
Private service-providing jobs jumped 207,000 after a 161,000 gain in August. Strength was seen in professional & business services and retail trade.
Average hourly earnings were unchanged in September after a 0.3 percent rise the month before. On a year-ago basis, growth in average hourly earnings softened to 2.3 percent from 2.5 percent in August.
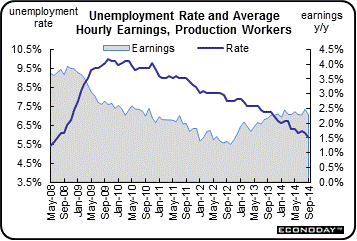 Average weekly hours ticked up to 34.6 hours versus 34.5 hours in August and expectations for 34.5 hours. Average weekly hours ticked up to 34.6 hours versus 34.5 hours in August and expectations for 34.5 hours.
Looking ahead to the personal income report, from the payroll survey, private aggregate weekly earnings rose 0.4 percent in September, pointing to a moderate rise in private wages & salaries. Production worker hours in manufacturing were up 0.4 percent for the month, suggesting a moderately strong manufacturing component for September industrial production. This is consistent with early data from regional Fed surveys on manufacturing.
Overall, job growth improved while wage inflation remained soft. The Fed still has many options for policy.
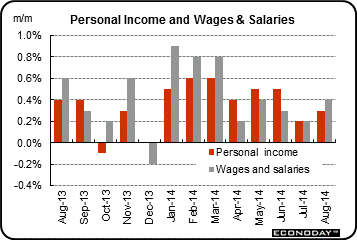 Despite swings in mood, the consumer is out spending. The consumer sector showed improvement in August for both income and spending. Personal income growth posted a 0.3 percent gain in August, following a 0.2 percent rise in July. The wages & salaries component was even stronger with a 0.4 percent boost, following a 0.2 percent increase the month before. Despite swings in mood, the consumer is out spending. The consumer sector showed improvement in August for both income and spending. Personal income growth posted a 0.3 percent gain in August, following a 0.2 percent rise in July. The wages & salaries component was even stronger with a 0.4 percent boost, following a 0.2 percent increase the month before.
Personal spending jumped 0.5 percent after no change in July. Analysts forecast a 0.5 percent boost. Strength was in the durables component which jumped 1.8 percent after no change in July. August reflected a jump in auto sales. Lower gasoline prices tugged down on nondurables. Nondurable spending declined 0.3 percent after no change in July. Services jumped 0.5 percent in August after being unchanged the month before.
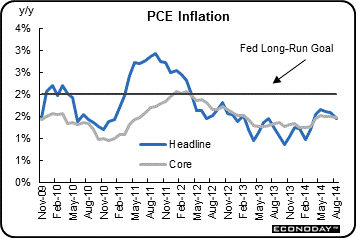 The latest inflation numbers give the Fed plenty of flexibility for maintaining loose monetary policy. PCE inflation slowed to a monthly no change in August from 0.1 percent in July. Core PCE inflation posted at 0.1 percent, equaling the pace for July. The latest inflation numbers give the Fed plenty of flexibility for maintaining loose monetary policy. PCE inflation slowed to a monthly no change in August from 0.1 percent in July. Core PCE inflation posted at 0.1 percent, equaling the pace for July.
On a year-ago basis, headline PCE inflation eased to 1.5 percent from 1.6 percent in July. Year-ago core inflation was 1.5 percent in both August and July. Again, PCE inflation remains well below the Fed goal of 2 percent.
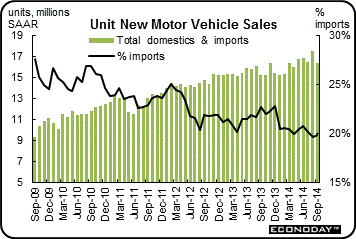 Auto dealer incentives can cause notable monthly swings in sales and that appears to be the case over the last two months. Auto dealer incentives can cause notable monthly swings in sales and that appears to be the case over the last two months.
Sales of cars and light trucks fell a very sharp 6.3 percent in September compared to an extraordinarily strong August, to a lower-than-expected annual rate of 16.4 million units. All categories showed declines especially domestic-made cars which fell 9.1 percent. The latest results point to weakness for the motor vehicle component of the government's September retail sales report, a component that has been an extremely positive factor for retail sales through the whole recovery and especially in August when it rose a monthly 1.5 percent.
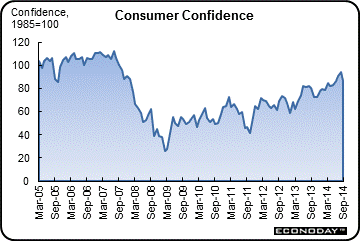 Despite healthy spending, the consumer mood has turned sour. Consumer confidence has suddenly reversed course, falling to 86.0 from August's revised recovery high of 93.4. The September reading was well below the Econoday consensus forecast for 92.5 and well below the low end estimate of 90.0. Despite healthy spending, the consumer mood has turned sour. Consumer confidence has suddenly reversed course, falling to 86.0 from August's revised recovery high of 93.4. The September reading was well below the Econoday consensus forecast for 92.5 and well below the low end estimate of 90.0.
Weakness was centered in the expectations component as confidence in the economic outlook and in the jobs outlook fell. And there was also weakness in the current conditions component as fewer consumers describe current job openings as plentiful, at 15.1 percent vs August's 17.6 percent. But the jobs-hard-to-get reading, which is closely watched for clues on the monthly employment report, showed only fractional weakness, rising to 30.1 percent from 30.0 percent.
Other readings included sizable dips for auto and home buying plans. And September's weakness wasn't due to rising gas prices or rising inflation expectations, the latter dipping 1 tenth to 5.4 percent for the 1-year outlook.
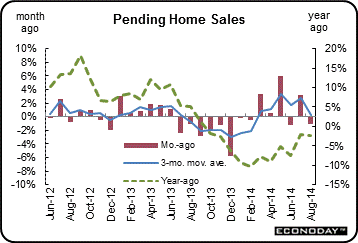 Housing appears to not be adding to near-term economic growth. The outlook for the used home market remains stubbornly flat, with pending home sales down a disappointing 1.0 percent in August. Year-on-year, pending home sales in August were down 2.2 percent which is roughly in line with a 5.3 percent decline for final sales of existing homes in data that were released in the prior week. Housing appears to not be adding to near-term economic growth. The outlook for the used home market remains stubbornly flat, with pending home sales down a disappointing 1.0 percent in August. Year-on-year, pending home sales in August were down 2.2 percent which is roughly in line with a 5.3 percent decline for final sales of existing homes in data that were released in the prior week.
A lack of first-time buyers and strong demand for rentals remain key obstacles for home sales. A lack of distressed homes on the market is another negative factor. Mortgage rates for now are still low but are likely to begin to rise as the Fed withdraws stimulus and begins to raise rates, a prospect that points to continued sales weakness ahead.
Regionally, weakness in sales trends for existing homes has been spread evenly with the West lagging slightly. Weakness in the latest report was centered in the Midwest where pending sales fell 2.1 percent for a year-on-year decline of 7.6 percent. The Northeast showed an even steeper 3.0 percent decline in the month though it is the only region with a positive year-on-year rate at plus 1.6 percent. Pending sales rose 2.6 percent in the West though the year-on-year is minus 2.6 percent while the South, which is by far the largest housing region, showed a 1.4 percent decline in the month and no change on the year.
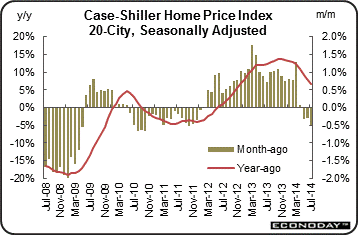 Econ 101 focuses on prices as a key indicator of market strength. For housing currently, prices have not just stalled but have slipped—indicating a softening in demand. Econ 101 focuses on prices as a key indicator of market strength. For housing currently, prices have not just stalled but have slipped—indicating a softening in demand.
Home prices were contracting sharply in July, down 0.5 percent for the third straight decline and the steepest monthly decline in Case-Shiller 20-city seasonally adjusted data going back to November 2011. The reading was below the low end of the Econoday consensus and far below the 0.1 percent gain that was expected. The year-on-year rate, which has been coming down steadily all year from the low double digits, came in at plus 6.7 percent for the lowest reading since November 2012 and down sharply from 8.0 percent in June.
Fourteen for the 20-city sample showed declines in the month with Chicago and Minneapolis showing the most severe declines, at minus 1.6 percent in the month. Three cities showed no change leaving three with gains led by Las Vegas at only plus 0.3 percent.
Unadjusted data are tracked closely in this report and year-on-year, where adjustment factors are neutralized, tell the same story for July with the 20-city sample at plus 6.7 percent vs June's unadjusted 8.1 percent. But the month-on-month reading, reflecting seasonal pricing strength tied to favorable weather, showed a gain, at plus 0.6 percent which however is down from 1.0 percent in June and 1.1 percent in the two prior months.
Eroding home prices are a negative of course for homeowner wealth but are a positive for sales which have been sagging.
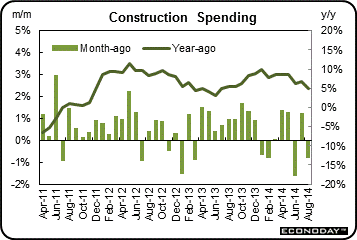 Construction activity unexpectedly reversed course in the wrong direction in August. Construction spending declined 0.8 percent in August after a 1.2 percent rebound in July. Market expectations were for a 0.5 percent gain. August's decrease was led by the private nonresidential sector-down 1.4 percent, following a 1.3 percent increase in July. Public spending fell 0.9 percent in August after jumping 2.1 percent the prior month. Private residential outlays eased 0.1 percent, following a 0.4 percent boost in July. Construction activity unexpectedly reversed course in the wrong direction in August. Construction spending declined 0.8 percent in August after a 1.2 percent rebound in July. Market expectations were for a 0.5 percent gain. August's decrease was led by the private nonresidential sector-down 1.4 percent, following a 1.3 percent increase in July. Public spending fell 0.9 percent in August after jumping 2.1 percent the prior month. Private residential outlays eased 0.1 percent, following a 0.4 percent boost in July.
Looking at detail, the private residential component was actually favorable. Weakness was in residential excluding new homes, which are largely improvements. This subcomponent fell 2.0 percent after edging up 0.2 percent in July. On the plus side, new one-family outlays advanced 0.7 percent in August, following a 0.8 percent increase the prior month. New multifamily outlays rebounded 1.4 percent after a 0.5 percent dip in July. New private residential outlays were moderately healthy on average over the last two months.
On a year-ago basis, total outlays were up 5.0 percent in August, compared to 6.9 percent in July.
Again, the construction outlays data have been volatile recently on a monthly basis. But there is a mild upward trend although it is not as strong as earlier this year.
National surveys are pointing to moderately strong growth in manufacturing in September. Markit's US manufacturing sample posted strong and steady growth in September, at 57.5 which was down only marginally from 57.9 in both the mid-month flash reading and final August reading. Details are not provided to the public but the report described rates of output and new order growth as strong. Employment was also a standout in the report, posting a 2-1/2 year high. Most inflationary readings in various reports have been muted, but not in this report where both input and output prices showed their sharpest rise since December 2013. Other details included a rise in new export orders to a 3-year high.
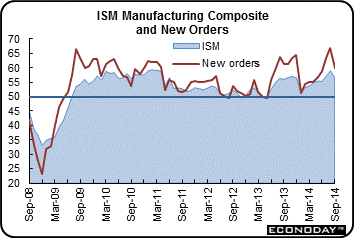 Composite activity slowed but nevertheless remained solid for the ISM manufacturing sample where the headline index fell 2.4 points to 56.6. Growth in new orders slowed noticeably, down 6.7 points from August, but was still very strong at 60.0. Backlog orders, however, fell into contraction, down 5.5 points to 47.0. A plus in the report was a fractional uptick in production to 64.6, the likely result of working down backlog. Composite activity slowed but nevertheless remained solid for the ISM manufacturing sample where the headline index fell 2.4 points to 56.6. Growth in new orders slowed noticeably, down 6.7 points from August, but was still very strong at 60.0. Backlog orders, however, fell into contraction, down 5.5 points to 47.0. A plus in the report was a fractional uptick in production to 64.6, the likely result of working down backlog.
The solid rate of production is an important plus in this report that points to a solid gain for the manufacturing component of the industrial production report.
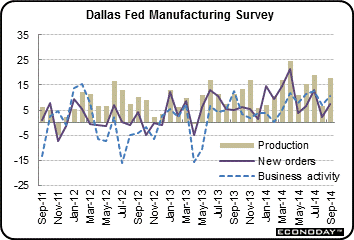 You can add the Dallas Fed manufacturing report to the list of regional Fed surveys showing improvement in manufacturing in September. The production index, a key measure of state manufacturing conditions, rose markedly from 6.8 to 17.6, indicating output grew at a faster pace than in August. You can add the Dallas Fed manufacturing report to the list of regional Fed surveys showing improvement in manufacturing in September. The production index, a key measure of state manufacturing conditions, rose markedly from 6.8 to 17.6, indicating output grew at a faster pace than in August.
Other measures of current manufacturing activity also reflected significantly stronger growth in September. The new orders index climbed 5 points to 7.5-suggesting improved forward momentum. The capacity utilization index surged to 20.2 after dipping to 3.6 in August, with nearly a third of manufacturers noting an increase. The shipments index rebounded to 15.9 after falling to 6.4 last month.
Perceptions of broader business conditions were more optimistic in September. The general business activity index moved up to a reading of 10.8, nearly four points above its non-recession average of 7. Texas has the second highest manufacturing output by state.
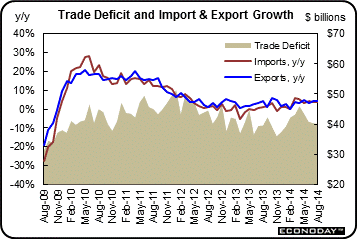 The latest international trade report has two key bonuses for the consumer sector—lower oil prices and signs of improved demand ahead. The latest international trade report has two key bonuses for the consumer sector—lower oil prices and signs of improved demand ahead.
Lower oil prices helped the trade gap shrink in August. The trade deficit in August narrowed to $40.1 billion from $40.0 billion in July,
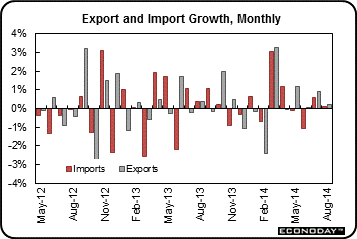
Exports advanced 0.2 percent in August, following a 0.9 percent jump in July. Imports edged up 0.1 percent, following a 0.6 percent gain in July.
 The petroleum balance shrank to $13.1 billion from $14.5 billion in July. The services surplus expanded to $19.8 billion from $19.5 billion. However, the goods excluding petroleum gap increased to $45.1 billion from $44.3 billion in July. The petroleum balance shrank to $13.1 billion from $14.5 billion in July. The services surplus expanded to $19.8 billion from $19.5 billion. However, the goods excluding petroleum gap increased to $45.1 billion from $44.3 billion in July.
The latest trade report likely will nudge up forecasts for third quarter GDP.
Overall, the August report is favorable. Lower oil prices mean more discretionary income for consumers. Demand is moving forward with non-oil imports up.
Economic expansion appears to continue at a very moderate pace. However, the data recently have been notably volatile in some sectors. The consumer is very uncertain about the economy but jobs are up along with spending, but confidence is down. Manufacturing continues to rise while housing is stalling.
In a relatively light week of news, the highlights are on the jobs market and the Fed debate. Last week, payroll jobs topped expectations and this week's JOLTS report and jobless claims may or may not confirm further improvement in the labor market. The most recent Fed policy statement indicated that there is considerable internal debate on the timing of the next rate increase. This week's release of Fed FOMC minutes could add insight into the Fed debate.
The Labor Department's Job Openings and Labor Turnover Survey for July indicated that there were 4.673 million job openings on the last business day of the month, little changed from June's 4.675 million. The hires rate (3.5 percent) and the separations rate (3.3 percent) were unchanged in July. Within separations, the quits rate (1.8 percent) and the layoffs and discharges rate (1.2 percent) were unchanged. There were 4.872 million hires in July, compared to 4.791 million in June and the rate was 3.5 percent. There were 4.559 million total separations in July and the rate was 3.3 percent. The number of separations was little changed from June for total nonfarm, total private, and government.
JOLTS job openings Consensus Forecast for August 14: 4.710 million
Range: 4.625 million to 4.825 million
Consumer credit outstanding jumped an outsized $26.0 billion in July on top of an upward revised $18.8 billion jump in June. But it is revolving credit, the component where credit cards are tracked, that especially stood out in the report, up $5.4 billion versus a $1.8 billion gain in June. This component has been stubbornly flat throughout the recovery and further gains in future reports would mark a long-awaited upturn in consumer spirits. The non-revolving component, as usual, was very strong, up $20.6 billion in July versus a $17.0 billion gain in June. But July's gain, unlike prior gains, was centered entirely in vehicle financing, not the government's acquisition of student loans from private lenders which contracted in the month.
Consumer credit Consensus Forecast for August 14: +$20.0 billion
Range: +$15.2 billion to +$29.0 billion
The Minutes of the September 16-17 FOMC meeting are scheduled for release at 2:00 p.m. ET. While taper essentially is little of an issue, the timing of the next rise in policy rates is. The minutes may add light to when that may be.
Initial jobless claims fell 8,000 in the September 27 week to 287,000, pulling down the 4-week average by a sizable 4,250 to 294,750 which is nearly 10,000 below the month-ago comparison. Continuing claims confirm the improvement. In data that lag by a week, continuing claims for the September 20 week fell 45,000 to a new recovery low of 2.398 million with the 4-week average down 20,000 to a new recovery low of 2.441 million.
Jobless Claims Consensus Forecast for 10/4/14: 293,000
Range: 285,000 to 295,000
Wholesale inventories proved much lower than expected, with a 0.1 percent rise in July. But this was good news given a very strong 0.7 percent rise for wholesale sales that pulled down the stock-to-sales ratio one notch to a very lean 1.16 from 1.17. Low inventories point to the need for restocking while strong sales point to strong demand from the retail sector. Wholesale inventories of farm products and computer equipment fell sharply in the month as did inventories of petroleum products. On the build side were apparel and drugs as well as autos where manufacturing output has been rising to meet strong retail demand.
Wholesale inventories Consensus Forecast for August 14: +0.3 percent
Range: -0.5 to +0.7 percent
Import prices fell 0.9 percent in August but were skewed by a 4.4 percent fall in petroleum products. Excluding petroleum, import prices edged 0.1 percent lower. The year-on-year rate, which had been edging higher in recent months, is back in the negative column at minus 0.4 percent. But here again excluding petroleum, the year-on-year is in the plus column at 0.8 percent. Export prices fell 0.5 percent in the month for a year-on-year rate of plus 0.4 percent. Excluding agricultural products, prices fell 0.3 percent for a year-on-year rate of plus 0.5 percent.
Import prices Consensus Forecast for September 14: -0.8 percent
Range: -1.2 to -0.2 percent
Export prices Consensus Forecast for September 14: -0.1 percent
Range: -0.2 to +0.2 percent
The U.S. Treasury monthly budget report for August showed that 11 months into the government's fiscal year the government's fiscal debt was down a sizable 22.0 percent, at $589.2 billion versus $755.3 billion this time last year. The improvement included a 14.3 percent rise in corporate tax receipts, to $247.2 billion, and a 4.9 percent rise in individual tax receipts, to $1.23 trillion. The spending side of the ledger showed a 5.1 percent decline for defense spending, to $555.4 billion, and a 1.6 percent decline for Medicare, to $467.4 billion. Looking ahead, the month of September traditionally shows a surplus for the month. Over the past 10 years, the average surplus for the month of September has been $28.2 billion but has oscillated in and out of negative territory with a slim average surplus $1.5 billion over the past 5 years. The September 2013 surplus came in at $75.1 billion.
Treasury Statement Consensus Forecast for September 14: +$72.0 billion
Range: +$70.0 billion to +$86.0 billion
R. Mark Rogers is the author of The Complete Idiot's Guide to Economic Indicators, Penguin Books.
He can also be found on a weekly broadcast talking about the U.S. economy, the easiest way to find him is by going to iTunes and searching for "Simply Economics."
Econoday Senior Writer Mark Pender contributed to this article.
|
