|
Equities around the globe dropped sharply last week as investors worried about the prospect of a widespread economic slowdown. At the same time, U.S. monetary stimulus nears its end. Assets which depend on economic growth, such as shares and oil, have been hit by weakness in the European economy at a time when other big economies, including China, Japan and Brazil, are facing their own problems. Meanwhile, the U.S. Federal Reserve is expected later this month to wind down its asset purchase program which has boosted markets over the past two years. Many observers doubt the recent stimulus measures unveiled by the European Central Bank will make up for it.
A string of dismal data from Germany and other large Eurozone economies in recent weeks has fed anxieties about a possible recession in the region while the jury is still out on the European Central Bank's proposed policy response. The ECB's covered bond buying program, a key part of the Bank's latest package, has yet to kick in and some investors remain doubtful it will be sufficient to shore up growth and inflation in the currency bloc while the Fed reins in its own stimulus.
Adding to jitters about monetary policy expectations, St. Louis Federal Reserve Bank President James Bullard said he was concerned by a disconnect between the market's view of the Fed's rate increase path and the Fed's own view. Financial markets have constantly expected much slower tightening by the Fed than U.S. central bank policymakers' own projections.
Prospects for the global economy have darkened sufficiently for the International Monetary Fund to estimate there is now a four in 10 chance the Eurozone will slide into a third recession since the financial crisis six years ago. The IMF's weaker growth estimates in its semiannual World Economic Outlook (WEO) reflect the continued hangover from the financial crisis six years ago alongside fears that mediocre growth is the "new normal" for the world. However, the predictions should be taken with a pinch of salt as the WEO tends to be way too optimistic — as the IMF itself now admits.
The forecast for global economic growth in 2014 was cut to 3.3 percent — 0.4 percentage points below the previous forecast in April and a touch lower than the fund estimated in its July update. The WEO noted that the pattern of global recovery is becoming "more country specific" with a few nations bucking the wider gloomy trend and others hit by severe political or economic difficulties. The risks to the moderate upswing had risen with heightened geopolitical tensions threatening growth, with the Eurozone still chronically weak and with low interest rates allowing complacency in financial markets.
The U.S. economy is predicted to remain robust with conditions ripe for acceleration. A downgrade in the IMF's April forecast stemmed entirely from the snow related first quarter weakness and the fund thinks the economy can maintain about 3 percent growth in the second half of 2014 and into 2015.
In contrast to the relative strength of the U.S., recession risks in the Eurozone have risen sharply according to the IMF. With growth forecasts of only 0.8 percent in 2014 and 1.3 percent in 2015, it estimates an almost doubling in the recession risk from around 20 percent in April to nearly 40 percent at the moment. With the growth outlook weakening, the fund is increasingly concerned the Eurozone will slide into deflation, putting a 30 percent probability on that outcome.
After a spat with the UK government over its austerity policies, the IMF now reckons the country's economic growth is strong enough to consign the crisis to the past. Having warned the government repeatedly over the past few years that its austerity policies were dangerous, the fund now expects the economy to be the fastest growing large rich economy in 2014, overtaken only by the U.S. in 2015. In 2014, the forecast in the WEO is for 3.2 percent growth, slowing slightly to 2.7 percent next year. These growth rates are nevertheless faster than the UK long term average and should help eliminate slack in the economy.
|
|
2013 |
2014 |
% Change |
|
Index |
31-Dec |
Oct 3 |
Oct 10 |
Week |
2014 |
| Asia/Pacific |
|
|
|
|
|
|
| Australia |
All Ordinaries |
5353.1 |
5315.4 |
5185.7 |
-2.4% |
-3.1% |
| Japan |
Nikkei 225 |
16291.3 |
15708.7 |
15300.6 |
-2.6% |
-6.1% |
| Hong Kong |
Hang Seng |
23306.4 |
23064.6 |
23088.5 |
0.1% |
-0.9% |
| S. Korea |
Kospi |
2011.3 |
1976.2 |
1940.9 |
-1.8% |
-3.5% |
| Singapore |
STI |
3167.4 |
3253.2 |
3223.9 |
-0.9% |
1.8% |
| China |
Shanghai Composite |
2116.0 |
2363.9 |
2374.5 |
0.5% |
12.2% |
|
|
|
|
|
|
|
| India |
Sensex 30 |
21170.7 |
26568.0 |
26297.4 |
-1.0% |
24.2% |
| Indonesia |
Jakarta Composite |
4274.2 |
4949.4 |
4963.0 |
0.3% |
16.1% |
| Malaysia |
KLCI |
1867.0 |
1840.8 |
1808.9 |
-1.7% |
-3.1% |
| Philippines |
PSEi |
5889.8 |
7247.0 |
7167.35 |
-1.1% |
21.7% |
| Taiwan |
Taiex |
8611.5 |
9106.3 |
8966.4 |
-1.5% |
4.1% |
| Thailand |
SET |
1298.7 |
1570.3 |
1552.7 |
-1.1% |
19.6% |
|
|
|
|
|
|
|
| Europe |
|
|
|
|
|
|
| UK |
FTSE 100 |
6749.1 |
6527.9 |
6340.0 |
-2.9% |
-6.1% |
| France |
CAC |
4296.0 |
4281.7 |
4073.7 |
-4.9% |
-5.2% |
| Germany |
XETRA DAX |
9552.2 |
9195.7 |
8788.8 |
-4.4% |
-8.0% |
| Italy |
FTSE MIB |
18967.7 |
20200.6 |
19201.0 |
-4.9% |
1.2% |
| Spain |
IBEX 35 |
9916.7 |
10567.6 |
10150.5 |
-3.9% |
2.4% |
| Sweden |
OMX Stockholm 30 |
1333.0 |
1369.5 |
1302.3 |
-4.9% |
-2.3% |
| Switzerland |
SMI |
8203.0 |
8683.5 |
8374.6 |
-3.6% |
2.1% |
|
|
|
|
|
|
|
| North America |
|
|
|
|
|
|
| United States |
Dow |
16576.7 |
17009.7 |
16544.1 |
-2.7% |
-0.2% |
|
NASDAQ |
4176.6 |
4475.6 |
4276.2 |
-4.5% |
2.4% |
|
S&P 500 |
1848.4 |
1967.9 |
1906.1 |
-3.1% |
3.1% |
| Canada |
S&P/TSX Comp. |
13621.6 |
14789.8 |
14227.4 |
-3.8% |
4.4% |
| Mexico |
Bolsa |
42727.1 |
44678.1 |
43435.7 |
-2.8% |
1.7% |
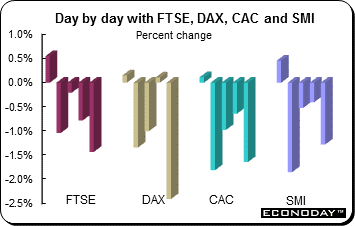 European equities posted their biggest weekly decline since May 2012 amid concern the European Central Bank will face obstacles in its measures to revive the region's economy. Stocks were down on a confluence of events — the lowering of the IMF's growth forecast for the Eurozone and a string of dismal German economic data. Geopolitical concerns weighed as did the spread of Ebola outside of Africa. For the week, the FTSE lost 2.9 percent, the SMI slid 3.6 percent and the CAC and DAX dropped 4.9 percent and 4.4 percent respectively. European equities posted their biggest weekly decline since May 2012 amid concern the European Central Bank will face obstacles in its measures to revive the region's economy. Stocks were down on a confluence of events — the lowering of the IMF's growth forecast for the Eurozone and a string of dismal German economic data. Geopolitical concerns weighed as did the spread of Ebola outside of Africa. For the week, the FTSE lost 2.9 percent, the SMI slid 3.6 percent and the CAC and DAX dropped 4.9 percent and 4.4 percent respectively.
After the all-time highs of early summer, the DAX sank to a one year low Friday as evidence mounted of a return to recession in Germany. The DAX index of 30 German blue chip companies breached the 10,000 mark in June, but on Friday dropped to 8,788 — a level not seen since October 2013. Germany is considered the engine of growth for the Eurozone economy and has been hit especially hard. Among Europe's major indexes, only Italy's FTSE MIB has fallen further than the DAX from its 2014 peak — down nearly 15 percent.
The DAX finds itself in the firing line because it is dominated by cyclical stocks — industrial firms and exporters that are particularly sensitive to growth expectations in Germany and abroad. The decline comes at the end of a week where economic data have shown declines not seen since the depths of the financial crisis in 2009. German August industrial production contracted 4 percent on the month, factory orders were down 5.7 percent, exports dropped 5.8 percent, and second quarter GDP contracted 0.2 percent. August's numbers prompted analysts to predict the German economy will need "a small miracle" in September's economic data to avoid the two quarters of decline in GDP that define a technical recession.
The FTSE also slipped to a one year low Friday and recorded its biggest weekly drop in nearly 16 months, with concerns over the outlook for global growth prompting investors to trim exposure to cyclical stocks. Continuing worries that the spread of Ebola could hurt air travel and tourism also contributed to the downward pressure on the index.
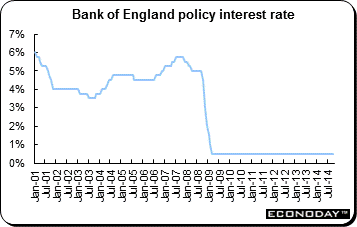 The Bank of England's monetary policy committee kept its Bank Rate at the 0.5 percent level to which it was cut way back in March 2009 while its asset purchase ceiling remained at £375 billion. Although it will not be known for another two weeks when the minutes are released, it was likely that the decision masked another split vote with the MPC's principal hawks (McCafferty and Weale) restating their call for an immediate 25 basis point increase in the Bank Rate. However, with most of the recent economic data falling into the doves' camp, the committee's other seven members probably felt all the more comfortable about opting to retain the status quo. The Bank of England's monetary policy committee kept its Bank Rate at the 0.5 percent level to which it was cut way back in March 2009 while its asset purchase ceiling remained at £375 billion. Although it will not be known for another two weeks when the minutes are released, it was likely that the decision masked another split vote with the MPC's principal hawks (McCafferty and Weale) restating their call for an immediate 25 basis point increase in the Bank Rate. However, with most of the recent economic data falling into the doves' camp, the committee's other seven members probably felt all the more comfortable about opting to retain the status quo.
The UK's construction sector is still booming but services have shown some signs of cooling and manufacturing appears to have slowed significantly from the heady expansion rates that it posted earlier in the year. Furthermore, the housing market has also offered tentative signs of having peaked. As a result, third quarter GDP growth, while almost certainly still quite robust, is likely to have fallen short of the 0.9 percent quarterly rate achieved in the April to June quarter. Moreover — and ultimately more importantly — inflationary pressures have not picked up since September's deliberations. The annual headline CPI rate actually slipped a tick to 1.5 percent in August and although the core rate edged up from 1.8 percent to 1.9 percent, annual real average earnings growth (nominal just 0.6 percent) is still firmly in negative territory.
Taken together with an uncomfortably strong exchange rate and a Eurozone economy that is struggling to keep its head above water, the likelihood of the Bank Rate still being at 0.5 percent through at least the first quarter of next year would seem as high as ever. However, if the risks of an earlier rate increase are higher, this should be reflected in November's Quarterly Inflation Report which will incorporate the Bank's updated economic forecasts.
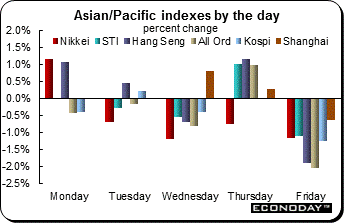 Anxieties about global growth sent most equity indexes lower last week. The declines were triggered in part by downward revisions to the IMF's forecasts for world growth. Poor manufacturing orders and industrial output data from Germany added to concerns about the economic outlook. Commodities remained under selling pressure and a standoff between Hong Kong's government and pro-democracy protesters intensified and added to the downbeat sentiment at week's end. Anxieties about global growth sent most equity indexes lower last week. The declines were triggered in part by downward revisions to the IMF's forecasts for world growth. Poor manufacturing orders and industrial output data from Germany added to concerns about the economic outlook. Commodities remained under selling pressure and a standoff between Hong Kong's government and pro-democracy protesters intensified and added to the downbeat sentiment at week's end.
Equities did move broadly higher on Thursday thanks to a momentary boost in risk sentiment after minutes of the September 16 and 17 FOMC meeting offered a dovish outlook for U.S. monetary policy. Some Fed officials expressed concerns about global economic weakness and the impact of a stronger U.S. dollar on the economy. The comments allayed concerns of an earlier than expected U.S. interest rate increase after the end of the Fed's market friendly bond buying program in October.
The Shanghai Composite returned Wednesday after the golden week holidays and managed to gain 0.5 percent on the week. The Hang Seng edged up 0.1 percent. However, the Hang Seng ended the week on a sharply negative note, tumbling 1.9 percent Friday after the government scrapped negotiations with student leaders of the pro-democracy movement on Friday, dealing a heavy blow to attempts to defuse the political crisis that saw almost two weeks of demonstrations and sit-ins shutting down parts of the city.
The Nikkei retreated four of five days (Tuesday through Friday) and was down for a third consecutive week. The index dropped 2.6 percent amid U.S. dollar weakness. Dollar weakness translated to declines of Japanese exporters. Shares in Australia declined to eight month lows, with losses across the board, as renewed fears about global growth sent investors scrambling for safe haven assets. The All Ordinaries retreated four of five days and lost 2.4 percent on the week.
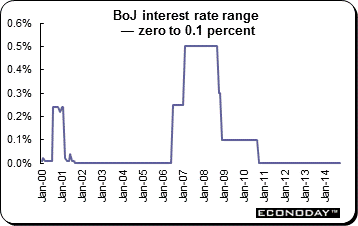 As anticipated, the Bank of Japan left its key interest rate range at zero to 0.1 percent. Financial asset purchases also remained unchanged, with the goal of increasing the monetary base at an annual pace of about ¥60 to ¥70 trillion. The BoJ maintained its inflation target at 2 percent but continues to see a shortfall. It projects the consumer price index to be about 1.25 percent for some time. As anticipated, the Bank of Japan left its key interest rate range at zero to 0.1 percent. Financial asset purchases also remained unchanged, with the goal of increasing the monetary base at an annual pace of about ¥60 to ¥70 trillion. The BoJ maintained its inflation target at 2 percent but continues to see a shortfall. It projects the consumer price index to be about 1.25 percent for some time.
The BoJ said that "Japan's economy has continued to recover moderately as a trend, although some weakness particularly on the production side has been observed due mainly to the effects of the subsequent decline in demand following the front-loaded increase prior to the consumption tax hike." It noted that overseas economies — mainly advanced economies — have been recovering, albeit with a lackluster performance still seen in part." The Bank noted that "exports have shown some weakness." The monetary policy board also said that business fixed investment had increased moderately as corporate profits improved. Public investment has more or less leveled off. It also noted that housing investment has continued to decline following the front-loaded increase.
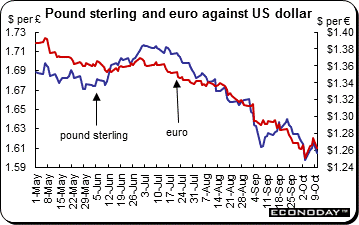 The U.S. dollar was down against its major counterparts including the yen, pound sterling, Swiss franc, and the Canadian and Australian dollars. The euro was unchanged on the week. The U.S. currency sank mid-week after the FOMC minutes were more dovish than markets expected. The minutes also indicated that FOMC members were concerned that the U.S. economy may be at risk from the worldwide slowdown. However, the currency gained the last two days of the week as traders reassessed the FOMC minutes. The U.S. dollar was down against its major counterparts including the yen, pound sterling, Swiss franc, and the Canadian and Australian dollars. The euro was unchanged on the week. The U.S. currency sank mid-week after the FOMC minutes were more dovish than markets expected. The minutes also indicated that FOMC members were concerned that the U.S. economy may be at risk from the worldwide slowdown. However, the currency gained the last two days of the week as traders reassessed the FOMC minutes.
The yen strengthened this week against the euro after European Central Bank President Mario Draghi said there were indications the region's economy is losing momentum, boosting demand for safe haven assets. Mr Draghi said on Friday that the ECB remains "unanimous in its commitment to using additional unconventional instruments within its mandate" to address "risks of too prolonged a period of low inflation." By contrast, however, German Finance Minister Wolfgang Schaeuble cautioned against U.S.-style quantitative easing and urged continued budgetary discipline.
The squabble demonstrates the lack of a common front in euro-area policy making as its economy continues to deteriorate and the IMF estimates there is as much as a 40 percent risk of a third recession since 2008. Adding to the sense of division, Bundesbank President Jens Weidmann said targeting the amount of assets owned by the ECB is a risky endeavor. Draghi has suggested the balance sheet could be boosted by as much as €1 trillion although he backpedaled on that this month. Former Bundesbank President Axel Weber also said in Washington too much was expected of the ECB, although he faulted it for allowing repayment of long-term loans which had resulted in a "de-facto tightening" of monetary policy.
|
|
2013 |
2014 |
% Change |
|
|
Dec 31 |
Oct 3 |
Oct 10 |
Week |
2014 |
| U.S. $ per currency |
|
|
|
|
|
|
| Australia |
A$ |
0.893 |
0.868 |
0.869 |
0.1% |
-2.7% |
| New Zealand |
NZ$ |
0.823 |
0.777 |
0.781 |
0.6% |
-5.0% |
| Canada |
C$ |
0.942 |
0.888 |
0.892 |
0.4% |
-5.3% |
| Eurozone |
euro (€) |
1.376 |
1.261 |
1.261 |
0.0% |
-8.3% |
| UK |
pound sterling (£) |
1.656 |
1.597 |
1.606 |
0.5% |
-3.0% |
|
|
|
|
|
|
|
| Currency per U.S. $ |
|
|
|
|
|
|
| China |
yuan |
6.054 |
6.140 |
6.131 |
0.1% |
-1.3% |
| Hong Kong |
HK$* |
7.754 |
7.759 |
7.758 |
0.0% |
0.0% |
| India |
rupee |
61.800 |
61.610 |
61.335 |
0.4% |
0.8% |
| Japan |
yen |
105.310 |
109.790 |
107.720 |
1.9% |
-2.2% |
| Malaysia |
ringgit |
3.276 |
3.258 |
3.258 |
0.0% |
0.5% |
| Singapore |
Singapore $ |
1.262 |
1.282 |
1.276 |
0.4% |
-1.1% |
| South Korea |
won |
1049.800 |
1062.110 |
1070.450 |
-0.8% |
-1.9% |
| Taiwan |
Taiwan $ |
29.807 |
30.414 |
30.407 |
0.0% |
-2.0% |
| Thailand |
baht |
32.720 |
32.642 |
32.476 |
0.5% |
0.8% |
| Switzerland |
Swiss franc |
0.892 |
0.968 |
0.959 |
1.0% |
-6.9% |
| *Pegged to U.S. dollar |
|
|
|
|
|
|
| Source: Bloomberg |
|
|
|
|
|
|
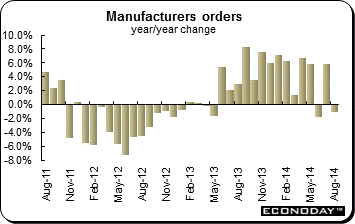 August manufacturing orders dropped a monthly 5.7 percent after surging 4.9 percent in July. The mid-quarter plunge was the worst performance since January 2009 and saw annual order growth drop from 5.9 percent to minus 1.0 percent. August's reversal was dominated by capital goods which posted an 8.5 percent monthly collapse although even this failed to offset in full a stronger revised 9.4 percent jump last time. Basics were also very weak, registering a 3.0 percent slide after a 0.3 percent dip in July but consumer & durables bucked the negative trend with a solid 3.7 percent increase. The domestic market held up rather better than the headline statistics might imply although a 2.0 percent monthly drop here, worryingly, was evenly spread across all three sub-sectors. By contrast, overseas demand sank 8.4 percent, within which orders from other Eurozone countries dropped 5.7 percent and from the rest of the world, 9.9 percent. August manufacturing orders dropped a monthly 5.7 percent after surging 4.9 percent in July. The mid-quarter plunge was the worst performance since January 2009 and saw annual order growth drop from 5.9 percent to minus 1.0 percent. August's reversal was dominated by capital goods which posted an 8.5 percent monthly collapse although even this failed to offset in full a stronger revised 9.4 percent jump last time. Basics were also very weak, registering a 3.0 percent slide after a 0.3 percent dip in July but consumer & durables bucked the negative trend with a solid 3.7 percent increase. The domestic market held up rather better than the headline statistics might imply although a 2.0 percent monthly drop here, worryingly, was evenly spread across all three sub-sectors. By contrast, overseas demand sank 8.4 percent, within which orders from other Eurozone countries dropped 5.7 percent and from the rest of the world, 9.9 percent.
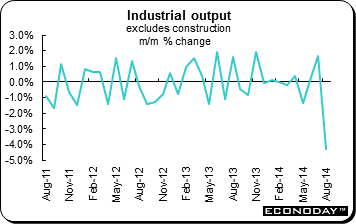 August industrial production dropped 4.0 percent for its worst performance in nearly six years. The drop was its steepest since January 2009 and followed a smaller revised 1.6 percent increase in July. On the year, output was down 3.0 percent, the sharpest yearly contraction since the end of 2009. Among major production subsectors only energy (0.3 percent) made any monthly progress. Elsewhere, capital goods dropped 8.8 percent, intermediates slid 1.9 percent, consumer goods were off (a relatively modest) 0.4 percent and construction was down 2.0 percent. August industrial production dropped 4.0 percent for its worst performance in nearly six years. The drop was its steepest since January 2009 and followed a smaller revised 1.6 percent increase in July. On the year, output was down 3.0 percent, the sharpest yearly contraction since the end of 2009. Among major production subsectors only energy (0.3 percent) made any monthly progress. Elsewhere, capital goods dropped 8.8 percent, intermediates slid 1.9 percent, consumer goods were off (a relatively modest) 0.4 percent and construction was down 2.0 percent.
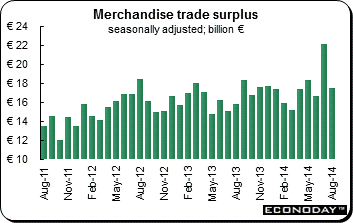 August seasonally adjusted trade surplus narrowed by €4.7 billion from July's unrevised record high of €22.2 billion to €17.5 billion. The unadjusted surplus was €14.1 billion, down from €23.5 billion last time. The decline in the adjusted headline reflected a hefty 5.8 percent monthly drop in exports, their sharpest fall since January 2009, which left them at their lowest level in five months. The slump here may have been influenced by the late start to German summer holidays. In any event, this easily offset the positive effects of a much more modest 1.3 percent dip in imports. Both sides of the balance sheet now show falls from a year ago with unadjusted exports off 1.0 percent and imports down 2.4 percent. August seasonally adjusted trade surplus narrowed by €4.7 billion from July's unrevised record high of €22.2 billion to €17.5 billion. The unadjusted surplus was €14.1 billion, down from €23.5 billion last time. The decline in the adjusted headline reflected a hefty 5.8 percent monthly drop in exports, their sharpest fall since January 2009, which left them at their lowest level in five months. The slump here may have been influenced by the late start to German summer holidays. In any event, this easily offset the positive effects of a much more modest 1.3 percent dip in imports. Both sides of the balance sheet now show falls from a year ago with unadjusted exports off 1.0 percent and imports down 2.4 percent.
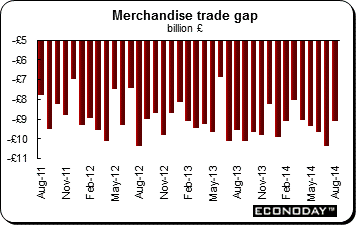
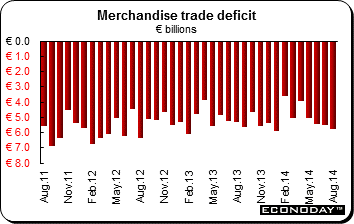 August's seasonally adjusted merchandise trade deficit widened out by €0.3 billion from July to €5.8 billion, the largest shortfall since the start of the year. What was the fourth straight increase in the red ink reflected a 1.3 percent monthly decline in exports, the effects of which were only partially mitigated by a 0.6 percent drop in imports. Exports were hit by weakness in shipments of aeronautics, chemicals, refined petroleum & wheat. The latest deterioration means that over the first eight months of 2014 the deficit stands at €40.3 billion, down less than €1 billion from the same period in 2013. August's seasonally adjusted merchandise trade deficit widened out by €0.3 billion from July to €5.8 billion, the largest shortfall since the start of the year. What was the fourth straight increase in the red ink reflected a 1.3 percent monthly decline in exports, the effects of which were only partially mitigated by a 0.6 percent drop in imports. Exports were hit by weakness in shipments of aeronautics, chemicals, refined petroleum & wheat. The latest deterioration means that over the first eight months of 2014 the deficit stands at €40.3 billion, down less than €1 billion from the same period in 2013.
 August industrial production (excluding construction) was unchanged on the month following a marginally larger revised 0.3 percent gain in July. However, annual output growth slid from 0.2 percent at the start of the quarter to minus 0.3 percent. August's monthly advance was dominated by a 2.6 percent jump in refining and a 2.2 percent bounce in energy & extracted goods. Electronics & machine equipment posted an increase of 0.8 percent. However, elsewhere the picture was a good deal weaker and there were declines in food & agriculture (0.5 percent), transport equipment (0.3 percent) and in other manufactured goods (also 0.3 percent). Overall manufacturing recorded a 0.1 percent decline from July when it fell 0.2 percent and construction was off 0.5 percent. August industrial production (excluding construction) was unchanged on the month following a marginally larger revised 0.3 percent gain in July. However, annual output growth slid from 0.2 percent at the start of the quarter to minus 0.3 percent. August's monthly advance was dominated by a 2.6 percent jump in refining and a 2.2 percent bounce in energy & extracted goods. Electronics & machine equipment posted an increase of 0.8 percent. However, elsewhere the picture was a good deal weaker and there were declines in food & agriculture (0.5 percent), transport equipment (0.3 percent) and in other manufactured goods (also 0.3 percent). Overall manufacturing recorded a 0.1 percent decline from July when it fell 0.2 percent and construction was off 0.5 percent.
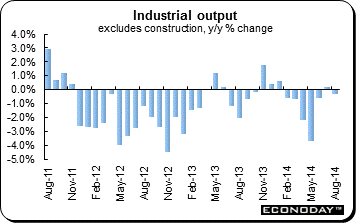
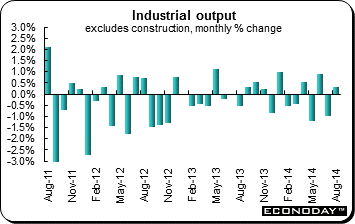 August industrial output (excluding construction) was up 0.3 percent on the month recovering less than a third of July's unrevised decline but was still strong enough to boost annual workday adjusted growth from minus 1.6 percent to minus 0.7 percent. Outside of energy (down 0.3 percent) the monthly mid-quarter pick-up in production was broad based. Consumer goods output was up 2.3 percent while capital goods and intermediates increased 1.6 percent and 0.2 percent respectively. However, over the latest three months industrial production was 0.3 percent below its level in the previous three months and average output in July/August was 0.6 percent short of its second quarter mean. August industrial output (excluding construction) was up 0.3 percent on the month recovering less than a third of July's unrevised decline but was still strong enough to boost annual workday adjusted growth from minus 1.6 percent to minus 0.7 percent. Outside of energy (down 0.3 percent) the monthly mid-quarter pick-up in production was broad based. Consumer goods output was up 2.3 percent while capital goods and intermediates increased 1.6 percent and 0.2 percent respectively. However, over the latest three months industrial production was 0.3 percent below its level in the previous three months and average output in July/August was 0.6 percent short of its second quarter mean.
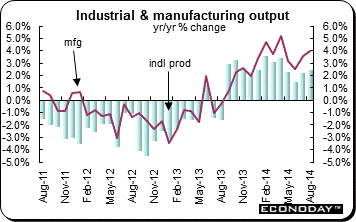 August industrial production was unchanged on the month and was up 2.5 percent on the year. Manufacturing inched up 0.1 percent and was 3.9 percent higher on the year. The monthly increase in manufacturing output was the third in a row although the smallest over the period. There were gains in eight of the 13 reporting subsectors within which the strongest advance was posted by basic metals & metal products (3.9 percent). The weakest category was transport equipment which declined 3.1 percent, mainly due to extended shutdowns in the motor vehicles, trailers & semi-trailers industry (down 6.0 percent). Elsewhere mining & quarrying recorded a 1.3 percent monthly drop and water supply, sewerage & waste management a 0.8 percent decline. However, electricity, gas, steam & air conditioning expanded 2.0 percent. August industrial production was unchanged on the month and was up 2.5 percent on the year. Manufacturing inched up 0.1 percent and was 3.9 percent higher on the year. The monthly increase in manufacturing output was the third in a row although the smallest over the period. There were gains in eight of the 13 reporting subsectors within which the strongest advance was posted by basic metals & metal products (3.9 percent). The weakest category was transport equipment which declined 3.1 percent, mainly due to extended shutdowns in the motor vehicles, trailers & semi-trailers industry (down 6.0 percent). Elsewhere mining & quarrying recorded a 1.3 percent monthly drop and water supply, sewerage & waste management a 0.8 percent decline. However, electricity, gas, steam & air conditioning expanded 2.0 percent.
 August merchandise trade deficit shrank to £9.1 billion deficit from a larger revised £10.4 billion shortfall in July. However, excluding oil and other erratic items the deficit was essentially unchanged at £8.2 billion. The (still inadequate) improvement in the headline was wholly attributable to weakness in imports which posted a 5.8 percent monthly slump and easily eclipsed a 2.8 percent decline in exports. Within these figures the main regional shift was with non-EU countries where the bilateral deficit fell by £1.2 billion to £3.6 billion. Net exports to the rest of the EU were also a little better off but at £5.5 billion, the bilateral shortfall here was only £0.2 billion below its July print. August merchandise trade deficit shrank to £9.1 billion deficit from a larger revised £10.4 billion shortfall in July. However, excluding oil and other erratic items the deficit was essentially unchanged at £8.2 billion. The (still inadequate) improvement in the headline was wholly attributable to weakness in imports which posted a 5.8 percent monthly slump and easily eclipsed a 2.8 percent decline in exports. Within these figures the main regional shift was with non-EU countries where the bilateral deficit fell by £1.2 billion to £3.6 billion. Net exports to the rest of the EU were also a little better off but at £5.5 billion, the bilateral shortfall here was only £0.2 billion below its July print.
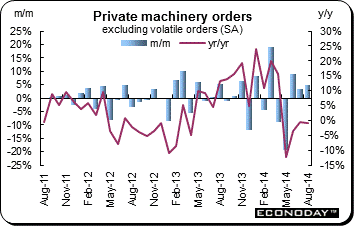 August seasonally adjusted machine orders excluding volatile items (such as ships and those from electric power companies) jumped a surprising 4.7 percent on the month and were down 1.0 percent on the year. This was the third consecutive monthly increase. Orders have been staging a mild recovery since they plunged nearly a fifth in May — their largest slide on record — after the country's national sales tax rose from 5 to 8 percent. On an unadjusted basis these orders slumped 3.3 percent. Excluding volatile items, non-manufacturing orders jumped 10.7 percent. Total orders slipped 2.2 percent on the month after sinking 13.5 percent in July with manufacturing orders dropping 10.8 percent. Overseas orders gained 29.1 percent on the month after plunging 42.6 percent the month before. August seasonally adjusted machine orders excluding volatile items (such as ships and those from electric power companies) jumped a surprising 4.7 percent on the month and were down 1.0 percent on the year. This was the third consecutive monthly increase. Orders have been staging a mild recovery since they plunged nearly a fifth in May — their largest slide on record — after the country's national sales tax rose from 5 to 8 percent. On an unadjusted basis these orders slumped 3.3 percent. Excluding volatile items, non-manufacturing orders jumped 10.7 percent. Total orders slipped 2.2 percent on the month after sinking 13.5 percent in July with manufacturing orders dropping 10.8 percent. Overseas orders gained 29.1 percent on the month after plunging 42.6 percent the month before.
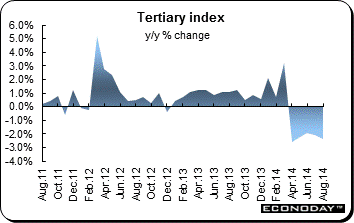 August tertiary activity index slipped 0.1 percent and was down 2.4 percent from a year ago. Expectations were for a monthly 0.1 percent increase. Among the industries that declined were scientific research, professional & technical services (down 6.2 percent), wholesale & retail trade (down 1.1 percent), electricity, gas, heat supply & water (down 3.1 percent) and accommodations, eating & drinking services (down 0.4 percent). However, industries that increased included finance & insurance (up 2.6 percent), miscellaneous services except government services (up 3.0 percent), living-related & personal services amusement services (up 2.3 percent) and information and communications (up 0.5 percent). August tertiary activity index slipped 0.1 percent and was down 2.4 percent from a year ago. Expectations were for a monthly 0.1 percent increase. Among the industries that declined were scientific research, professional & technical services (down 6.2 percent), wholesale & retail trade (down 1.1 percent), electricity, gas, heat supply & water (down 3.1 percent) and accommodations, eating & drinking services (down 0.4 percent). However, industries that increased included finance & insurance (up 2.6 percent), miscellaneous services except government services (up 3.0 percent), living-related & personal services amusement services (up 2.3 percent) and information and communications (up 0.5 percent).
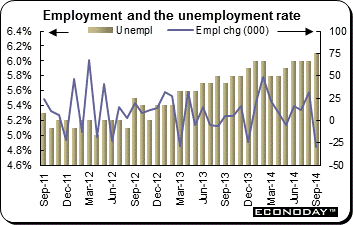 September employment dropped 29,700 after increasing a revised 32,100 in August. Full time employment increased 21,600 to 8,028,900 while part time employment declined 51,300 to 3,563,600. The unemployment rate edged up to 6.1 percent from 6.0 percent the month before. The participation rate slumped to 64.5 from 64.7 in August. Unemployment increased 11,000 to 746,600. The number of unemployed looking for full time work increased 6,600 to 525,700 and the number of unemployed only looking for part time work increased 4,400 to 220,800. The employment to population ratio, which expresses the number of employed as a percentage of the civilian population aged 15 years and over, decreased 0.2 percentage points (based on unrounded estimates) to 60.6 percent (seasonally adjusted). The ABS report included months of revisions to strip out seasonal adjustments that had proved to be unhelpful. Originally the data had shown that 121,000 jobs were created in August, a number so high that nobody took it at face value. An announcement on Thursday said the ABS would now use raw figures rather than seasonally adjusted estimates. September employment dropped 29,700 after increasing a revised 32,100 in August. Full time employment increased 21,600 to 8,028,900 while part time employment declined 51,300 to 3,563,600. The unemployment rate edged up to 6.1 percent from 6.0 percent the month before. The participation rate slumped to 64.5 from 64.7 in August. Unemployment increased 11,000 to 746,600. The number of unemployed looking for full time work increased 6,600 to 525,700 and the number of unemployed only looking for part time work increased 4,400 to 220,800. The employment to population ratio, which expresses the number of employed as a percentage of the civilian population aged 15 years and over, decreased 0.2 percentage points (based on unrounded estimates) to 60.6 percent (seasonally adjusted). The ABS report included months of revisions to strip out seasonal adjustments that had proved to be unhelpful. Originally the data had shown that 121,000 jobs were created in August, a number so high that nobody took it at face value. An announcement on Thursday said the ABS would now use raw figures rather than seasonally adjusted estimates.
 September employment jumped 74,100 after declining 11,000 in August. The increase is the steepest since May 2013. With the participation rate unchanged at 66.0 percent, the unemployment rate dropped 0.2 percentage points to 6.8 percent, its lowest mark since December 2008. The jump in employment was fashioned by a 69,300 advance in full-time jobs, only backed up by a much smaller 4,800 increase in part-time positions. Private sector headcount climbed 123,600, the steepest gain on record after its suspiciously hefty decline in mid-quarter, while the public sector added a net 6,000. A partial offset was provided by self-employment which posted a 55,600 decline. Jobs growth was dominated by the goods producing sector which saw a 60,200 bounce. Within this, manufacturing was up a relatively mild 7,100 but construction rose 29,900 and natural resources 27,700. Agriculture (down 3,200) and utilities (down 1,300) suffered minor reversals. Services added 13,800 led by accommodation & food services (47,600) and health care & social assistance (31,700). Finance, insurance, real estate & leasing (20,900) also saw decent growth but there were declines in trade (12,900) and in transportation & warehousing (8,800) alongside educational services (44,200). September employment jumped 74,100 after declining 11,000 in August. The increase is the steepest since May 2013. With the participation rate unchanged at 66.0 percent, the unemployment rate dropped 0.2 percentage points to 6.8 percent, its lowest mark since December 2008. The jump in employment was fashioned by a 69,300 advance in full-time jobs, only backed up by a much smaller 4,800 increase in part-time positions. Private sector headcount climbed 123,600, the steepest gain on record after its suspiciously hefty decline in mid-quarter, while the public sector added a net 6,000. A partial offset was provided by self-employment which posted a 55,600 decline. Jobs growth was dominated by the goods producing sector which saw a 60,200 bounce. Within this, manufacturing was up a relatively mild 7,100 but construction rose 29,900 and natural resources 27,700. Agriculture (down 3,200) and utilities (down 1,300) suffered minor reversals. Services added 13,800 led by accommodation & food services (47,600) and health care & social assistance (31,700). Finance, insurance, real estate & leasing (20,900) also saw decent growth but there were declines in trade (12,900) and in transportation & warehousing (8,800) alongside educational services (44,200).
Equities tumbled last week as fears of a global slowdown sent investors to safe havens and out of risky assets. Both the FTSE and DAX hit lows not seen for about a year. Economic data disappointed especially in Germany where the odds for a recession have increased. The minutes of the FOMC meeting indicated concerns about the strength of the U.S. dollar and weakening global growth.
In the coming week, China releases its September consumer and producer price indexes along with its merchandise trade data. Price data will get close attention in Europe and the UK as well. The UK posts September consumer and producer price indexes and its labour market report. In the Eurozone, focus will be on October's flash harmonized index of consumer prices. At 0.3 percent in September on the year, concerns about deflation continue to gain focus.
| Central Bank activities |
|
| October 15 |
United States |
Federal Reserve Beige Book |
| |
|
|
| The following indicators will be released this week... |
| Europe |
|
|
| October 14 |
Eurozone |
Industrial Production (August) |
|
Germany |
ZEW Survey (October) |
|
UK |
Consumer Price Index (September) |
|
|
Producer Price Index (September) |
| October 15 |
UK |
Labour Market Report (September) |
| October 16 |
Eurozone |
Merchandise Trade (August) |
|
|
Harmonized Index of Consumer Prices (September, final) |
| |
|
|
| Asia/Pacific |
|
|
| October 13 |
China |
Merchandise Trade (September) |
| October 14 |
Japan |
Producer Price Index (September) |
| October 15 |
China |
Consumer Price Index (September) |
|
|
Producer Price Index (September) |
| |
|
|
| Americas |
|
|
| October 16 |
Canada |
Manufacturing Sales (August) |
| October 17 |
Canada |
Consumer Price Index (September) |
Anne D Picker is the author of International Economic Indicators and Central Banks.
|
