|
It was a light week for economic news in the U.S. But there was enough negative news overseas to rattle U.S. and global equity markets.
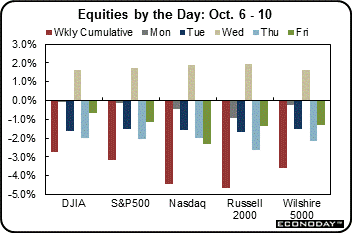 Equities began the week by dipping after the strong gains on Friday following a better-than-expected jobs report for September. Monday's retreat was largely profit taking but also some skittishness ahead of the unofficial start of earnings season with Alcoa's report out after close this past Wednesday. Equities began the week by dipping after the strong gains on Friday following a better-than-expected jobs report for September. Monday's retreat was largely profit taking but also some skittishness ahead of the unofficial start of earnings season with Alcoa's report out after close this past Wednesday.
On Tuesday, U.S. stocks followed those in Europe downward as investors became risk averse on disappointing German economic data for the manufacturing sector and a lowering of the IMF's world growth forecast. The world economy will grow an estimated 3.8 percent in 2014, compared with a July forecast for 4 percent, after a 3.3 percent expansion this year, according to the IMF.
Stocks rebounded sharply at mid-week after the release of Fed's FOMC minutes. The minutes were notably dovish, indicating that policy rates will stay near zero for quite some time. The Fed release showed that the Fed was concerned that weak growth overseas could soften growth in the U.S.
Equities plunged Thursday despite a dip in initial jobless claims to the lowest level in eight years and favorable earnings at Alcoa after close Wednesday. Worries about global growth pulled stocks down with the energy sector especially hard hit. Geopolitical concerns also weighed on investors. Market participants were watching developments in Hong Kong, where the government Thursday suspended plans to hold formal talks with pro-democracy protesters on Friday after leaders of the movement called for more demonstrations.
At week's close, global concerns continued to weigh on stocks resulting in the largest weekly decline for the S&P 500 in two years. Also, worries about chipmaker earnings pulled down the tech sector on news of soft sales in China.
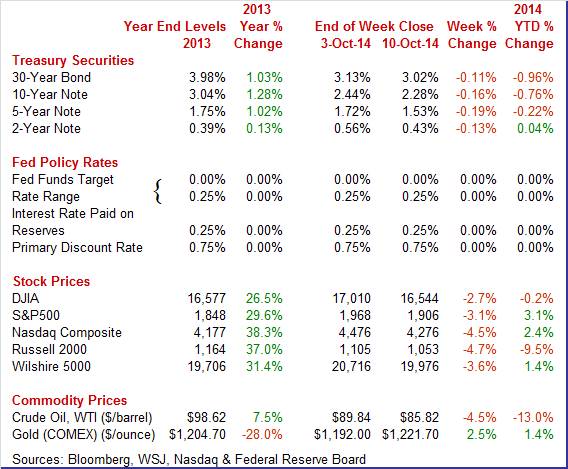
Equities were down sharply this past week. The Dow was down 2.7 percent; the S&P 500, down. 3.1 percent; the Nasdaq, down 4.5 percent; the Russell 2000, down 4.7 percent; and the Wilshire 5000, down 3.6 percent.
For the year-to-date, major indexes are mixed as follows: the Dow, down 0.2 percent; the S&P 500, up 3.1 percent; the Nasdaq, up 2.4 percent; the Russell 2000, down 9.5 percent; and the Wilshire 5000, up 1.4 percent.
Weekly percent change column reflects percent changes for all components except interest rates. Interest rate changes are reflected in simple differences.
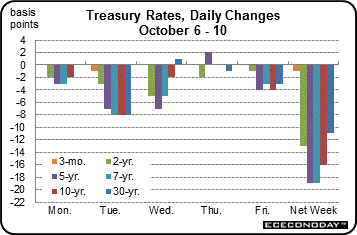 Treasury yields declined this past week on flight to safety and signs of slower global growth. On Monday, the Fed's composite measure for the labor market slowed to its slowest pace since mid-2012. Rates dropped further Tuesday on news that the International Monetary fund cut its global growth outlook and on soft data on German manufacturing. Treasury yields declined this past week on flight to safety and signs of slower global growth. On Monday, the Fed's composite measure for the labor market slowed to its slowest pace since mid-2012. Rates dropped further Tuesday on news that the International Monetary fund cut its global growth outlook and on soft data on German manufacturing.
At mid-week, yields eased further after the release of the Fed's FOMC minutes which indicated a dovish tone and that policy rate increases may be delayed. After little change Thursday, yields nudged down Friday on flight to safety as equities dropped sharply.
For this past week Treasury rates were down as follows: 3-month T-bill, down 1 basis point; the 2-year note, down 13 basis points; the 5-year note, down 19 basis points; the 7-year note, down 19 basis points; the 10-year note, down 16 basis points; and the 30-year bond, down 11 basis points.
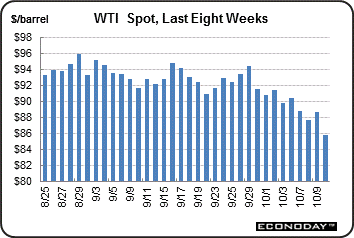 The spot price of crude fell sharply this past week. After a modest rise Monday, the spot price of West Texas Intermediate declined more than $1-1/2 per barrel Tuesday on belief by traders that the weekly government report on Wednesday would show a rise in inventories. The spot price of crude fell sharply this past week. After a modest rise Monday, the spot price of West Texas Intermediate declined more than $1-1/2 per barrel Tuesday on belief by traders that the weekly government report on Wednesday would show a rise in inventories.
At mid-week, indeed, inventories gained and WTI declined another dollar per barrel.
Spot crude rose moderately Thursday on profit taking and after a dip in initial jobless claims. But the week closed out with an almost $3 per barrel drop on concerns about global economic growth. Also on Friday, OPEC announced that it had boosted output notably in September—with the boost heavily coming from Libya.
Net for the week, the spot price for West Texas Intermediate dropped a sharp $4.02 per barrel to settle at $85.82.
The biggest economic news this past week was the continuation of a dovish tone by the Fed in the latest release of FOMC minutes.
The Fed FOMC minutes for the September 16-17 meeting were mostly dovish. However, the minutes indicated that committee members want to clarify forward guidance regarding data dependency. The transcript indicated that the FOMC was wary of raising rates too soon. Officials were worried that the markets were too focused on a fed funds rate increase happening during a specific period of time. The minutes reveal an eagerness to assure observers that a rate increase would be linked solely to positive economic data.
The minutes emphasized that the Fed will be flexible and pragmatic in its exit strategy in reducing the Fed�s balance sheet as quantitative easing likely ends this month and the Fed eventually wants to reduce excess reserves. The Fed is extensively discussing how to use reverse repos in its exit strategy. "A few" preferred an earlier end to portfolio investments. "A couple" wanted greater allowance for sales of mortgage-backed securities. Regarding the outlook for the fed funds rate, some noted that markets' outlook is below FOMC forecasts. Several participants see inflation running below the Fed's 2 percent goal for quite some time.
Overall, the Fed is expecting taper to end with the October FOMC meeting. The focus now is on exit strategy for pulling down the Fed's balance sheet. Fed talk likely will get increasingly technical. But the mood is still dovish with concern about sagging overseas economic growth and below target inflation in the U.S.
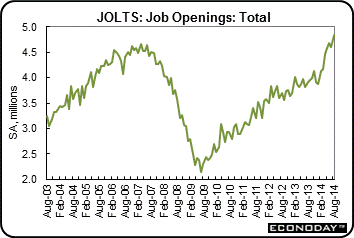 The labor market continues to slowly heal. There were 4.835 million job openings on the last business day of August, up from 4.605 million in July. The hires rate (3.3 percent) was down and the separations rate (3.2 percent) was essentially unchanged in August. Within separations, the quits rate (1.8 percent) was unchanged and the layoffs and discharges rate (1.1 percent) was little changed. The labor market continues to slowly heal. There were 4.835 million job openings on the last business day of August, up from 4.605 million in July. The hires rate (3.3 percent) was down and the separations rate (3.2 percent) was essentially unchanged in August. Within separations, the quits rate (1.8 percent) was unchanged and the layoffs and discharges rate (1.1 percent) was little changed.
 There were 4.835 million job openings on the last business day of August and the rate was 3.4 percent. There were 4.835 million job openings on the last business day of August and the rate was 3.4 percent.
This was the highest level of job openings since January 2001. The number of job openings increased for total private employers and was little changed for government employers in August. Job openings levels went up in nondurable goods manufacturing, health care and social assistance, and in accommodation and food services. Job openings fell in state and local government and were little changed in all four regions.
The number of job openings (not seasonally adjusted) increased over the 12 months ending in August 2014 for total nonfarm, total private, and government. The job openings level increased in many of the industries and in all four regions.
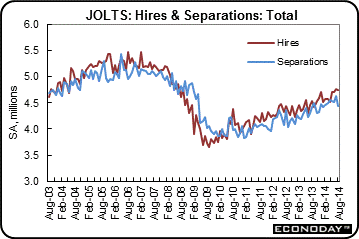
There were 4.640 million hires in August, down from 4.934 million in July and the rate was 3.3 percent. The number of hires decreased for total private and was little changed for government. Hires decreased over the month in construction and retail trade and also in the South region.
Over the 12 months ending in August, the number of hires (not seasonally adjusted) was little changed for total nonfarm, total private, government, and in all four regions. The hires level decreased over the year for educational services.
There were 4.440 million total separations in August and the rate was 3.2 percent. The number of separations was little changed from July for total nonfarm, total private, and government.
The number of quits was little changed in August at 2.473 million. The quits rate measured 1.8 percent for the seventh month in a row. The number of quits was also little changed in August for total private, government, and all four regions. The number of quits decreased in health care and social assistance
The layoffs and discharges level (not seasonally adjusted) was little changed over the 12 months ending in August for total nonfarm and total private, and was down for government.
In August, there were 387,000 other separations for total nonfarm, little changed from July. Over the month, the number of other separations was little changed for total private at 322,000 and for government at 65,000. Seasonally adjusted estimates of other separations are not available for individual industries or regions.
Over the 12 months ending in August, the number of other separations (not seasonally adjusted) was little changed for total nonfarm, total private, and government.
Over the 12 months ending in August 2014, hires totaled 56.2 million and separations totaled 53.6 million, yielding a net employment gain of 2.5 million. These figures include workers who may have been hired and separated more than once during the year.
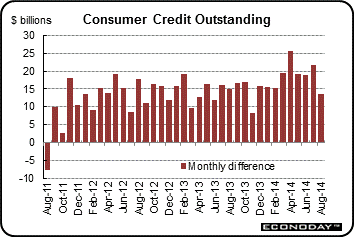 Revolving credit outstanding had been edging higher in what had been a good indication for consumer spending but not in August, slipping $0.2 billion to end five straight months of gains. Revolving credit outstanding had been edging higher in what had been a good indication for consumer spending but not in August, slipping $0.2 billion to end five straight months of gains.
Non-revolving credit outstanding, boosted by strong vehicle sales and the government's continued acquisition of student loans from private lenders, rose yet again, up $13.7 billion for the 36th straight month of increase. But the gain for the non-revolving component was the smallest since January and, combined with the slippage in revolving credit, made for a lower-than-expected total increase of $13.5 billion. This compares with Econoday expectations for $20 billion and is the lowest total increase since November. The consumer sector, the largest sector of the economy, has not been a stand-out contributor which has held back the recovery in general, and part of this drag is a reluctance among consumers to borrow. Looking ahead, a sharp drop auto sales in September suggests a weak consumer credit figure for the month.
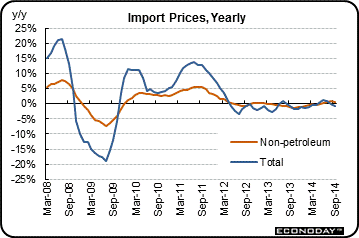
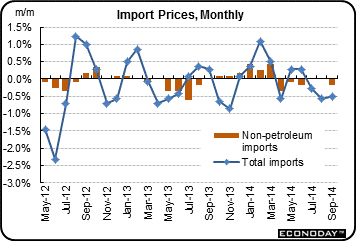 Inflation is not a big worry currently for most Fed officials—especially if you check the latest import and export prices. Inflation is not a big worry currently for most Fed officials—especially if you check the latest import and export prices.
Cross-border inflationary pressures remain dormant including import prices which fell 0.5 percent in September for the third straight decline. Year-on-year, import prices are deep into the deflationary zone at minus 0.9 percent. The drop in imported petroleum prices, down 2.0 percent in the month and down 6.6 percent year-on-year, is a key factor in the import-price decline. But even when excluding petroleum, import prices fell 0.2 percent in the month. Year-on-year, the ex-petroleum reading is in the plus column but not by much, at plus 0.7 percent.
 Export prices fell 0.2 percent for a second straight monthly decline and are also down 0.2 percent year-on-year. Here, agricultural prices are a key factor, down 0.9 percent in the month and down 2.9 percent year-on-year. When excluding agriculture, export prices also fell 0.2 percent on the month and are unchanged year-on-year. Export prices fell 0.2 percent for a second straight monthly decline and are also down 0.2 percent year-on-year. Here, agricultural prices are a key factor, down 0.9 percent in the month and down 2.9 percent year-on-year. When excluding agriculture, export prices also fell 0.2 percent on the month and are unchanged year-on-year.
Prices of finished goods, whether on the import or export side, remain extremely flat with exported capital goods showing the only increase in the month, at only plus 0.1 percent, and with exported consumer goods excluding autos showing the deepest decrease at minus 0.2 percent. Year-on-year, prices of imported consumer goods excluding autos show the greatest increase, at plus 0.9 percent, and with imported motor vehicles showing the greatest decrease at minus 0.7 percent.
Strength in the dollar is containing import-price inflation which, according to last week's FOMC minutes, has the doves at the Fed concerned that inflation will remain below the 2 percent policy target. The price of oil, where the decline accelerated sharply in September, is another negative factor for the inflationary outlook. The latest report will increase deflationary concerns.
Limited economic news points to a slowly improving labor market but also to weak inflation. The numbers likely will delay the Fed's first rate hike closer to mid- or late 2015 instead of early 2015.
This coming week, there is a notable mix in economic news. Data on the consumer sector have been somewhat volatile—especially with on and off auto incentives. Retail sales for September will be posted but look beyond the headline. September manufacturing surveys generally were positive and this week we get to see how it plays out at the national level with industrial production. Housing has shown signs of slippage in sales and prices but this week's readings for housing starts and permits will give more detail on how homebuilders see the market.
U.S. Holiday: Columbus Day. Stocks & Futures Open. Bonds Closed.
The NFIB Small Business Optimism Index indicated that job openings keep rising but not plans to further increase employment, two of the many mixed readings in August's small business optimism report where the headline index was up 0.4 points to a recovery high of 96.1. The component for current job openings rose 2 points in the month to 26, a level second only to the component for capital outlay plans which rose 4 points to 27. But plans to increase employment fell 3 points to 10. And despite the rise in capital outlay plans, those saying now is a good time to expand fell 1 point to 9. Readings on fundamental business conditions were mixed with those expecting sales to rise down 4 points to 6 while earnings trends rose 1 point but stand at a very weak level of minus 17.
NFIB Small Business Optimism Index Consensus Forecast for September 14: 95.8
Range: 95.0 to 96.5
The producer price index for final demand in August was unchanged after a 0.1 percent gain in July. Food and energy softened producer prices in August. Total final demand excluding food & energy eased to 0.1 percent in August after rising 0.2 percent the month before. Total final demand excluding food, energy, and trade services increased 0.2 percent in August, matching the July rate. The final demand services index climbed 0.3 percent in August after inching up 0.1 percent in July. Eighty percent of the August advance can be traced to a 0.3-percent rise in prices for final demand services less trade, transportation, and warehousing. The index for final demand transportation and warehousing services also increased 0.3 percent. The index for final demand goods moved down 0.3 percent in August, the largest decrease since a 0.7-percent drop in April 2013. Over 80 percent of the August decline is attributable to prices for final demand energy, which fell 1.5 percent. The index for final demand foods decreased 0.5 percent.
PPI-FD Consensus Forecast for September 14: +0.1 percent
Range: -0.2 to +0.2 percent
PPI-FD ex Food & Energy Consensus Forecast for September 14: +0.1 percent
Range: +0.1 to +0.2 percent
Retail sales jumped 0.6 percent in August after a rise of 0.3 percent the month before. The July upward revision was significant—the previous estimate was zero. Excluding autos, sales gained 0.3 percent in both August and July. Excluding both autos and gasoline sales were quite healthy, increasing 0.5 percent, following a rise of 0.3 percent in July.
Retail sales Consensus Forecast for September 14: -0.1 percent
Range: -0.5 to +0.3 percent
Retail sales excluding motor vehicles Consensus Forecast for September 14: +0.3 percent
Range: 0.0 to +0.9 percent
Less motor vehicles & gasoline Consensus Forecast for September 14: +0.5 percent
Range: +0.3 to +0.6 percent
The Empire State manufacturing index was up nearly 12 points in September to 27.54. New orders were up slightly to 16.86 versus August's 14.14. Shipments showed strength, at 27.08 versus 24.59. There was one unusual positive in the September report, a sudden surge in the 6-month outlook for prices received which is up more than 12 points to 32.61. A rise in expectations for price traction points to rising expectations for demand.
Empire State Manufacturing Survey Consensus Forecast for October 14: 20.5
Range: 12.00 to 29.20
Business inventories growth in July was steady and in line with underlining sales growth in what was a solid positive for the economic outlook. Business inventories rose 0.4 percent in July versus a 0.8 percent rise in business sales that keeps the stock-to-sales ratio unchanged at a healthy and lean 1.29.
Business inventories Consensus Forecast for August 14: +0.4 percent
Range: +0.1 to +0.6 percent
The Beige Book being prepared for the October 28-29 FOMC meeting likely will focus on inflation and the labor market. Inflation has been running below the Fed target of 2 percent while the labor market has been mixed. Job growth is still sub-par while earnings growth is sluggish.
Initial jobless claims edged 1,000 lower to a lower-than-expected 287,000 in the October 4th week while the 4-week average fell a very sharp 7,250 in the week to 287,750. From a month ago, the average was down 7,500 which is a comparison that offers an early hint of strength for the October employment report. The average was also at a new recovery low, its lowest level since February 2006. Continuing claims, which are reported with a 1-week lag, tell the same story. Continuing claims in the September 27 week fell 21,000 to 2.381 million for a new recovery low while the 4-week average fell 28,000 to a new recovery low of 2.414 million.
Jobless Claims Consensus Forecast for 10/11/14: 290,000
Range: 280,000 to 295,000
Industrial production slipped 0.1 percent in August after a gain of 0.2 percent the month before. Analysts expected a 0.3 percent boost for the month. The decline may be deceiving, tied to auto assemblies and retooling schedules. Manufacturing production fell 0.4 percent after a 0.7 percent increase in July. Weakness was led by motor vehicles which dropped a monthly 7.6 percent. In contrast, motor vehicle sales have been healthy, indicating that this was just a retooling timing issue. Manufacturing excluding motor vehicles rose 0.1 percent after a matching rise in July. Auto assemblies (autos and light trucks) fell to an annualized pace of 11.36 million units from 12.91 million in July. For other industries, mining rebounded 0.5 percent after slipping 0.3 percent in July. Utilities made a partial comeback of 1.0 percent, following a drop of 2.7 percent the month before. Capacity utilization eased to 78.8 percent from 79.1 percent in July.
Industrial production Consensus Forecast for September 14: +0.4 percent
Range: +0.3 to +0.5 percent
Manufacturing production component Consensus Forecast for September 14: +0.4 percent
Range: +0.2 to +0.5 percent
Capacity utilization Consensus Forecast for September 14: 79.0 percent
Range: 78.9 to 79.1 percent
The general business conditions index of the Philadelphia Fed's Business Outlook Survey for September dipped from an outsized 28.0 in August to a still very strong 22.5 was not supported by details of the report which actually showed greater strength than August. Shipments were accelerating further, to 21.6 from August's 16.5, as were new orders, at 15.5 versus 14.7, and especially employment at 21.2 versus 9.1 in what was an unusually strong gain.
Philadelphia Fed survey Consensus Forecast for October 14: 20.0
Range: 12.0 to 29.8
The NAHB housing market index for September was boosted by rising traffic, posting at 59 this month vs August's already strong 50-plus reading of 55. The traffic component, which has been lagging badly, was up 5 points to a near-50 reading of 47 (readings above 50 indicate monthly growth). The present sales component was also up 5 points, to 63 in what points specifically to September gains for new home sales. The future sales component was at 67 for a 2 point gain.
NAHB housing market index Consensus Forecast for October14: 59
Range: 56 to 61
Housing starts for August fell 14.4 percent, following a boost of 22.9 percent the month before. August's pace of 0.956 million units was up 8.0 percent on a year-ago basis. The multifamily component declined a monthly 31.7 after jumping 44.9 percent in July. The single-family component edged down 2.4 percent, following an 11.1 percent surge in July. Building permits were oscillating, too. Permits decreased 5.6 percent in August, following an 8.6 percent boost in July. Monthly swings have largely been in the multifamily component. The single-family component has been in a modest downturn in recent months.
Housing starts Consensus Forecast for September 14: 1.010 million-unit rate
Range: 0.955 million to 1.120 million-unit rate
Housing permits Consensus Forecast for September 14: 1.027 million-unit rate
Range: 0.990 million to 1.150 million-unit rate
The Reuter's/University of Michigan's consumer sentiment index finished September at 84.6 versus 84.6 at mid-month and up from 82.5 from final August. The gain from August was centered in the expectations component which came in at 75.4 for final September, up 4.1 points from August which points to confidence in the outlooks for jobs and for income. The current conditions component, however, fell back slightly, down 0.9 points from August to 98.9 in a dip that does not point to strength for current consumer activity nor strength in the September jobs market. Inflation wasn't a factor behind the dip in current conditions as 1-year expectations fell 2 tenths from August to 3.0 percent with 5-year expectations down 1 tenth to 2.8 percent in declines that reflect the price contraction underway at the gas pump.
Consumer sentiment Consensus Forecast for preliminary October 14: 84.4
Range: 82.0 to 85.5
R. Mark Rogers is the author of The Complete Idiot's Guide to Economic Indicators, Penguin Books.
He can also be found on a weekly broadcast talking about the U.S. economy, the easiest way to find him is by going to iTunes and searching for "Simply Economics."
Econoday Senior Writer Mark Pender contributed to this article.
|
