|
As the week began, investors were focused on the Federal Reserve monetary policy meeting announcement scheduled for Wednesday. For Thursday, it was the Reserve Bank of New Zealand which, as expected, made no change in policy. Friday's Bank of Japan meeting also was expected to make little news. However, the BoJ shocked markets by increasing its quantitative and qualitative easing program. The move sent equities soaring and the yen plunging as investors absorbed the news. The move followed disappointing Japanese economic data for September. Household spending continued to drop and consumer prices continued to ease.
All equity indexes followed here advanced on the week but were mixed for October.
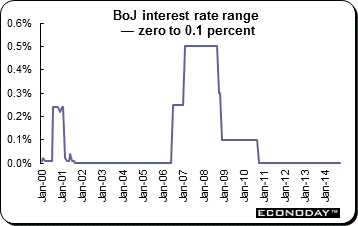 As anticipated, the Bank of Japan left its key interest rate range at zero to 0.1 percent. However, the BoJ surprised markets — it chose to ease its overall stance by announcing its intention to expand the monetary base at an annual rate of about ¥80 trillion, up from ¥60 trillion to ¥70 trillion previously. To this end, the BoJ will step up its annual rate of JGB purchases to about ¥80 trillion from around ¥50 trillion currently and in doing so extend the average remaining maturity to 7 years to 10 years from the current 7 years. As anticipated, the Bank of Japan left its key interest rate range at zero to 0.1 percent. However, the BoJ surprised markets — it chose to ease its overall stance by announcing its intention to expand the monetary base at an annual rate of about ¥80 trillion, up from ¥60 trillion to ¥70 trillion previously. To this end, the BoJ will step up its annual rate of JGB purchases to about ¥80 trillion from around ¥50 trillion currently and in doing so extend the average remaining maturity to 7 years to 10 years from the current 7 years.
The increase in purchases should see the BoJ's JGB holdings climb to about ¥200 trillion at the end of 2014 from ¥143 trillion at the end of 2013. The move, which came as a welcome surprise to financial markets but at the expense of the local currency, was approved by a tight 5 to 4 vote and reflects concerns that recent price developments could jeopardize the monetary authority's 2 percent inflation target.
According to the BoJ statement, the economy "has continued to recover moderately as a trend and is expected to continue growing at a pace above its potential. However, on the price front, somewhat weak developments in demand following the consumption tax hike and a substantial decline in crude oil prices have been exerting downward pressure recently." It noted that a "temporary weakness in demand has already started to wane, and the decline in crude oil prices will have positive effects on economic activity from a somewhat longer-term perspective and will push up prices. Nevertheless, if the current downward pressure on prices remains, albeit in the short term, there is a risk that conversion of deflationary mindset, which has so far been progressing steadily, might be delayed. To pre-empt manifestation of such risk and to maintain the improving momentum of expectation formation, the Bank judged it appropriate to expand the quantitative and qualitative monetary easing (QQE)."
BOJ Governor Haruhiko Kuroda portrayed the board's tightly split decision to buy more assets as a preemptive strike to keep policy on track, rather than an admission that his plan to reflate the long moribund-economy had derailed. But some economists wondered if pushing even more money into the financial system would be effective as long as consumer confidence continues to worsen and demand remains weak.
In a semiannual report, the BoJ halved its growth forecast for the fiscal year to March 2015 to 0.5 percent. It trimmed its CPI forecast for fiscal 2014 and 2015, but still expects to meet its inflation target within the two years it originally set out.
|
|
2013 |
2014 |
% Change |
|
Index |
31-Dec |
Oct 24 |
Oct 31 |
Week |
October |
2014 |
| Asia/Pacific |
|
|
|
|
|
|
|
| Australia |
All Ordinaries |
5353.1 |
5399.3 |
5505.0 |
2.0% |
3.9% |
2.8% |
| Japan |
Nikkei 225 |
16291.3 |
15291.6 |
16413.8 |
7.3% |
1.5% |
0.8% |
| Hong Kong |
Hang Seng |
23306.4 |
23302.2 |
23998.1 |
3.0% |
4.6% |
3.0% |
| S. Korea |
Kospi |
2011.3 |
1925.7 |
1964.4 |
2.0% |
-2.8% |
-2.3% |
| Singapore |
STI |
3167.4 |
3222.6 |
3274.3 |
1.6% |
-0.1% |
3.4% |
| China |
Shanghai Composite |
2116.0 |
2302.3 |
2420.2 |
5.1% |
2.4% |
14.4% |
|
|
|
|
|
|
|
|
| India |
Sensex 30 |
21170.7 |
26851.1 |
27865.8 |
3.8% |
4.6% |
31.6% |
| Indonesia |
Jakarta Composite |
4274.2 |
5073.1 |
5089.6 |
0.3% |
-0.9% |
19.1% |
| Malaysia |
KLCI |
1867.0 |
1818.9 |
1855.2 |
2.0% |
0.5% |
-0.6% |
| Philippines |
PSEi |
5889.8 |
7103.6 |
7215.73 |
1.6% |
-0.9% |
22.5% |
| Taiwan |
Taiex |
8611.5 |
8646.0 |
8974.8 |
3.8% |
0.1% |
4.2% |
| Thailand |
SET |
1298.7 |
1539.9 |
1584.2 |
2.9% |
-0.1% |
22.0% |
|
|
|
|
|
|
|
|
| Europe |
|
|
|
|
|
|
|
| UK |
FTSE 100 |
6749.1 |
6388.7 |
6546.5 |
2.5% |
-1.2% |
-3.0% |
| France |
CAC |
4296.0 |
4128.9 |
4233.1 |
2.5% |
-4.1% |
-1.5% |
| Germany |
XETRA DAX |
9552.2 |
8987.8 |
9326.9 |
3.8% |
-1.6% |
-2.4% |
| Italy |
FTSE MIB |
18967.7 |
19495.7 |
19784.0 |
1.5% |
-5.3% |
4.3% |
| Spain |
IBEX 35 |
9916.7 |
10339.3 |
10477.8 |
1.3% |
-3.2% |
5.7% |
| Sweden |
OMX Stockholm 30 |
1333.0 |
1358.6 |
1412.8 |
4.0% |
0.7% |
6.0% |
| Switzerland |
SMI |
8203.0 |
8532.1 |
8837.8 |
3.6% |
0.0% |
7.7% |
|
|
|
|
|
|
|
|
| North America |
|
|
|
|
|
|
|
| United States |
Dow |
16576.7 |
16805.4 |
17390.5 |
3.5% |
2.0% |
4.9% |
|
NASDAQ |
4176.6 |
4483.7 |
4630.7 |
3.3% |
3.1% |
10.9% |
|
S&P 500 |
1848.4 |
1964.6 |
2018.1 |
2.7% |
2.3% |
9.2% |
| Canada |
S&P/TSX Comp. |
13621.6 |
14543.8 |
14613.3 |
0.5% |
-2.3% |
7.3% |
| Mexico |
Bolsa |
42727.1 |
43665.5 |
45027.5 |
3.1% |
0.1% |
5.4% |
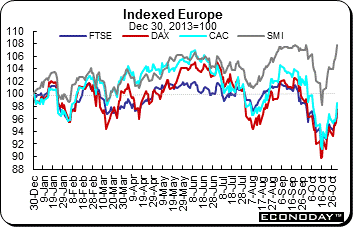 Equities rallied last week after a hesitant start. However it was not enough to reverse losses from earlier in the month. The FTSE and CAC were up 2.5 percent on the week while the DAX added 3.8 percent and the SMI, 3.6 percent. However, for the month, the FTSE retreated 1.2 percent, the CAC declined 4.1 percent and the DAX lost 1.6 percent. The SMI, however was unchanged on the month. Equities rallied last week after a hesitant start. However it was not enough to reverse losses from earlier in the month. The FTSE and CAC were up 2.5 percent on the week while the DAX added 3.8 percent and the SMI, 3.6 percent. However, for the month, the FTSE retreated 1.2 percent, the CAC declined 4.1 percent and the DAX lost 1.6 percent. The SMI, however was unchanged on the month.
The major equity indexes surged Friday as unexpected monetary stimulus measures in Japan boosted appetite for stocks around the world. The Bank of Japan said it would accelerate purchases of Japanese government bonds as part of a massive stimulus package to boost growth and inflation. Traders said the Japanese move, coupled with expectations British, U.S. and European interest rates will remain at record lows, would continue to drive investors over to equities for the better returns on offer from the stock market. Friday's gains occurred despite declines in German and French retail sales.
The European Central Bank released the results of its banking stress tests Sunday. Failures were concentrated among Italian banks, with nine failures, and Greek and Cypriot banks, with three apiece. Markets had initially cheered the results of the so-called stress tests, after regulators said Sunday that all but 13 of the continent's leading banks have sufficient capital to weather another economic storm. But the rally fizzled fast. Investors highlighted lingering doubts whether the results of the stress test will spur a pickup in lending in the Eurozone. Some also questioned whether much confidence could be drawn from the results, given the European Central Bank's likely reluctance to spook markets with a spate of high profile failures.
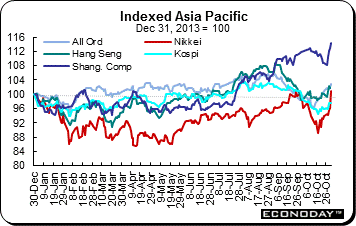 Equities rallied last week thanks in part to central bank actions taken by the Federal Reserve mid-week and the Bank of Japan on Friday. Gains ranged from 0.3 percent (Jakarta Composite) to 7.3 percent (Nikkei). Other indexes posting healthy gains were the Hang Seng (3.0 percent), Shanghai Composite (5.1 percent) and the Sensex (3.8 percent). Friday's advances after the Bank of Japan announced additional monetary stimulus measures added to optimism over the U.S. economy. However, monthly changes were mixed with the Kospi (down 2.8 percent), the STI (down 0.1 percent), both the Jakarta Composite and PSEi (down 0.9 percent) and the SET (down 0.1 percent) retreating in October. On the plus side, the All Ordinaries (up 3.9 percent), Hang Seng and Sensex (up 4.6 percent) and the Shanghai Composite (up 2.4 percent) led advances. Equities rallied last week thanks in part to central bank actions taken by the Federal Reserve mid-week and the Bank of Japan on Friday. Gains ranged from 0.3 percent (Jakarta Composite) to 7.3 percent (Nikkei). Other indexes posting healthy gains were the Hang Seng (3.0 percent), Shanghai Composite (5.1 percent) and the Sensex (3.8 percent). Friday's advances after the Bank of Japan announced additional monetary stimulus measures added to optimism over the U.S. economy. However, monthly changes were mixed with the Kospi (down 2.8 percent), the STI (down 0.1 percent), both the Jakarta Composite and PSEi (down 0.9 percent) and the SET (down 0.1 percent) retreating in October. On the plus side, the All Ordinaries (up 3.9 percent), Hang Seng and Sensex (up 4.6 percent) and the Shanghai Composite (up 2.4 percent) led advances.
The Bank of Japan's surprise move combined with news that Japan's mammoth public pension fund is prepared to move billions of dollars into stocks sent Japanese shares soaring, creating a rub-off effect on other markets across the region. Investors also cheered positive earnings and U.S. economic reports pointing toward a sustained economic recovery. Dour economic news no doubt helped the BoJ take decisive action. Japan's annual core consumer inflation slowed for a second straight month raising skepticism over the Bank of Japan's ability to achieve its 2 percent price goal. Consumer prices rose 3 percent from a year earlier, down from 3.1 percent in August. Average household spending sank 5.6 percent on the year while the unemployment rate rose to 3.6 from 3.5 percent in August.
BoJ Governor Haruhiko Kuroda said the BoJ's easing was unrelated to major portfolio changes by the Government Pension Investment Fund (GPIF) also announced on Friday, but the effect of the day's two major decisions means that the central bank will step up its buying of Japanese government bonds offsetting the giant pension fund's increased sales of them.
The Hong Kong Exchanges & Clearing Ltd — the biggest bourse operator by market value —said Sunday that a stock trading connection with Shanghai still had not received regulatory approval. The scheme, originally expected to be launched before the end of October, grants international investors access to China's domestic stock market while at the same time allowing investors in China to buy stocks in Hong Kong. It marks a major opening up of China's stock exchange where foreign money managers require a special license to buy stocks.
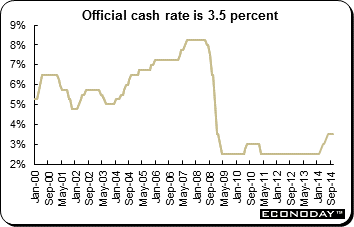 As expected, the Reserve Bank of New Zealand kept its key overnight cash rate (OCR) at 3.5 percent where it has been since July 2014. In his statement, Reserve Bank Governor Graeme Wheeler noted once again that the New Zealand dollar value "remains unjustified and unsustainable and continues to constrain growth in the tradables sector." However, he did say that lower commodity prices and increased financial market volatility have taken some pressure off of the currency. The RBNZ expects further significant depreciation. The RBNZ is the only industrialized country to increase interest rates this year. As expected, the Reserve Bank of New Zealand kept its key overnight cash rate (OCR) at 3.5 percent where it has been since July 2014. In his statement, Reserve Bank Governor Graeme Wheeler noted once again that the New Zealand dollar value "remains unjustified and unsustainable and continues to constrain growth in the tradables sector." However, he did say that lower commodity prices and increased financial market volatility have taken some pressure off of the currency. The RBNZ expects further significant depreciation. The RBNZ is the only industrialized country to increase interest rates this year.
CPI inflation was 1.0 percent on the year in September. Among the factors that contributed to benign inflation are subdued wage inflation, well-anchored inflation expectations, weak global inflation, declines in oil prices and the high New Zealand dollar. The RBNZ has an inflation target range of 1 percent to 3 percent.
The statement acknowledged that growth in the New Zealand economy has been faster than trend over 2014 and has reduced unemployment and added to demands on productive capacity. Strong construction sector activity, high net immigration and interest rates — which remain low by historic standards — continue to support the expansion.
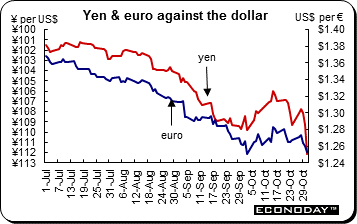 The U.S. dollar was up against the euro, yen, pound sterling, Swiss franc and the Canadian dollar but unchanged against the Australian dollar last week. The dollar's autumn rally had fizzled out in October, but the end of U.S. quantitative easing and a surprisingly non-dovish Federal Reserve statement this week has powered the dollar higher. A big contributing factor was the Japanese yen's tumble after the Bank of Japan expanded its quantitative easing program Friday. The U.S. dollar was up against the euro, yen, pound sterling, Swiss franc and the Canadian dollar but unchanged against the Australian dollar last week. The dollar's autumn rally had fizzled out in October, but the end of U.S. quantitative easing and a surprisingly non-dovish Federal Reserve statement this week has powered the dollar higher. A big contributing factor was the Japanese yen's tumble after the Bank of Japan expanded its quantitative easing program Friday.
Many analysts and investors have long argued that the U.S. currency is the world's most undervalued major currency. They maintain it is set to embark on a long period of appreciation as the U.S. economy continues to recover from the financial crisis and the Fed starts actually raising rates in the coming years. The European Central Bank also is expected to be forced to begin its own quantitative easing program eventually which would weigh on the euro.
The yen tumbled to its lowest level in nearly seven years against the dollar Friday, putting it on track for its biggest losses in 18 months after the Bank of Japan unexpectedly eased policy again. While some in the market had expected some easing, most had thought any additional action was months away as Governor Haruhiko Kuroda had voiced optimism over the Japanese economic outlook even after soft data. As a result, the dollar surged to its highest level since January 2008. Analysts said the move by the BoJ is likely to put more pressure on the European Central Bank to ease policy as well. Both central banks want to boost inflation — and cheapening their currencies by flooding markets through massive asset purchases is one of the ways to encourage growth and bolster prices.
|
|
2013 |
2014 |
% Change |
|
|
Dec 31 |
Oct 24 |
Oct 31 |
Week |
2014 |
| U.S. $ per currency |
|
|
|
|
|
|
| Australia |
A$ |
0.893 |
0.880 |
0.880 |
0.0% |
-1.4% |
| New Zealand |
NZ$ |
0.823 |
0.785 |
0.780 |
-0.7% |
-5.2% |
| Canada |
C$ |
0.942 |
0.890 |
0.888 |
-0.3% |
-5.7% |
| Eurozone |
euro (€) |
1.376 |
1.267 |
1.253 |
-1.1% |
-8.9% |
| UK |
pound sterling (£) |
1.656 |
1.609 |
1.600 |
-0.5% |
-3.4% |
|
|
|
|
|
|
|
| Currency per U.S. $ |
|
|
|
|
|
|
| China |
yuan |
6.054 |
6.117 |
6.113 |
0.1% |
-1.0% |
| Hong Kong |
HK$* |
7.754 |
7.758 |
7.755 |
0.0% |
0.0% |
| India |
rupee |
61.800 |
61.281 |
61.365 |
-0.1% |
0.7% |
| Japan |
yen |
105.310 |
108.110 |
112.300 |
-3.7% |
-6.2% |
| Malaysia |
ringgit |
3.276 |
3.278 |
3.290 |
-0.3% |
-0.4% |
| Singapore |
Singapore $ |
1.262 |
1.275 |
1.285 |
-0.7% |
-1.8% |
| South Korea |
won |
1049.800 |
1057.500 |
1068.820 |
-1.1% |
-1.8% |
| Taiwan |
Taiwan $ |
29.807 |
30.404 |
30.454 |
-0.2% |
-2.1% |
| Thailand |
baht |
32.720 |
32.410 |
32.610 |
-0.6% |
0.3% |
| Switzerland |
Swiss franc |
0.892 |
0.952 |
0.962 |
-1.1% |
-7.3% |
| *Pegged to U.S. dollar |
|
|
|
|
|
|
| Source: Bloomberg |
|
|
|
|
|
|
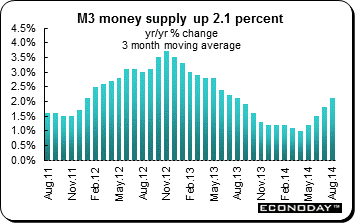 September M3 money supply accelerated to 2.5 percent on the year, up 0.4 percentage points from a marginally stronger revised August rate and at its highest mark since May 2013. The pick-up was enough to lift the ECB's preferred 3-month moving average measure to a 2.1 percent rate, a 0.3 percentage point increase from last time. The headline improvement in large part reflected a shallower pace of decline in lending to the private sector which, at a minus 1.2 percent yearly rate, was up from minus 1.5 percent in August. However, within this, loans to households posted a minus 0.5 percent rate, just a tick better off than in mid-quarter and, disappointingly, borrowing for house purchase was 0.1 percentage points softer at minus 0.1 percent. Lending to non-financial corporations increased only modestly from minus 2.2 percent to minus 2.0 percent. Rather, much of the overall advance was attributable to the volatile non-monetary financial intermediaries sector (excluding life assurance and pension funds) where borrowing posted a 2.7 percent annual decline after a 4.0 percent fall in August. September M3 money supply accelerated to 2.5 percent on the year, up 0.4 percentage points from a marginally stronger revised August rate and at its highest mark since May 2013. The pick-up was enough to lift the ECB's preferred 3-month moving average measure to a 2.1 percent rate, a 0.3 percentage point increase from last time. The headline improvement in large part reflected a shallower pace of decline in lending to the private sector which, at a minus 1.2 percent yearly rate, was up from minus 1.5 percent in August. However, within this, loans to households posted a minus 0.5 percent rate, just a tick better off than in mid-quarter and, disappointingly, borrowing for house purchase was 0.1 percentage points softer at minus 0.1 percent. Lending to non-financial corporations increased only modestly from minus 2.2 percent to minus 2.0 percent. Rather, much of the overall advance was attributable to the volatile non-monetary financial intermediaries sector (excluding life assurance and pension funds) where borrowing posted a 2.7 percent annual decline after a 4.0 percent fall in August.
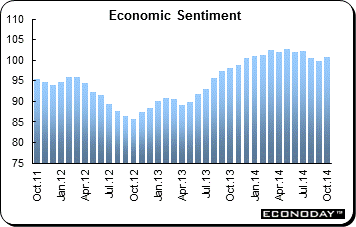 October EU Commission's measure of economic sentiment (ESI) climbed to 100.7 after a reading of 99.9 in September. October's limited gain was broad-based with all of the major economic sectors registering a slight pick-up in optimism. Confidence in industry climbed 0.4 points to minus 5.1 while the consumer category, at minus 11.1, advanced 0.3 points to confirm its flash print. Retail increased 0.9 points to minus 6.4, services added 1.2 points to 4.4 while construction was up a more solid 3.1 points at minus 24.6, easily its highest level so far this year. Regionally there was better news for most, but not all, of the larger economies. Thus, the national ESI increased 1.1 points to 96.4 in France and 0.6 points to 104.4 in Germany. Italy also edged 0.5 points higher to 97.4 but Spain saw a 0.7 point dip to 103.3. Significantly, both France and Spain remain below the common 100 long-run average. October EU Commission's measure of economic sentiment (ESI) climbed to 100.7 after a reading of 99.9 in September. October's limited gain was broad-based with all of the major economic sectors registering a slight pick-up in optimism. Confidence in industry climbed 0.4 points to minus 5.1 while the consumer category, at minus 11.1, advanced 0.3 points to confirm its flash print. Retail increased 0.9 points to minus 6.4, services added 1.2 points to 4.4 while construction was up a more solid 3.1 points at minus 24.6, easily its highest level so far this year. Regionally there was better news for most, but not all, of the larger economies. Thus, the national ESI increased 1.1 points to 96.4 in France and 0.6 points to 104.4 in Germany. Italy also edged 0.5 points higher to 97.4 but Spain saw a 0.7 point dip to 103.3. Significantly, both France and Spain remain below the common 100 long-run average.
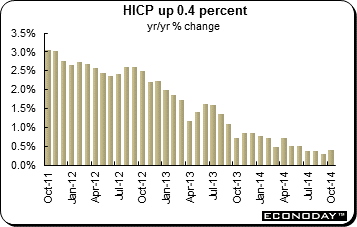 October flash harmonized index of consumer prices was up 0.4 percent on the year, up for the first time since April. However, the pick-up in the headline was not matched in the core. Excluding energy, food, alcohol and tobacco prices were 0.7 percent higher on the year, down a tick from September and the lowest mark since May. Omitting just energy and unprocessed food, the rate held steady at 0.8 percent. Inflation in the non-energy industrial goods sector moved back into negative territory with a minus 0.1 percent reading that was 0.3 percentage points short of its September reading and its weakest posting since June. Elsewhere, food, alcohol and tobacco prices rose a yearly 0.5 percent from 0.3 percent last time while energy charges were down 1.8 percent after a 2.3 percent decline at the end of last quarter. Inflation in services edged just 0.1 percentage points firmer to 1.2 percent. October flash harmonized index of consumer prices was up 0.4 percent on the year, up for the first time since April. However, the pick-up in the headline was not matched in the core. Excluding energy, food, alcohol and tobacco prices were 0.7 percent higher on the year, down a tick from September and the lowest mark since May. Omitting just energy and unprocessed food, the rate held steady at 0.8 percent. Inflation in the non-energy industrial goods sector moved back into negative territory with a minus 0.1 percent reading that was 0.3 percentage points short of its September reading and its weakest posting since June. Elsewhere, food, alcohol and tobacco prices rose a yearly 0.5 percent from 0.3 percent last time while energy charges were down 1.8 percent after a 2.3 percent decline at the end of last quarter. Inflation in services edged just 0.1 percentage points firmer to 1.2 percent.
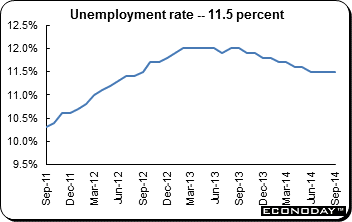 September joblessness was down 19,000 on the month to leave the unemployment rate unchanged at 11.5 percent for a fourth month. Among the larger member states according to Eurostat methodology, national rates held steady in France (10.5 percent) and Germany (5.0 percent) but declined 0.2 percentage points in Spain (24.0 percent). By contrast, the Italian rate was up 0.1 percentage points at a record equaling 12.6 percent. Top of the jobless ladder was again Greece (26.4 percent in July) while at the bottom was Germany which slipped below Austria (5.1 percent) where the rate climbed 0.2 percentage points. There was good news on youth unemployment where the rate fell from 24.0 percent in September 2013 to 23.3 percent last month although current levels clearly remain unacceptably high and politically dangerous for a number of EMU governments. September joblessness was down 19,000 on the month to leave the unemployment rate unchanged at 11.5 percent for a fourth month. Among the larger member states according to Eurostat methodology, national rates held steady in France (10.5 percent) and Germany (5.0 percent) but declined 0.2 percentage points in Spain (24.0 percent). By contrast, the Italian rate was up 0.1 percentage points at a record equaling 12.6 percent. Top of the jobless ladder was again Greece (26.4 percent in July) while at the bottom was Germany which slipped below Austria (5.1 percent) where the rate climbed 0.2 percentage points. There was good news on youth unemployment where the rate fell from 24.0 percent in September 2013 to 23.3 percent last month although current levels clearly remain unacceptably high and politically dangerous for a number of EMU governments.
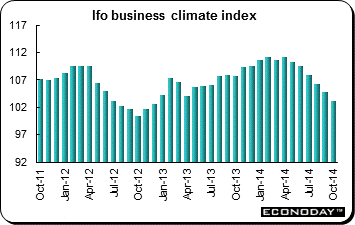 October Ifo was down for a sixth consecutive month to a reading of 103.2 for overall sentiment. It was at its lowest level since March 2010. Both its current and expectations components declined. Current conditions was down for a fourth time in as many months, on this occasion losing 2.0 points to stand at 108.4, their worst reading since April last year. Expectations were off just 1 point at 98.3 but have failed to increase since April and have not posted a lower mark since December 2012. Moreover, outside of wholesale, all of the major output sectors saw some deterioration in morale. The declines in manufacturing and retail were particularly sharp. October Ifo was down for a sixth consecutive month to a reading of 103.2 for overall sentiment. It was at its lowest level since March 2010. Both its current and expectations components declined. Current conditions was down for a fourth time in as many months, on this occasion losing 2.0 points to stand at 108.4, their worst reading since April last year. Expectations were off just 1 point at 98.3 but have failed to increase since April and have not posted a lower mark since December 2012. Moreover, outside of wholesale, all of the major output sectors saw some deterioration in morale. The declines in manufacturing and retail were particularly sharp.
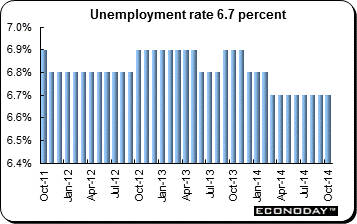 October seasonally adjusted unemployment dropped 22,000 on the month. The decrease was the first since July and, while not large enough to reduce a jobless rate that has been steady at 6.7 percent for eight months now, was still the steepest since April. There was also some better news on September where the previously stated 12,000 increase in the number of people out of work was shaved to a 9,000 gain. Seasonally adjusted vacancies were up 8,000 following a 6,000 increase in September. The lagging ILO data showed employment rising 19,000 on the month, up from a very modest 5,000 increase in August but still well short of the average 35,000 advance seen in the second quarter. October seasonally adjusted unemployment dropped 22,000 on the month. The decrease was the first since July and, while not large enough to reduce a jobless rate that has been steady at 6.7 percent for eight months now, was still the steepest since April. There was also some better news on September where the previously stated 12,000 increase in the number of people out of work was shaved to a 9,000 gain. Seasonally adjusted vacancies were up 8,000 following a 6,000 increase in September. The lagging ILO data showed employment rising 19,000 on the month, up from a very modest 5,000 increase in August but still well short of the average 35,000 advance seen in the second quarter.
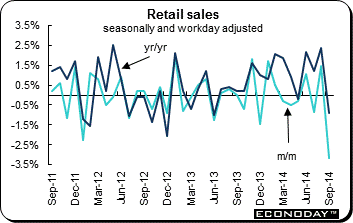 September retail sales dropped 3.2 percent on the month. It more than reversed a significantly smaller revised 1.5 percent increase in August. Unadjusted annual growth still accelerated from minus 0.3 percent to 2.9 percent but this was biased up by a larger number of shopping days this year. September's swoon left seasonally adjusted sales in the third quarter 0.4 percent below their second quarter level and so warns of a likely limited contribution from total household spending to real GDP growth over the period. Recent retail purchases have been particularly volatile (and subject to sizeable revision) but with five of the last seven months all seeing a contraction in demand, the underlying trend has been disappointingly soft. September retail sales dropped 3.2 percent on the month. It more than reversed a significantly smaller revised 1.5 percent increase in August. Unadjusted annual growth still accelerated from minus 0.3 percent to 2.9 percent but this was biased up by a larger number of shopping days this year. September's swoon left seasonally adjusted sales in the third quarter 0.4 percent below their second quarter level and so warns of a likely limited contribution from total household spending to real GDP growth over the period. Recent retail purchases have been particularly volatile (and subject to sizeable revision) but with five of the last seven months all seeing a contraction in demand, the underlying trend has been disappointingly soft.
 September household spending on manufactured goods were down 0.7 percent, their third decline since April. As a result, the yearly increase was 0.7 percent. Textiles contracted a hefty 7.2 percent on the month. The other products category also saw a 0.3 percent drop and the headline would have looked worse but for a 0.9 percent gain in autos. Weakness in manufactured goods was mirrored in overall goods spending which recorded a slightly sharper 0.8 percent monthly contraction after a 0.9 percent gain last time. However, a solid handover from the previous period and the strong August was enough to see third quarter total goods spending edge 0.2 percent higher from the second quarter. September household spending on manufactured goods were down 0.7 percent, their third decline since April. As a result, the yearly increase was 0.7 percent. Textiles contracted a hefty 7.2 percent on the month. The other products category also saw a 0.3 percent drop and the headline would have looked worse but for a 0.9 percent gain in autos. Weakness in manufactured goods was mirrored in overall goods spending which recorded a slightly sharper 0.8 percent monthly contraction after a 0.9 percent gain last time. However, a solid handover from the previous period and the strong August was enough to see third quarter total goods spending edge 0.2 percent higher from the second quarter.
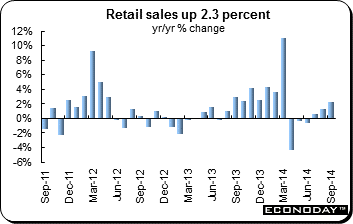 September retail sales surprised with a gain of 2.3 percent from a year ago. Expectations were for a 0.6 percent increase. This was the third consecutive month that retail sales have risen after sinking three months in the immediate aftermath of the sales tax increase. September's increase was the biggest since March, when the annual increase was 11 percent as shoppers got big purchases in ahead of an increase in the national sales tax that was implemented the following month. All subcategories were up in September with the exception of machinery & equipment which dropped for the sixth consecutive month, this time by 3.2 percent. Motor vehicles advanced 0.8 percent for the first increase after five negative months. General merchandise sales were also up 0.8 percent after increasing 1.7 percent in August. Fabrics, apparel and accessories were up 9.7 percent on the year while drugs & toiletries added 3.7 percent. Fuel was up 0.6 percent from a year ago. September retail sales surprised with a gain of 2.3 percent from a year ago. Expectations were for a 0.6 percent increase. This was the third consecutive month that retail sales have risen after sinking three months in the immediate aftermath of the sales tax increase. September's increase was the biggest since March, when the annual increase was 11 percent as shoppers got big purchases in ahead of an increase in the national sales tax that was implemented the following month. All subcategories were up in September with the exception of machinery & equipment which dropped for the sixth consecutive month, this time by 3.2 percent. Motor vehicles advanced 0.8 percent for the first increase after five negative months. General merchandise sales were also up 0.8 percent after increasing 1.7 percent in August. Fabrics, apparel and accessories were up 9.7 percent on the year while drugs & toiletries added 3.7 percent. Fuel was up 0.6 percent from a year ago.
 September seasonally adjusted industrial production jumped a greater than expected 2.7 percent from the previous month after sliding 1.9 percent in August. Since the beginning of the year the monthly changes have alternated between positive and negative. On the year, output was down 0.8 percent after declining a revised 2.0 percent the month before. Electronic parts & devices were up 5.8 percent on the month while electrical machinery added 5.4 percent. Transportation was up 4.7 percent. According to METI's production forecast, output is expected to slip 0.1 percent in October and increase 1.0 percent in November. The industries that are expected to decline in October are electronic parts & devices, transport equipment and information & communication electronics equipment. Industries that are expected to increase output include electronic parts & devices and chemicals. September seasonally adjusted industrial production jumped a greater than expected 2.7 percent from the previous month after sliding 1.9 percent in August. Since the beginning of the year the monthly changes have alternated between positive and negative. On the year, output was down 0.8 percent after declining a revised 2.0 percent the month before. Electronic parts & devices were up 5.8 percent on the month while electrical machinery added 5.4 percent. Transportation was up 4.7 percent. According to METI's production forecast, output is expected to slip 0.1 percent in October and increase 1.0 percent in November. The industries that are expected to decline in October are electronic parts & devices, transport equipment and information & communication electronics equipment. Industries that are expected to increase output include electronic parts & devices and chemicals.
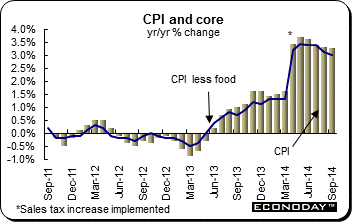 Consumer inflation continued to ease in September, pointing to continued problems for the Bank of Japan in their efforts to raise inflation to its 2 percent target. The data are skewed by the sales tax increase in April. September consumer price index excluding fresh food was unchanged on the month and up 3.0 percent from a year ago. The 3.0 percent increase was the 16th straight annual gain but it was the lowest since 1.3 percent in March just before the sales tax increase took effect on April first. Excluding the effects of the tax increase, core was up 1.0 percent, down from 1.1 percent the month before. Excluding food and energy, the index was unchanged on the month and up 2.3 percent on the year, unchanged from August. The all items index was up 0.2 percent and 3.2 percent from a year ago. Prices were higher for accommodations, gasoline, casualty insurance premiums, air conditioners/heaters and winter clothing on the year. October CPI which is seen as a forerunner of the national index slipped 0.1 percent on the month and was up 2.5 percent from a year ago pointing to weakness ahead. Consumer inflation continued to ease in September, pointing to continued problems for the Bank of Japan in their efforts to raise inflation to its 2 percent target. The data are skewed by the sales tax increase in April. September consumer price index excluding fresh food was unchanged on the month and up 3.0 percent from a year ago. The 3.0 percent increase was the 16th straight annual gain but it was the lowest since 1.3 percent in March just before the sales tax increase took effect on April first. Excluding the effects of the tax increase, core was up 1.0 percent, down from 1.1 percent the month before. Excluding food and energy, the index was unchanged on the month and up 2.3 percent on the year, unchanged from August. The all items index was up 0.2 percent and 3.2 percent from a year ago. Prices were higher for accommodations, gasoline, casualty insurance premiums, air conditioners/heaters and winter clothing on the year. October CPI which is seen as a forerunner of the national index slipped 0.1 percent on the month and was up 2.5 percent from a year ago pointing to weakness ahead.
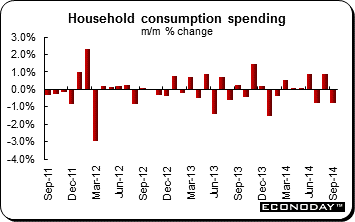
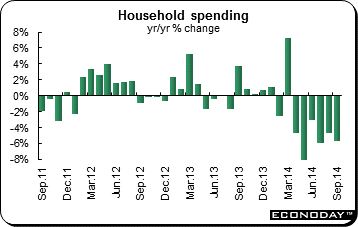 September household spending dropped 5.6 percent from a year ago, far more than anticipated. It had been expected to fall 3.9 percent. Spending had declined 4.7 percent in August. Spending has declined every month since April when the country implemented its first sales tax increase in almost two decades. The 7.2 percent increase in March – an all-time high - came as people front-loaded spending. September household spending dropped 5.6 percent from a year ago, far more than anticipated. It had been expected to fall 3.9 percent. Spending had declined 4.7 percent in August. Spending has declined every month since April when the country implemented its first sales tax increase in almost two decades. The 7.2 percent increase in March – an all-time high - came as people front-loaded spending.
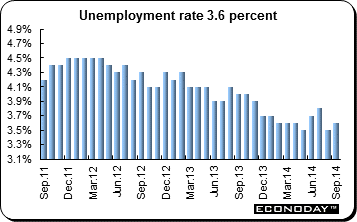 September unemployment edged up to 3.6 percent from 3.5 percent in August. Employment posted its 21 straight annual increase, adding 430,000 jobs after increasing 530,000 in August. The number of unemployment was 2.33 million, down 250,000 from the previous year. The labour force participation rate was up 0.2 percent to 59.9 percent. The employment rate jumped 0.5 percent to 57.8 percent. September unemployment edged up to 3.6 percent from 3.5 percent in August. Employment posted its 21 straight annual increase, adding 430,000 jobs after increasing 530,000 in August. The number of unemployment was 2.33 million, down 250,000 from the previous year. The labour force participation rate was up 0.2 percent to 59.9 percent. The employment rate jumped 0.5 percent to 57.8 percent.
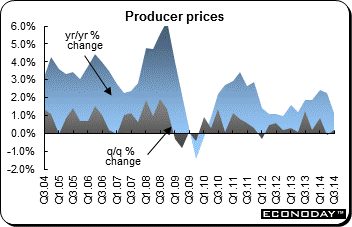 September quarter producer prices were up 0.2 percent and 1.2 percent on the year. The increase was mainly due to higher prices received for building construction (up 1.0 percent). The increase was partly offset by declines in the prices received for electricity supply, gas supply, and water supply, sewerage & drainage services (down 3.6 percent) and petroleum refining & petroleum fuel manufacturing (down 5.4 percent). Intermediate prices slipped 0.1 percent on the quarter and were up 0.9 percent on the year. The decline was mainly due to declines in the prices received for electricity supply, gas supply and water supply, sewerage & drainage services (down 4.6 percent), oil & gas extraction (down 4.5 percent) and petroleum refining & petroleum fuel manufacturing (down 4.4 percent). The declines were partly offset by increases in the prices received for legal & accounting services (up 1.9 percent) and employment services (up 1.9 percent). Preliminary demand prices were down 0.4 percent on the quarter and up 0.6 percent on the year. September quarter producer prices were up 0.2 percent and 1.2 percent on the year. The increase was mainly due to higher prices received for building construction (up 1.0 percent). The increase was partly offset by declines in the prices received for electricity supply, gas supply, and water supply, sewerage & drainage services (down 3.6 percent) and petroleum refining & petroleum fuel manufacturing (down 5.4 percent). Intermediate prices slipped 0.1 percent on the quarter and were up 0.9 percent on the year. The decline was mainly due to declines in the prices received for electricity supply, gas supply and water supply, sewerage & drainage services (down 4.6 percent), oil & gas extraction (down 4.5 percent) and petroleum refining & petroleum fuel manufacturing (down 4.4 percent). The declines were partly offset by increases in the prices received for legal & accounting services (up 1.9 percent) and employment services (up 1.9 percent). Preliminary demand prices were down 0.4 percent on the quarter and up 0.6 percent on the year.
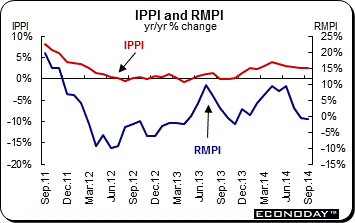 September industrial product price index dropped 0.4 percent on the month following a marginally stronger revised 0.3 percent increase in August. Annual growth of the IPPI was little changed at 2.5 percent. At the same time raw material costs declined 1.8 percent from August when they dropped an unrevised 2.2 percent and were 0.9 percent lower than in September 2013 after a 0.6 percent contraction last time. Within the IPPI basket the main downside pressure on headline prices came from energy & petroleum products which posted a 1.7 percent monthly drop. There were also sizeable declines in primary non-ferrous metal products (1.9 percent) and in miscellaneous products (0.8 percent). Excluding energy & petroleum the IPPI would have fallen just 0.1 percent from August and increased 2.3 percent on the year. Partial offsets were provided by higher prices for motorized & recreational vehicles (0.6 percent), fabricated metal products & construction materials (0.4 percent) and plastic & rubber products (also 0.4 percent). The exchange rate had only a minor positive impact and without this the IPPI would have declined a marginally steeper 0.5 percent on the month. The third consecutive monthly drop in the RMPI was led by a 1.9 percent slide in the cost of crude energy products. However, there were also declines in animals & animal products (3.4 percent), crop products (2.3 percent) and forestry products (1.0 percent). Elsewhere, prices were typically flat. Excluding crude energy the RMPI would have fallen 1.7 percent on the month and increased 4.6 percent on the year. September industrial product price index dropped 0.4 percent on the month following a marginally stronger revised 0.3 percent increase in August. Annual growth of the IPPI was little changed at 2.5 percent. At the same time raw material costs declined 1.8 percent from August when they dropped an unrevised 2.2 percent and were 0.9 percent lower than in September 2013 after a 0.6 percent contraction last time. Within the IPPI basket the main downside pressure on headline prices came from energy & petroleum products which posted a 1.7 percent monthly drop. There were also sizeable declines in primary non-ferrous metal products (1.9 percent) and in miscellaneous products (0.8 percent). Excluding energy & petroleum the IPPI would have fallen just 0.1 percent from August and increased 2.3 percent on the year. Partial offsets were provided by higher prices for motorized & recreational vehicles (0.6 percent), fabricated metal products & construction materials (0.4 percent) and plastic & rubber products (also 0.4 percent). The exchange rate had only a minor positive impact and without this the IPPI would have declined a marginally steeper 0.5 percent on the month. The third consecutive monthly drop in the RMPI was led by a 1.9 percent slide in the cost of crude energy products. However, there were also declines in animals & animal products (3.4 percent), crop products (2.3 percent) and forestry products (1.0 percent). Elsewhere, prices were typically flat. Excluding crude energy the RMPI would have fallen 1.7 percent on the month and increased 4.6 percent on the year.
The Federal Reserve ended its bond buying programs as expected while the Bank of Japan surprised and increased its bond buying programs. The Reserve Bank of New Zealand left its monetary policy unchanged. U.S. third quarter gross domestic product increased at a better than expected annualized pace of 3.5 percent. However, consumer spending slumped in France and Germany.
With the Federal Reserve ending its quantitative easing program and the Bank of Japan massively expanding its own asset buying, the minds of analysts are naturally focusing on what the European Central Bank can or cannot do next at its meeting this week. The Bank of England also holds a monetary policy meeting this week as does the Reserve Bank of Australia.
| Central Bank activities |
|
| November 4 |
Australia |
Reserve Bank of Australia Monetary Policy Meeting |
| November 6 |
Eurozone |
European Central Bank Monetary Policy Meeting |
|
UK |
Bank of England Monetary Policy Meeting |
| |
|
|
| The following indicators will be released this week... |
| Europe |
|
|
| November 3 |
Eurozone |
Manufacturing PMI (October) |
|
Germany |
Manufacturing PMI (October) |
|
France |
Manufacturing PMI (October) |
|
Italy |
Manufacturing PMI (October) |
|
UK |
Manufacturing PMI (October) |
| November 4 |
Eurozone |
Producer Price Index (September) |
| November 5 |
Eurozone |
Services & Composite PMI (October) |
|
Germany |
Services & Composite PMI (October) |
|
France |
Services & Composite PMI (October) |
|
Italy |
Services & Composite PMI (October) |
|
UK |
Services PMI (October) |
| November 6 |
Germany |
Manufacturing Orders (September) |
|
UK |
Industrial Production (September) |
| November 7 |
Germany |
Merchandise Trade (September) |
|
|
Industrial Production (September) |
|
France |
Merchandise Trade (September) |
|
|
Industrial Production (September) |
|
UK |
Merchandise Trade (September) |
| |
|
|
| Asia/Pacific |
|
|
| November 3 |
China |
Manufacturing PMI (October) |
|
India |
Manufacturing PMI (October) |
| November 4 |
Australia |
Retail Sales (September) |
|
|
Merchandise Trade (September) |
| November 6 |
Australia |
Labour Force Survey (September) |
| |
|
|
| Americas |
|
|
| November 4 |
Canada |
International Trade (September) |
| November 7 |
Canada |
Labour Force Survey (October) |
Anne D Picker is the author of International Economic Indicators and Central Banks.
|
