|
The week was quite positive for equities. Several factors came into play, including favorable earnings, positive economic news, and surprise monetary policy from overseas. Yes, the planets aligned this past week.
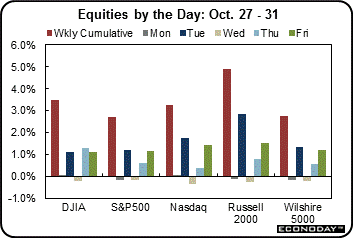 Equities advanced sharply this past week. However, the week got off to a slow start. Stocks were little changed as investors paused after the prior week's impressive gains. Traders said much of the day's action surrounded energy shares, which posted big declines on lower oil prices. Equities advanced sharply this past week. However, the week got off to a slow start. Stocks were little changed as investors paused after the prior week's impressive gains. Traders said much of the day's action surrounded energy shares, which posted big declines on lower oil prices.
Tuesday, stocks advanced notably despite mixed economic data. Better-than-expected October consumer confidence more than offset a surprise decline in durable goods orders. Also leading stocks up were healthy corporate earnings with positive news from Amgen (earnings) and T-Mobile (news on possible spinoff).
 Equities were down only marginally Wednesday after the Fed's policy statement which was much as expected with an announcement that quantitative easing ended in October as planned. The Fed dropped its characterization of labor market slack as "significant" in a show of confidence in the economy's prospects. In its statement, the FOMC largely dismissed recent financial market volatility, dimming growth in Europe and a weak inflation outlook as unlikely to undercut progress toward its unemployment and inflation goals for the U.S. On the corporate side, Facebook fell notably after forecasting slower revenue growth. Equities were down only marginally Wednesday after the Fed's policy statement which was much as expected with an announcement that quantitative easing ended in October as planned. The Fed dropped its characterization of labor market slack as "significant" in a show of confidence in the economy's prospects. In its statement, the FOMC largely dismissed recent financial market volatility, dimming growth in Europe and a weak inflation outlook as unlikely to undercut progress toward its unemployment and inflation goals for the U.S. On the corporate side, Facebook fell notably after forecasting slower revenue growth.
Thursday, stocks rallied boosted by better-than-anticipated third quarter gross domestic product growth and upbeat earnings reports. Third quarter gross domestic product was up at an annualized pace of 3.5 percent, beating expectations. Also, initial jobless claims nudged up but remained low. Financials were up strongly, including Visa and MasterCard. Equities got a sizeable boost Friday after an unexpected boost in stimulus from the Bank of Japan. Consumer sentiment rose and topped expectations—apparently on an improving jobs market and lower gasoline prices. Earnings also were healthy.
 Equities were up notably this past week. The Dow was up 3.5 percent; the S&P 500, up 2.7 percent; the Nasdaq, up 3.3 percent; the Russell 2000, up 4.9 percent; and the Wilshire 5000, up 2.7 percent. Equities were up notably this past week. The Dow was up 3.5 percent; the S&P 500, up 2.7 percent; the Nasdaq, up 3.3 percent; the Russell 2000, up 4.9 percent; and the Wilshire 5000, up 2.7 percent.
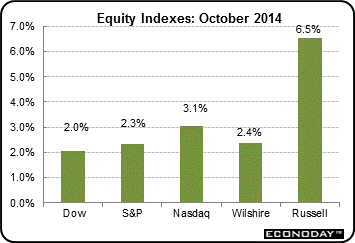
Equities were up for October. The Dow was up 2.0 percent; the S&P 500, up 2.3 percent; the Nasdaq, up 3.1 percent; the Russell 2000, up 6.5 percent; and the Wilshire 5000, up 2.4 percent.
For the year-to-date, major indexes are up as follows: the Dow, up 4.9 percent; the S&P 500, up 9.2 percent; the Nasdaq, up 10.9 percent; the Russell 2000, up 0.8 percent; and the Wilshire 5000, up 7.9 percent.
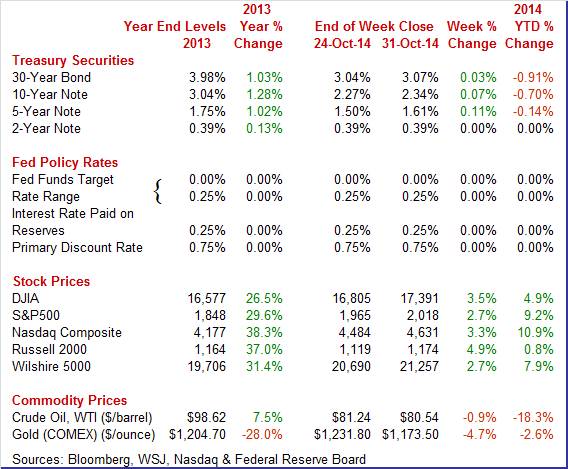
Weekly percent change column reflects percent changes for all components except interest rates. Interest rate changes are reflected in simple differences.
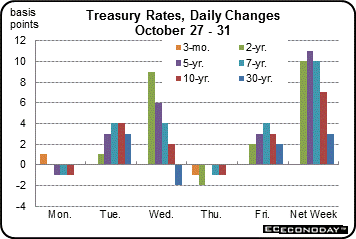 Treasury rates rose moderately this past week on a variety of factors. The week started off slowly on Monday with little change as the Fed made its last scheduled bond purchases under its quantitative easing programs. Yields firmed Tuesday on a boost in consumer confidence. Treasury rates rose moderately this past week on a variety of factors. The week started off slowly on Monday with little change as the Fed made its last scheduled bond purchases under its quantitative easing programs. Yields firmed Tuesday on a boost in consumer confidence.
At mid-week, yields gained after the Fed's policy statement noted improvement in the labor market.
After little change Thursday, yields firmed Friday on news of further stimulus measures by the Bank of Japan.
For this past week Treasury rates were up as follows: the 2-year note, up 10 basis points; the 5-year note, up 11 basis points; the 7-year note, up 10 basis points; the 10-year note, up 7 basis points; and the 30-year bond, up 3 basis points. The 3-month bill was unchanged for the week.
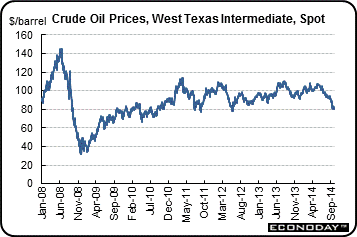 The spot price of oil fell for the fourth week in a row and continued on a downtrend going back to June of this year. But this past week was down only marginally. The spot price of oil fell for the fourth week in a row and continued on a downtrend going back to June of this year. But this past week was down only marginally.
The big daily moves were Tuesday and Thursday. The gain in consumer confidence lifted oil prices Tuesday by somewhat under a dollar per barrel. Thursday, spot West Texas Intermediate declined a dollar a barrel on the Fed ending quantitative easing and on a jump in U.S. crude production.
Net for the week, the spot price for West Texas Intermediate eased 70 cents per barrel to settle at $80.54.
The Fed was the key focus this past week and kept its planned end to quantitative easing. Meanwhile, economic news was mostly positive.
The Federal Reserve FOMC announced as expected that it ended its bond purchase programs. It also dropped its characterization of labor market slack as "significant" in a show of confidence in the economy's prospects. In its statement, the FOMC largely dismissed recent financial market volatility, dimming growth in Europe and a weak inflation outlook as unlikely to undercut progress toward its unemployment and inflation goals. The fed funds rate range remained at zero to 0.25 percent where it has been since December 2008. The FOMC said that it would likely remain near zero for a "considerable time" following the end of the bond purchases this month. The timing and pace of interest rate increases would be data dependent.
Still, the Fed remains dovish with inflation remaining below the Fed's 2 percent target at 1.4 percent headline PCE inflation. Policy rates are likely to remain low for quite some time. New information on Fed views on policy rate changes will come with quarterly Fed forecasts out with the December statement. Currently, market focus is on policy moves in Europe and Japan as well as in the U.S. Both the ECB and Bank of Japan continue to go in the opposite direction from the Fed—leaning toward further possible easing.
Minneapolis Fed President Narayana Kocherlakota was the only FOMC member who dissented saying that the committee should make a bolder commitment to meet its 2 percent inflation target given a lack of price pressures. The Fed acknowledged lower energy prices and other forces were holding inflation down, but repeated its view that the likelihood of inflation undershooting its target had diminished since earlier this year.
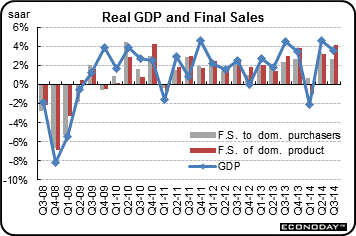 The initial estimate for third quarter GDP growth topped expectations even as it decelerated from the second quarter. The initial estimate for third quarter GDP growth topped expectations even as it decelerated from the second quarter.
Third quarter GDP growth decelerated after a second quarter jump related to make up activity after the first quarter decline due to atypically adverse winter weather. The advance estimate for the third quarter posted at a moderately healthy 3.5 percent annualized, following 4.6 percent boost in the second quarter. The median forecast was for 3.0 percent.
Final sales of domestic product increased a healthy 4.2 percent after gaining 3.2 percent in the second quarter. Final sales to domestic purchasers rose 2.7 percent in the third quarter, compared to 3.4 percent in the second quarter.
The increase in real GDP in the third quarter primarily reflected positive contributions from personal consumption expenditures (PCE), exports, nonresidential fixed investment, federal government spending, and state and local government spending that were partly offset by a negative contribution from private inventory investment. Imports, which are a subtraction in the calculation of GDP, decreased.
GDP data are still being affected by the atypically severe winter weather in the first quarter as the third quarter returns to normal conditions after a second quarter recovery. The notable negative for the third quarter was a drop in inventory investment and a slowdown in consumer spending growth. Both were strong in the second quarter. The deceleration in the percent change in real GDP reflected a downturn in private inventory investment and decelerations in PCE, in nonresidential fixed investment, in exports, in state and local government spending, and in residential fixed investment that were partly offset by a downturn in imports and an upturn in federal government spending.
On the price front, the chain-weighted price index decelerated to 1.3 percent annualized from 2.1 percent in the second quarter. Analysts projected 1.4 percent. The core chain index, excluding food and energy, eased to 1.6 percent from 1.8 percent in the second quarter.
Overall, economic growth is somewhat better than expected. This is good news for company profits as reflected in recently better-than-expected earnings on average. But the third quarter GDP figure will raise debate within the Fed on moving forward or not the first increase in the fed funds rate.
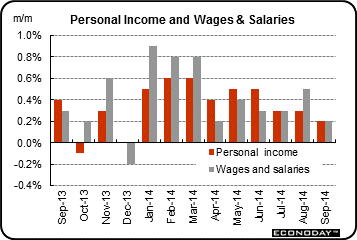 Personal income remains moderately positive while spending is volatile. Inflation is still low and below Fed target. Personal income remains moderately positive while spending is volatile. Inflation is still low and below Fed target.
Personal income continues a modest uptrend but spending slipped on volatile auto sales and lower gasoline prices. Personal income advanced 0.2 percent in September, following a 0.3 percent gain in August. The wages & salaries component increased 0.2 percent, following a 0.5 percent boost the prior month. Averaging the wage gains leaves consumer basic income moderately healthy.
Analysts botched their forecast for spending for September—and for no apparent reason. Personal spending declined 0.2 percent after jumping 0.5 percent in August. The latest figure came in below market expectations for a 0.1 percent rise. Weakness was in the durables component which fell 2.0 percent after a 2.1 percent jump in August, reflecting swings in auto sales. Lower gasoline prices pulled down on nondurables. Nondurables spending declined 0.3 percent after falling 0.4 percent in August. Services rose 0.2 percent, following a 0.5 percent spike in August.
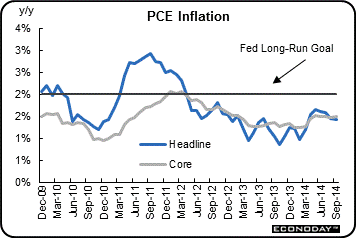 PCE inflation remains soft. The September figure posted at a 0.1 percent increase and followed a dip of 0.1 percent in August. Core PCE inflation rose 0.1 percent in September, following a gain of 0.1 percent in August and equaling expectations. PCE inflation remains soft. The September figure posted at a 0.1 percent increase and followed a dip of 0.1 percent in August. Core PCE inflation rose 0.1 percent in September, following a gain of 0.1 percent in August and equaling expectations.
On a year-ago basis, headline PCE inflation held steady at 1.4 percent in September. Year-ago core inflation was 1.5 percent in both September and August. The Fed doves will not be in a rush to boost policy rates early next year.
The latest report shows continued moderate growth in income. Spending has been volatile on a monthly basis and the September numbers should not have been a surprise.
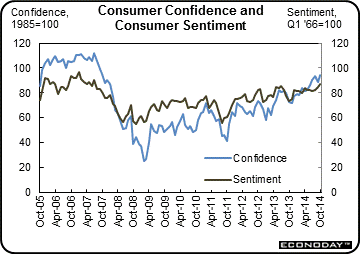 The consumer is feeling more confident about the economy as two key measures are up in October. The consumer is feeling more confident about the economy as two key measures are up in October.
According to the Conference Board's measure, consumer confidence is at a new recovery high of 94.5 for October, up from an upwardly revised 89.0 in September and surpassing the previous recovery high of 93.4 in August. The index was last this strong in October 2007, right at the beginning of the Great Recession.
October's gain is concentrated almost entirely in the expectations component, which jumped 8.6 points to 95.0 in a reading that isn't quite a recovery high but near one, next only to February 2011's 97.5. The strength in expectations reflects optimism in the outlook for both jobs and income, both of which show convincing gains in this month's report.
Showing only marginal strength is the present situation component which rose only 7 tenths to 93.7. Yet this is still a very strong reading, surpassed only once in the recovery in this year's August reading of 93.9. Looking at details, the reading on jobs-hard-to get, at only 29.1 percent vs 29.4 percent in September, hints at strength for the October jobs report.
Turning to the latest University of Michigan report, consumer sentiment extended its recovery-best performance in October, coming in at a final 86.9 vs 86.4 at mid-month and September's final reading of 84.6. The index is at its highest level since July 2007.
A big gain in expectations leads the October report, at a final 79.6 vs September's 75.4. Gains in this component point to rising confidence in the jobs outlook.
The current conditions component remains especially strong and is holding near its recovery best levels where it has been for the last year. But the reading compared to September is fractionally lower, at 98.3 versus 98.9. This points to strength in consumer activity in October but not acceleration.
Overall, the readings on the consumer mood are moderately favorable with improvement in the labor market and lower gasoline prices being key factors.
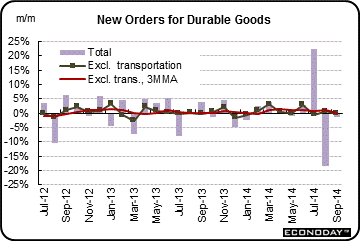 The manufacturing sector may be slipping. Durables orders notably disappointed in September after August's decline after a July surge. The core was soft in September but volatile (as usual) in recent months. New factory orders for durables decreased 1.3 percent in September after dropping 18.3 percent in August and spiking 22.5 percent in July. Analysts projected a 0.9 percent rise for September. Transportation dipped 3.7 percent after falling a monthly 42.4 percent in August. The manufacturing sector may be slipping. Durables orders notably disappointed in September after August's decline after a July surge. The core was soft in September but volatile (as usual) in recent months. New factory orders for durables decreased 1.3 percent in September after dropping 18.3 percent in August and spiking 22.5 percent in July. Analysts projected a 0.9 percent rise for September. Transportation dipped 3.7 percent after falling a monthly 42.4 percent in August.
Excluding transportation, durables orders slipped 0.2 percent, following a rebound of 0.7 percent in August. Expectations were for a 0.5 percent gain.
Within transportation, nondefense aircraft fell a monthly 16.1 percent, following a 74.0 percent drop in August. This subcomponent is coming off a massive 315.6 percent monthly spike in July essentially reflecting Boeing aircraft orders. Defense aircraft orders fell 7.8 percent in September after a decline of 4.7 percent the month before. Motor vehicle orders continue to be volatile but healthy on average. This subcomponent eased 0.1 percent in September, following a decrease of 6.6 percent in August and a jump of 10.0 percent in July.
Outside of transportation, major industries seeing a gain in the latest month were primary metals, fabricated metals, electrical equipment, and "other." Declines were seen in machinery and computers & electronics.
The latest durables report suggests softening in the manufacturing sector. The usual caveat still applies-durables orders are very volatile on a monthly basis.
While manufacturing was sluggish in September, the latest regional manufacturing surveys suggest improvement in October—although earlier surveys pointed to softening.
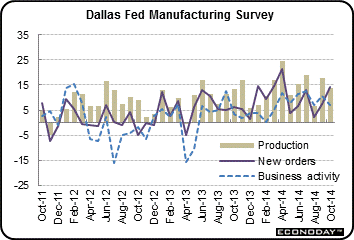 Texas factory activity increased again in October, according to business executives responding to the Texas Manufacturing Outlook Survey. The production index, a key measure of state manufacturing conditions, fell from 17.6 to 13.7, indicating output grew but at a slightly slower pace than in September. Texas factory activity increased again in October, according to business executives responding to the Texas Manufacturing Outlook Survey. The production index, a key measure of state manufacturing conditions, fell from 17.6 to 13.7, indicating output grew but at a slightly slower pace than in September.
Other measures of current manufacturing activity also reflected continued growth in October. The new orders index rose notably from 7.5 to 14.2, reaching a six-month high. The capacity utilization index edged down to 18.1 and the shipments index slipped to 12.8, although still more than a quarter of firms noted increases in these measures over September levels.
Perceptions of broader business conditions remained optimistic this month and outlooks improved markedly. The general business activity index held steady at a solid reading of 10.5. The company outlook index surged more than 12 points to 18.2, reaching its highest level in six months.
 Overall, the Dallas Fed survey was somewhat more optimistic than other recent regional surveys. Overall, the Dallas Fed survey was somewhat more optimistic than other recent regional surveys.
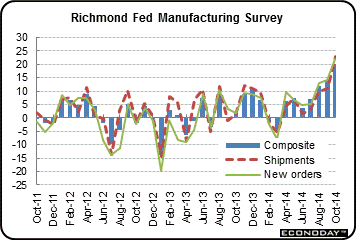
Turning to the Richmond Fed survey, the Richmond Fed's manufacturing index accelerated to 20 from September's 14.
New orders were especially strong, at 22 versus 14, as were backlogs which rose 3 points to 9 which is very strong for this reading. Shipments were also up, to 23 vs 11, with employment growth solid and steady, at 14 versus 17.
Regional data should be averaged, and together for October, with Richmond the outlier, point to little change compared to September.
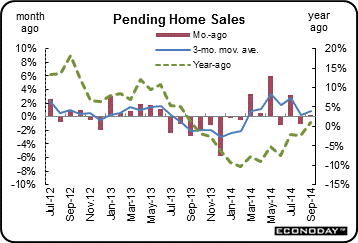 Home sales have oscillated notably this year with the trend being marginally positive. The latest pending home sales report points to continuing modest growth in sales. Home sales have oscillated notably this year with the trend being marginally positive. The latest pending home sales report points to continuing modest growth in sales.
Pending home sales were up 0.3 percent in September after a 1.0 drop in August. This was a small gain but nevertheless hints at growth ahead for existing home sales, final sales of which have been up-and-down all year though up in last week's report for September.
Looking at pending sales, which are defined as contract signings, strength was led by a 1.4 percent rise in the South which is by far the largest housing region and the region where sales are strongest. Right behind at plus 1.2 percent is the Northeast with the Midwest and West both showing declines at minus 1.2 percent and minus 0.8 percent.
One subtle plus in the report was the year-on-year trend which, after spending most of the year in the minus column, is back on the plus side at 1.0 percent, modest but a move in the right direction.
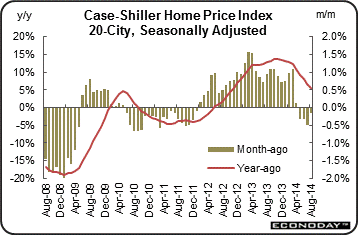 While pending home sales posted a positive number for September, other reports suggest that the housing sector's health is questionable. Home prices remain recently soft, indicating sluggish demand and that sales are due to price concessions. While pending home sales posted a positive number for September, other reports suggest that the housing sector's health is questionable. Home prices remain recently soft, indicating sluggish demand and that sales are due to price concessions.
Home prices contracted for a fourth straight month in August in Case-Shiller 20-city data, down 0.1 percent versus expectations for a gain of 0.1 percent. Prices declined in 12 of the 20 cities, not much improved from July when prices declined in 13 of the 20 cities. Contraction in the August data was most severe in Chicago, Minneapolis, and Detroit with Chicago and Minneapolis also posting very soft year-on-year rates of only plus 2.9 percent and plus 3.9 percent, respectively. The total year-on-year adjusted rate fell sharply, to plus 5.6 percent from plus 6.7 and 8.0 percent in the two prior months and a positive low double-digit trend going back to the beginning of last year. The 5.6 percent rate is the lowest since November 2012.
Essentially, the Case-Shiller report indicates that the housing sector is not robust and is muddling along.
The economy continues upward as indicated by third quarter GDP. But sectors are oscillating as indicated by on and off strength in manufacturing and housing. Fortunately, the consumer sector is improving despite the volatility in spending. Relatively low jobless claims and improved consumer confidence suggest a favorable holiday season for retailers. On the equities front, mostly positive earnings reports, mostly favorable U.S. indicators, and easing by the Bank of Japan have lifted stocks. Slowing growth in Asia has been a concern in markets.
This week's highlight is Friday's employment situation for October. September beat expectations for payroll jobs and recent initial jobless claims have been trending down. Going into the December FOMC meeting, the Fed will be comparing the two parts of its dual mandate, focusing on employment and inflation. Markets will be evaluating the employment report not just in terms of the strength of the economy but likely Fed moves on the next policy rate hike. Average hourly earnings have been soft and the Fed will be watching to see if wages firm or continue to ease. Manufacturing has softened and national surveys from Markit and ISM will get attention on the possible direction for manufacturing in October. Slowing global growth has raised concerns about strength in this sector.
Sales of total light motor vehicles fell a very sharp 6.3 percent in September compared to an extraordinarily strong August, to a lower-than-expected annual rate of 16.4 million units. All categories showed declines especially domestic-made cars which fell 9.1 percent.
Motor vehicle domestic sales Consensus Forecast for October 14: 12.9 million-unit rate
Range: 12.9 to 13.4 million-unit rate
Motor vehicle total sales Consensus Forecast for October 14: 16.6 million-unit rate
Range: 16.3 to 16.8 million-unit rate
The Markit PMI manufacturing flash index in October eased to 56.2, down tangibly from September's final 57.5 reading and compared against a 57.9 flash for mid-month September. The greatest slowing in the month was in the most important component as new business growth is described as much weaker than September and the slowest in 3 months (greater detail is not provided to the public). The report noted significant slowing in growth for export orders.
Markit PMI manufacturing index (final) Consensus Forecast for October 14: 56.1
Range: 56.0 to 57.8
The composite index from the ISM manufacturing survey for September slowed but nevertheless remained solid for the ISM manufacturing sample where the headline index fell 2.4 points to 56.6. Growth in new orders slowed noticeably, down 6.7 points from August, but was still very strong at 60.0. Backlog orders, however, fell into contraction, down 5.5 points to 47.0. A plus in the report was a fractional uptick in production to 64.6, the likely result of working down backlog. The solid rate of production was an important plus in this report that pointed to a solid gain for the manufacturing component of the industrial production report.
ISM manufacturing composite index Consensus Forecast for October 14: 56.0
Range: 55.5 to 57.2
Construction spending unexpectedly reversed course in the wrong direction in August. Construction spending declined 0.8 percent in August after a 1.2 percent rebound in July. August's decrease was led by the private nonresidential sector-down 1.4 percent, following a 1.3 percent increase in July. Public spending fell 0.9 percent in August after jumping 2.1 percent the prior month. Private residential outlays eased 0.1 percent, following a 0.4 percent boost in July. Looking at detail, the private residential component was actually favorable. Weakness was in residential excluding new homes, which are largely improvements. This subcomponent fell 2.0 percent after edging up 0.2 percent in July. On the plus side, new one-family outlays advanced 0.7 percent in August, following a 0.8 percent increase the prior month. New multifamily outlays rebounded 1.4 percent after a 0.5 percent dip in July. New private residential outlays were moderately healthy on average over the last two months. On a year-ago basis, total outlays were up 5.0 percent in August, compared to 6.9 percent in July.
Construction spending Consensus Forecast for September 14: +0.6 percent
Range: +0.3 to +1.0 percent
The U.S. international trade report for August had two key bonuses for the consumer sector—lower oil prices and signs of improved demand ahead. Lower oil prices helped the trade gap shrink in August. The trade deficit in August narrowed to $40.1 billion from $40.3 billion in July, Exports advanced 0.2 percent in August, following a 0.9 percent jump in July. Imports edged up 0.1 percent, following a 0.6 percent gain in July. The petroleum balance shrank to $13.1 billion from $14.5 billion in July. The services surplus expanded to $19.8 billion from $19.5 billion. However, the goods excluding petroleum gap increased to $45.1 billion from $44.3 billion in July.
Overall, the August report was favorable. Lower oil prices mean more discretionary income for consumers. Demand is moving forward with non-oil imports up.
International trade balance Consensus Forecast for September 13: -$40.7 billion
Range: -$42.0 billion to -$38.6 billion
Factory orders--skewed by Boeing airshow orders—fell 10.1 percent in August after soaring 10.5 percent in July. Taken together, the two months point to flat order growth for the nation's manufacturing sector. Excluding transportation, where aircraft orders are tracked, orders edged 0.1 percent lower following a 0.7 percent decline in July. But in a slight offset, orders for nondefense capital goods excluding aircraft -- which is a core reading on business investment -- rose 0.4 percent to more than offset a 0.1 percent decline in the prior month. Another positive in the report was a solid 0.6 percent rise in total unfilled orders, which have been solid and which will give manufacturers some breathing space should new orders remain flat. Turning back to new orders, motor vehicles fell a steep 5.4 percent following July's outsized 7.3 percent gain in volatility likely tied to adjustment issues surrounding this year's later timing of auto retooling. Nondefense aircraft, the wildcard in the July and August reports, showed a 74 percent swing lower following July's 316 percent surge. New orders for total nondurable goods industries fell 0.4 percent following July's 0.8 percent decline, both reflecting price effects on petroleum and coal products. More recently, new factory orders for durables decreased 1.3 percent in September after dropping 18.3 percent in August and spiking 22.5 percent in July.
Factory orders Consensus Forecast for October 14: -0.7 percent
Range: -1.2 to +2.7 percent
ADP private payroll employment for September posted with a gain of 213,000. This compares with the comparable number with the later released employment situation report. According to the BLS, private payrolls advanced 236,000 in September
ADP private payrolls Consensus Forecast for October 14: 230,000
Range: 200,000 to 240,000
The Markit PMI services flash index for October fell to 57.3 for a 6-month low and noticeably below September's final reading of 58.9 and September's mid-month reading of 58.5. The index ended August at 59.5. Details show a slowing in new business growth this month to a 3-month low and a downtick in business confidence to just about a 2-year low. But there were positives including job creation which, though unchanged, is at a 3-month high. Unfinished work and backlog accumulation are both solid. Looking at prices, inputs are down while outputs are showing traction. Though a high 50 reading is consistent with solid growth, the latest report nevertheless points to a slower ending to the third quarter for the bulk of the nation's economy and will certainly pull down forecasts for next week's ISM non-manufacturing survey.
Markit PMI services index (final) Consensus Forecast for October 14: 57.1
Range: 56.8 to 59.1
The composite index from the ISM non-manufacturing survey for September index came in at 58.6 vs August's 59.6. Growth in new orders slowed slightly but was very strong at 61.0 versus August's 63.8. The same was true for business activity (akin to a production index) which slowed to 62.9 from 65.0. Employment was a special plus in the report, rising 1.4 points to 58.5 which was the strongest reading of the recovery Backlogs are up as are exports which in this report centered on software and intellectual property.
ISM non-manufacturing composite index Consensus Forecast for October 14: 58.0
Range: 56.0 to 59.5
Initial jobless claims moved higher in last week's data but averages were still at recovery lows. Initial claims rose 3,000 in the October 25 week to 287,000 but the 4-week average edged slightly lower to 281,000 for the 7th straight decline and the lowest level since May 2000. The average was about 15,000 lower than the month-ago comparison which points to strength for the October employment report. There were no special factors in last week's report.
Jobless Claims Consensus Forecast for 11/1/14: 283,000
Range: 280,000 to 290,000
Nonfarm business productivity for the second quarter was nudged down to a 2.3 percent annualized gain after falling 4.5 percent in the first quarter. But unit labor costs also were bumped down to minus 0.1 percent, following an 11.6 percent annualized surge in the first quarter. First quarter numbers were heavily affected by atypically harsh winter weather. Output rebounded 5.0 percent after dipping 2.4 percent in the first quarter. Compensation growth decelerated to 2.3 percent from 6.6 percent in the first quarter. Based on deceleration in third quarter GDP growth from the second quarter weather rebound, third quarter productivity is likely to ease and labor costs firm from the second quarter.
Nonfarm Business Productivity Consensus Forecast for initial Q3 14: +1.5 percent annual rate
Range: +0.3 to +1.9 percent annual rate
Unit Labor Costs Consensus Forecast for initial Q3 14: +0.8 percent annual rate
Range: 0.0 to +2.2 percent annual rate
Nonfarm payroll employment in September gained 248,000, after a 180,000 rise in August and 243,000 increase in July. Revisions to July and August were quite sizeable and positive. Net revisions for July and August were up a sharp 69,000. The unemployment rate declined to 5.9 percent from 6.1 percent in August. Expectations were for 6.1 percent. The jobless rate was at a six year low. From the household survey in September, the labor force declined 97,000, employment gained 232,000, and the number of unemployed dropped 329,000. The "U-6" under-employment rate dipped to 11.8 percent from 12.0 percent in August. This figure includes unemployed, those working part time for economic reasons, and those marginally attached to the labor force. Going back to the payroll report, private payrolls advanced 236,000 in September after a 175,000 boost in August. Average hourly earnings were unchanged in September after a 0.3 percent rise the month before. Average weekly hours ticked up to 34.6 hours versus 34.5 hours in August and expectations for 34.5 hours.
Nonfarm payrolls Consensus Forecast for October 14: 240,000
Range: 200,000 to 282,000
Private payrolls Consensus Forecast for October 14: 235,000
Range: 205,000 to 277,000
Unemployment rate Consensus Forecast for October 14: 5.9 percent
Range: 5.8 to 6.0 percent
Average workweek Consensus Forecast for October 14: 34.6 hours
Range: 34.5 to 34.6 hours
Average hourly earnings Consensus Forecast for October 14: +0.2 percent
Range: +0.2 to +0.3 percent
Consumer credit outstanding in August slipped $0.2 billion to end five straight months of gains. Non-revolving credit outstanding, boosted by strong vehicle sales and the government's continued acquisition of student loans from private lenders, rose yet again, up $13.7 billion for the 36th straight month of increase. But the gain for the non-revolving component was the smallest since January and, combined with the slippage in revolving credit, made for a lower-than-expected total increase of $13.5 billion.
Consumer credit Consensus Forecast for September 14: +$16.0 billion
Range: +$14.9 billion to +$22.0 billion
R. Mark Rogers is the author of The Complete Idiot's Guide to Economic Indicators, Penguin Books.
He can also be found on a weekly broadcast talking about the U.S. economy, the easiest way to find him is by going to iTunes and searching for "Simply Economics."
Econoday Senior Writer Mark Pender contributed to this article.
|
