|
The economy continues to oscillate by sector but is maintaining overall moderate growth. Oil currently is the big player in equities. Meanwhile, job growth is moderate and earnings are mediocre.
 Major equity indexes this past week ranged notably from up significantly to essentially flat. Major equity indexes this past week ranged notably from up significantly to essentially flat.
The week started out mixed but little changed except the energy sector was down with oil prices. Strength in semiconductors boosted the Nasdaq. ISM manufacturing rose but construction spending declined. Manufacturing overseas appeared soft based on the Chinese government's purchasing managers' index. Tuesday, the primary economic news was another drop in oil prices which hit a three-year low. Crude tugged down on the energy sector but added to consumer staples—including Wal-Mart. Lower gasoline prices add to consumer discretionary income.
 At mid-week, stocks were mostly up. The S&P and the Dow Jones industrials closed at record highs Wednesday, led by energy and utility stocks after Republicans took control of the Senate, raising investor hopes for more business and energy friendly policies. ADP posted a slightly better-than-expected number for private employment growth. Earnings news was mostly favorable. At mid-week, stocks were mostly up. The S&P and the Dow Jones industrials closed at record highs Wednesday, led by energy and utility stocks after Republicans took control of the Senate, raising investor hopes for more business and energy friendly policies. ADP posted a slightly better-than-expected number for private employment growth. Earnings news was mostly favorable.
Thursday saw mostly notable gains in equities. The Dow Jones industrials and S&P closed at record highs Thursday, helped by indications the European Central Bank would take more policy action if needed to boost a struggling Eurozone economy. European Central Bank President Mario Draghi said at his press conference following the ECB's monetary policy meeting that the Bank is prepared to inject up to €1 trillion of new liquidity into the Eurozone economy. Also, initial jobless claims in the U.S. dropped 10,000 to a three-week low of 278,000 in the week ended November 1. The week ended on a mixed note as payroll jobs for October gained less than expected while the unemployed ticked down below forecasts. The Dow and the S&P 500 continued at record closes.
Equities were flat to up this past week. The Dow was up 1.1 percent; the S&P 500, up 0.7 percent; and the Wilshire 5000, up 0.6 percent. The Nasdaq and the Russell 2000 were flat for the week.
For the year-to-date, major indexes are up as follows: the Dow, up 6.0 percent; the S&P 500, up 9.9 percent; the Nasdaq, up 10.9 percent; the Russell 2000, up 0.8 percent; and the Wilshire 5000, up 8.5 percent.
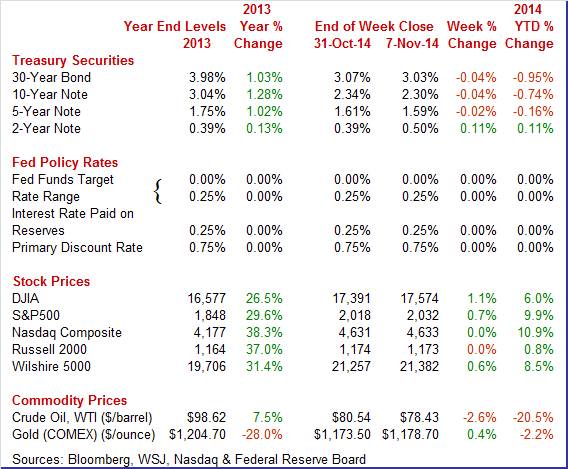
Weekly percent change column reflects percent changes for all components except interest rates. Interest rate changes are reflected in simple differences.
 Treasury yields were little changed this past week although short rates nudged up while long rates slipped. Treasury yields were little changed this past week although short rates nudged up while long rates slipped.
Rates firmed marginally Monday after s favorable report on ISM manufacturing. Yields showed little change Tuesday and Wednesday. Republican gains from Tuesday's elections appear to have been anticipated.
Rates gained Thursday on a drop in initial jobless claims but declined Friday as payroll jobs for October fell short of forecasts.
For this past week Treasury rates were mixed as follows: 3-month T-bill, up 2 basis points; the 2-year note, up 1 basis point; the 5-year note, down 5 basis points; the 7-year note, down 7 basis points; the 10-year note, down 4 basis points; and the 30-year bond, down 4 basis points.
 The spot price of crude continued its four month decline. The spot price of crude continued its four month decline.
Spot West Texas Intermediate fell somewhat more than $2 per barrel on Monday. Saudi Arabia cut the price of its oil to U.S. customers in the face of soaring North American output from shale fields. Crude continued to fall Tuesday by just over a dollar a barrel. Traders believed that OPEC wants to retain market share instead of prices.
On Wednesday, WTI bumped up a buck and a half on a weekly government report showing that U.S. inventories rose less than expected and on news that refineries boosted their operating rates. Thursday, crude dipped by a dollar as OPEC lowered forecasts for its oil demand and as the dollar strengthened. Crude is generally priced in U.S. dollars. WTI was little changed Friday.
There are two strong trends in the oil market. U.S. production remains strong although that could moderate with lower oil prices. The second trend is that OPEC members have refused to cut production. The clear winner is the consumer with lower prices for gasoline and heating oil.
Net for the week, the spot price for West Texas Intermediate dropped $2.11 per barrel to settle at $78.43.
In June 13, 2014, spot WTI stood at $106.87 per barrel.
This past week's big news was the employment situation for October. Payroll gains were just so-so. A key concern for the Fed likely is soft earnings growth even as the unemployment rate eased. Other sectors were mixed.
 The October employment situation was mixed. Payroll jobs advanced but below expectations. The unemployment rate ticked down again. But wages remained soft. The data will let the Fed remain loose. The October employment situation was mixed. Payroll jobs advanced but below expectations. The unemployment rate ticked down again. But wages remained soft. The data will let the Fed remain loose.
Nonfarm payroll jobs advanced 214,000 in October after gaining 256,000 September and 203,000 in August. Net revisions for August and September were up 31,000. The median market forecast for October was for a 240,000 boost.
The unemployment rate dipped to 5.8 percent in October from 5.9 percent in September. Expectations were for 5.9 percent.
 The U-6 underemployment rate (which takes into account traditional unemployed, plus all persons marginally attached to the labor force, plus total employed part time for economic reasons, as a percent of the civilian labor force plus all persons marginally attached to the labor force) declined to 11.5 percent from 11.8 percent in September. This rate is one of Fed Chair Janet Yellen's favorite labor market indicators. The U-6 underemployment rate (which takes into account traditional unemployed, plus all persons marginally attached to the labor force, plus total employed part time for economic reasons, as a percent of the civilian labor force plus all persons marginally attached to the labor force) declined to 11.5 percent from 11.8 percent in September. This rate is one of Fed Chair Janet Yellen's favorite labor market indicators.
Going back to the payroll report, private payrolls grew 209,000 after advancing 244,000 in September. Analysts projected 235,000.
Goods-producing jobs increased 28,000 in October after a 36,000 gain the month before. Manufacturing employment increased 15,000 in October, following a rise of 9,000 in September. Motor vehicles and parts rebounded 3,000, after slipping 1,000 the month before. Construction advanced 12,000 after a gain of 19,000 in September. Mining edged up 1,000 in October, following an 8,000 rise in September.
Private service-providing jobs gained 181,000 after a 208,000 boost in September. Strength again was seen in professional & business services and retail trade.
Average hourly earnings edged up 0.1 percent after no change in September. Market forecasts were for 0.2 percent. Average weekly hours ticked up to 34.6 hours versus 34.5 hours in September. Projections were for 34.6 hours.
 On a positive note (taking into account payroll growth, average hourly earnings, and change in the average workweek), private aggregate weekly earnings rose 0.6 percent in October, pointing to a notable rise in private wages & salaries. Production worker hours in manufacturing were up 0.3 percent for the month, suggesting a moderate manufacturing component for October industrial production. However, October would stand out from the slowing trend in earnings. On a positive note (taking into account payroll growth, average hourly earnings, and change in the average workweek), private aggregate weekly earnings rose 0.6 percent in October, pointing to a notable rise in private wages & salaries. Production worker hours in manufacturing were up 0.3 percent for the month, suggesting a moderate manufacturing component for October industrial production. However, October would stand out from the slowing trend in earnings.
Essentially, the labor market is improving but slowly and remains soft. Based on October data and unless the numbers strengthen faster, the Fed likely will not rush increases in policy rates.
 Sales of cars and light trucks firmed very slightly in October, to a 16.5 million annual pace versus 16.4 million in September. Sales of North American-made vehicles led October, rising to a 13.3 million rate from September's 13.2 million. Sales of cars and light trucks firmed very slightly in October, to a 16.5 million annual pace versus 16.4 million in September. Sales of North American-made vehicles led October, rising to a 13.3 million rate from September's 13.2 million.
Foreign-made sales slowed slightly to 3.2 million. These results point to little change for the motor vehicle component of the October retail sales report.
While sales are volatile on a monthly basis due to on and off incentives, production continues a moderate upward trend.
The direction of U.S. manufacturing in October is uncertain as two national surveys headed in opposite directions—Markit's PMI decelerated while ISM picked up the pace.
October was a soft month for Markit's U.S. manufacturing sample where the composite index slowed to 55.9, down from 56.2 at mid-month and down sizably from 57.5 in final September. The comparison with September points to slowing growth for October's manufacturing activity.
Weighing the most on the composite was the most important reading of all, in new business where monthly growth slowed to its lowest rate since the severe weather of this year's January. The report cited especially soft growth in export sales and noted the slowest increase in total backlog orders since January.
Production was also the slowest since January while, however, on the plus side was what the report described as "robust" job growth, the result of rising business investment, new products, and confidence in the economic outlook.
 Turning to ISM, the ISM report stands out starkly from the net result of other anecdotal surveys on October's manufacturing sector, showing outstanding growth at a composite index of 59.0 versus 56.6 in September. This level matches August's level with the two the strongest since February 2011. Turning to ISM, the ISM report stands out starkly from the net result of other anecdotal surveys on October's manufacturing sector, showing outstanding growth at a composite index of 59.0 versus 56.6 in September. This level matches August's level with the two the strongest since February 2011.
New orders, the most important reading in the report, rose a strong 5.8 points to a blistering 65.8. This points to rising activity across the supply chain in the months ahead. Export orders slowed in the month, as they did for Markit's sample, which implies that domestic demand is especially strong. In two signs of strength, total backlog orders rose while supplier deliveries, reflecting ongoing congestion in the supply chain, slowed.
Production, at 64.8, was strong and in line with orders. Inventories showed slight accumulation. Price pressures moderated as they have in most reports for October, the result of lower oil prices.
This report may be just a bit too strong, given that ISM's data have not been tracking well this year with hard data on the manufacturing sector where growth has been flat.
 Slower global growth may have worsened the U.S. trade deficit in September. The trade gap in September expanded to $43.0 billion from $40.0 billion in August. Analysts expected a deficit of $40.7 billion. Slower global growth may have worsened the U.S. trade deficit in September. The trade gap in September expanded to $43.0 billion from $40.0 billion in August. Analysts expected a deficit of $40.7 billion.
Exports declined 1.5 percent in September, following a rise of 0.3 percent in August. Imports were unchanged, following a 0.1 percent uptick the month before.
The September decrease in exports of goods reflected decreases in industrial supplies and materials ($2.0 billion); capital goods ($1.2 billion); consumer goods ($0.7 billion); other goods ($0.1 billion); and automotive vehicles, parts, and engines ($0.1 billion). An increase occurred in foods, feeds, and beverages ($1.3 billion).
 The August to September decrease in imports of goods reflected decreases in industrial supplies and materials ($1.1 billion); capital goods ($0.9 billion); and automotive vehicles, parts, and engines ($0.5 billion). Increases occurred in consumer goods ($1.9 billion); other goods ($0.3 billion); and foods, feeds, and beverages ($0.1 billion). The August to September decrease in imports of goods reflected decreases in industrial supplies and materials ($1.1 billion); capital goods ($0.9 billion); and automotive vehicles, parts, and engines ($0.5 billion). Increases occurred in consumer goods ($1.9 billion); other goods ($0.3 billion); and foods, feeds, and beverages ($0.1 billion).
The petroleum gap grew to $14.0 billion from $13.1 billion in August. The goods excluding petroleum gap increased to $47.2 billion from $45.5 billion in August. The services surplus slipped to $19.6 billion from $20.2 billion.
Overall, slower global growth has nudged down growth in the U.S. A higher dollar may be playing somewhat of a role in softer exports. But recently lower oil prices likely will result in a favorable number for October.
 Construction outlays unexpectedly declined in September on public outlays and somewhat on the private nonresidential component. Private residential spending was a positive for the month. Construction spending declined 0.4 percent in September after a 0.5 percent decrease in August. Market expectations were for a 0.6 percent boost. Construction outlays unexpectedly declined in September on public outlays and somewhat on the private nonresidential component. Private residential spending was a positive for the month. Construction spending declined 0.4 percent in September after a 0.5 percent decrease in August. Market expectations were for a 0.6 percent boost.
September's decrease was led by public outlays which fell 1.3 percent after a 1.0 percent drop in August. Private nonresidential spending dipped 0.6 percent, following an easing of 0.3 percent the month before.
On a positive note, private residential construction spending rebounded 0.4 percent, following a decrease of 0.3 percent in August. And strength was in the new one-family component which advanced 1.1 percent in September, following a 1.2 percent gain the month before.
On a year-ago basis, total outlays were up 2.9 percent in September compared to 4.4 percent in August.
The latest construction outlays report probably will shave off estimates by analysts for third quarter GDP-although it still remains moderately positive over all.
U.S. economic growth is moderate but looks strong compared to Europe. Plus Asia may be decelerating. The latest few months of U.S. data clearly confirm the adage that one month does not a trend make. Manufacturing and construction sectors are oscillating monthly but still appear to have some upward momentum. Consumers are not spending like gangbusters but seem to be relieved that the labor market has stabilized and has moderate upward momentum. However, most at the Fed still see the economy as fragile. Fed tightening currently is not likely soon.
It's a relatively light week but key consumer numbers post. Retail sales have been volatile due to swings in auto sales and gasoline prices. Employment growth has been moderate at best and this week's JOLTS report will indicate whether there is improvement in job openings. Despite the sluggish recovery, consumer sentiment has improved on more stable labor market conditions. Whether the trend continues will be seen in this coming week's early reading on November consumer sentiment. Finally, initial jobless claims have been trending downward and this week's number could be a market mover.
U.S. Holiday: Veteran's Day
Stocks & futures open; bonds closed.
The NFIB Small Business Optimism Index in September fell to 95.3 from 96.1 in August. Sharp drops in current job openings and capital spending plans were the biggest factors pulling down the small business optimism index. Other negatives include earnings trends and the outlook for credit conditions. September's report was short on positives which did include, however, sentiment on expansion which, despite the decline in capital spending plans, showed a big improvement.
NFIB Small Business Optimism Index Consensus Forecast for October 14: 96.0
Range: 94.0 to 96.5
Wholesale inventories in August swelled by 0.7 percent against a very sharp 0.7 percent decline in sales. The mismatch drove the stock-to-sales ratio in the sector up 2 notches, to 1.19 from 1.17 for the heaviest reading since February. Much of the build was tied to autos where inventories rose 0.6 percent while sales fell 0.5 percent. Large builds for autos were welcome in prior months given the very solid strength for sales, but manufacturer sales in September fell which points to the risk of another unwanted build underway. Excluding autos, the wholesale sector's stock-to-sales ratio rose only 1 notch, to 1.15 from 1.14. Other sectors besides autos showing heavier inventories include farm products, lumber, professional equipment, and petroleum products where sales fell very sharply.
Wholesale inventories Consensus Forecast for September 14: +0.2 percent
Range: -0.3 to +0.8 percent
Initial jobless claims fell 10,000 in the November 1 week to 278,000. The 4-week average was down 2,250 to 279,000. This was the seventh decline in eight weeks for the average and a new 14-year low. Continuing claims, in data that lag by a week, were also down, at 2.348 million for a 39,000 decline in the October 25 week and another 14-year low. The 4-week average was down 8,000 to 2.370 million with the unemployment rate for insured workers unchanged at 1.8 percent.
Jobless Claims Consensus Forecast for 11/8/14: 280,000
Range: 265,000 to 285,000
The Labor Department's Job Openings and Labor Turnover Survey showed that there were 4.835 million job openings on the last business day of August, up from 4.605 million in July. The hires rate (3.3 percent) was down and the separations rate (3.2 percent) was essentially unchanged in August. Within separations, the quits rate (1.8 percent) was unchanged and the layoffs and discharges rate (1.1 percent) was little changed. This release included estimates of the number and rate of job openings, hires, and separations for the nonfarm sector by industry and by four geographic regions. There were 4.835 million job openings on the last business day of August and the rate was 3.4 percent.
JOLTS job openings Consensus Forecast for September 14: 4.800 million
Range: 4.655 million to 4.850 million
The U.S. Treasury monthly budget report for September showed an 8.9 percent rise in receipts that more than offset a 1.3 percent rise in spending to drive down the government's full-year fiscal 2014 deficit by 29 percent, to $483.4 billion from $680.2 billion in fiscal year 2013. This is the lowest deficit of the recovery, since fiscal year 2008, and compares with deficits of $1.09 trillion and $1.30 trillion in the two prior fiscal years. Relative to GDP, this fiscal year's deficit fell to 2.8 percent from 4.1 percent in fiscal year 2013. The month of September itself showed a surplus of $105.8 billion, up from last September's surplus of $75.1 billion. The gain in this fiscal year's receipts included a 5.9 percent rise in individual income taxes, which is by far the largest component at $1.40 trillion, and a 17.3 percent rise in corporate income taxes to $320.7 billion. The spending side of the ledger showed a 4.7 percent decline for defense to $605.2 billion.
Looking ahead, the month of October typically shows a deficit for the month. Over the past 10 years, the average deficit for the month of October has been $97.0 billion and $138.2 billion over the past 5 years. The October 2013 deficit came in at $90.6 billion.
Treasury Statement Consensus Forecast for October 14: -$130.0 billion
Range: -$130.0 billion to -$111.7 billion
Retail sales in September declined 0.3 percent after jumping 0.6 percent in August. Excluding autos, sales slipped 0.2 percent after gaining 0.3 percent in August.. Excluding both autos and gasoline sales dipped 0.1 percent, following a jump of 0.5 percent in August. Expectations were for 0.5 percent. Within the core, softness was seen in declines furniture & home furnishings, building materials, nonstore retailers, clothing & accessories, and sporting goods & hobbies. Gains were posted for electronics & appliances (likely iPhones), health & personal care, general merchandise, and food services & drinking places. The latest report was very mixed. It was not surprising that a downswing in auto sales after a strong August pulled down sales. And the same was expected for gasoline prices pulling down sales. But core sales eased despite a surge in electronics sales. But there was monthly volatility. Core sales eased after a very strong August. On a very positive note, food services & drinking places gained a robust 0.6 percent, matching the pace for August. This is a very discretionary component, suggesting that the consumer is still spending. Looking ahead, auto sales may add modestly to retail sales while lower gasoline price may pull down.
Retail sales Consensus Forecast for October 14: +0.2 percent
Range: -0.3 to +0.5 percent
Retail sales excluding motor vehicles Consensus Forecast for October 14: +0.2 percent
Range: 0.0 to +0.4 percent
Less motor vehicles & gasoline Consensus Forecast for October 14: +0.5 percent
Range: +0.3 to +0.7 percent
Import prices fell 0.5 percent in September for the third straight decline. Year-on-year, import prices were deep into the deflationary zone at minus 0.9 percent. The drop in imported petroleum prices, down 2.0 percent in the month and down 6.6 percent year-on-year, was a key factor in the import-price decline, but even when excluding petroleum, import prices fell 0.2 percent in the month. Year-on-year, the ex-petroleum reading was in the plus column but not by much, at plus 0.7 percent.
Export prices fell 0.2 percent for a second straight monthly decline and were also down 0.2 percent year-on-year. Here, agricultural prices were a key factor, down 0.9 percent in the month and down 2.9 percent year-on-year. When excluding agriculture, export prices also fell 0.2 percent on the month and were unchanged year-on-year.
Import prices Consensus Forecast for October 14: -1.5 percent
Range: -2.0 to +0.2 percent
Export prices Consensus Forecast for October 14: -0.4 percent
Range: -0.9 to +0.1 percent
The Reuter's/University of Michigan's consumer sentiment index extended its recovery-best performance in October, coming in at a final 86.9 versus 86.4 at mid-month and September's final reading of 84.6. The index is at its highest level since July 2007. A big gain in expectations led the October report, at a final 79.6 versus September's 75.4. Gains in this component point to rising confidence in the jobs outlook. The current conditions component remained especially strong and was holding near its recovery best levels where it has been for the last year.
Consumer sentiment Consensus Forecast for preliminary November 14: 87.5
Range: 86.5 to 89.0
Business inventories rose 0.2 percent in August in contrast to a 0.4 decline for business sales. Yet the mismatch was not enough to the raise the stock-to-sales ratio which held at 1.29. The latest report included August inventory data from the retail sector where the September sales report showed broad contraction. Retail inventories actually thinned in August on a total dollar basis and also relative to sales with the sector's stock-to-sales ratio dipping to 1.41 from 1.43.
Business inventories Consensus Forecast for September 14: +0.3 percent
Range: 0.0 to +0.5 percent
R. Mark Rogers is the author of The Complete Idiot's Guide to Economic Indicators, Penguin Books.
He can also be found on a weekly broadcast talking about the U.S. economy, the easiest way to find him is by going to iTunes and searching for "Simply Economics."
Econoday Senior Writer Mark Pender contributed to this article.
|
