|
Housing and manufacturing have been on and off sources of recovery strength. Now it appears that the consumer sector is the backbone of current moderate recovery.
 Equities posted moderate gains except for the Nasdaq which rose notably for the week Equities posted moderate gains except for the Nasdaq which rose notably for the week
Stocks advanced Monday, lifting the Dow Jones industrials and S&P to new closing highs. The focus was on earnings with such as Dean Foods and home builder Toll Brothers leading stocks up moderately on profits topping forecasts. Tuesday was quiet with trading still on the Veterans' Day holiday but thin. Key indexes extended record highs, with the S&P 500 Index advancing a fifth day, as gains in homebuilder shares helped offset losses among industrial companies.
 At mid-week, stocks traded around the breakeven point. Financial shares lost ground after global regulators fined five major banks. The banks, including UBS AG, HSBC Holdings and Citigroup, were fined US$3.4 billion for failing to stop their traders from trying to manipulate the foreign exchange market. Investors were also watching developments in Ukraine, where the country's defense minister said the military should prepare for clashes, as growing tensions in the nation's eastern combat zone threatened to boil over into open conflict. Energy shares along with oil prices. At mid-week, stocks traded around the breakeven point. Financial shares lost ground after global regulators fined five major banks. The banks, including UBS AG, HSBC Holdings and Citigroup, were fined US$3.4 billion for failing to stop their traders from trying to manipulate the foreign exchange market. Investors were also watching developments in Ukraine, where the country's defense minister said the military should prepare for clashes, as growing tensions in the nation's eastern combat zone threatened to boil over into open conflict. Energy shares along with oil prices.
Thursday, the consumer sector looked good with a low jobless claims number and with Wal-Mart topping estimates for the third quarter. Friday, the trend continued with retail sales a little higher than expectations.
Equities were up this past week. The Dow was up 0.3 percent; the S&P 500, up 0.4 percent; the Nasdaq, up 1.2 percent; the Russell 2000, up but less than a point; and the Wilshire 5000, up 0.3 percent.
For the year-to-date, major indexes are up as follows: the Dow, up 6.4 percent; the S&P 500, up 10.4 percent; the Nasdaq, up 12.3 percent; the Russell 2000, up 0.9 percent; and the Wilshire 5000, up 8.9 percent.
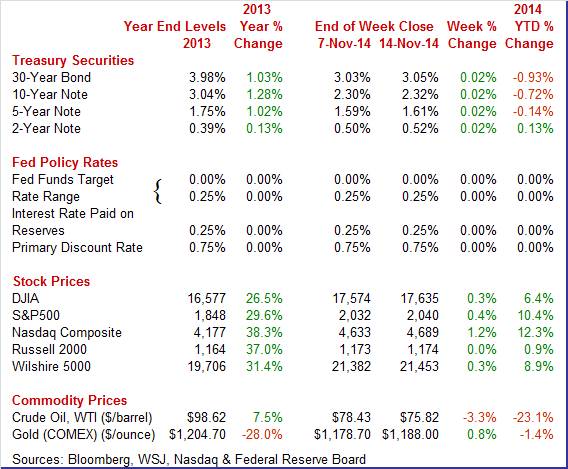
Weekly percent change column reflects percent changes for all components except interest rates. Interest rate changes are reflected in simple differences.
 In a quiet week, Treasury yields ended the week little changed. There was moderate activity Monday. The Treasury market was closed Tuesday for Veterans Day even though stocks and futures were open. In a quiet week, Treasury yields ended the week little changed. There was moderate activity Monday. The Treasury market was closed Tuesday for Veterans Day even though stocks and futures were open.
Treasuries fell Monday as the U.S. sale of $26 billion in three-year notes attracted lower-than-average demand with investors confident a strengthening economy will prompt the Federal Reserve to raise interest rates next year.
Rates eased slightly Thursday partly on low jobless claims but also on belief for low inflation with oil prices declining. On Friday, the bond market actually paid attention to inflation expectation in the Reuters/University of Michigan report which indicated a softening in expectations and nudged rates down Friday.
For this past week Treasury rates were up as follows: the 2-year note, up 2 basis points; the 5-year note, up 2 basis points; the 7-year note, up 2 basis points; the 10-year note, up 2 basis points; and the 30-year bond, up 2 basis points. The 3-month T-bill slipped 1 basis point.
 The spot price of West Texas Intermediate continued a downward trend this past week. The big picture is supply. U.S. oil shale production remains strong while OPEC refuses to cut production to maintain price. The spot price of West Texas Intermediate continued a downward trend this past week. The big picture is supply. U.S. oil shale production remains strong while OPEC refuses to cut production to maintain price.
Spot WTI has fallen seven weeks in a row.
Net for the week, the spot price for West Texas Intermediate dropped $2.61 per barrel to settle at $75.82.
The economy continues to grow and the strong portion now seems to be a moderately healthy consumer sector.
 The consumer is feeling more confidence and is willing to spend with gasoline prices down. The consumer is feeling more confidence and is willing to spend with gasoline prices down.
Retail sales in October were up despite downward headwinds from lower gasoline prices. Retail sales in October rebounded 0.3 percent after declining 0.3 percent in September.
Auto sales made a partial rebound of 0.5 percent after a 1.2 percent drop in September and jump of 1.8 percent in August, largely reflecting unit new motor vehicle sales. Auto sales have fluctuated due to on and off sales incentives.
 Excluding autos, sales gained 0.3 percent after no change in September. Due to declines in gasoline prices, gasoline station sales fell 1.5 percent in October after decreasing 0.8 percent the prior month. Excluding both autos and gasoline, sales jumped 0.6 percent in October after a 0.1 percent rise the month before. The median market forecast was for 0.5 percent. Excluding autos, sales gained 0.3 percent after no change in September. Due to declines in gasoline prices, gasoline station sales fell 1.5 percent in October after decreasing 0.8 percent the prior month. Excluding both autos and gasoline, sales jumped 0.6 percent in October after a 0.1 percent rise the month before. The median market forecast was for 0.5 percent.
Within the core, moderate strength was seen in nonstore retailers, sporting goods & hobbies, food services & drinking places, and miscellaneous store retailers. Electronics & appliance stores declined along with department stores.
The latest report is moderately positive as component gains were broadly based and consistent with recent gains in consumer confidence and a downward trend in initial jobless claims. The next important consumer report will be personal income which includes spending. With gasoline prices moving sharply downward, the real spending number should be given extra attention.
 With the recovery seeing oscillating numbers in housing and manufacturing, it is good news that the consumer sector is improving—including the consumer mood heading into the holiday sales season. With the recovery seeing oscillating numbers in housing and manufacturing, it is good news that the consumer sector is improving—including the consumer mood heading into the holiday sales season.
Consumer sentiment in fact is spiking going into the holiday shopping season, at 89.4 for the preliminary November reading versus October's final reading of 86.9 and preliminary reading of 86.4. Strength was led by the current conditions component which rose a very sizable 4.7 points from final September to 103.0. This offers an early indication, and a very positive indication, on the November-vs-October comparison in consumer activity. The expectations component showed less strength and less monthly acceleration but is still respectable, at 80.6 for a 1.0 point gain from final September. All these readings are the highest they've been since 2007.
 Falling gasoline prices are a major factor boosting confidence but are also a major factor dragging down inflation expectations which fell 3 tenths for the 1-year outlook to 2.6 percent which is unusually low for this reading. The 5-year outlook is also at 2.6 percent for a 2 tenths decline. Falling gasoline prices are a major factor boosting confidence but are also a major factor dragging down inflation expectations which fell 3 tenths for the 1-year outlook to 2.6 percent which is unusually low for this reading. The 5-year outlook is also at 2.6 percent for a 2 tenths decline.
Prior gains in this report, as well as the monthly consumer confidence report, offered leading indications of strength for October's retail sales report. This report offers new indications of future strength.
 The latest job openings & labor turnover survey was mixed but net moderately positive. Job openings were positive, hires rose, while the quits rate rose. A rising quits rate may reflect a stronger jobs market. The latest job openings & labor turnover survey was mixed but net moderately positive. Job openings were positive, hires rose, while the quits rate rose. A rising quits rate may reflect a stronger jobs market.
There were 4.735 million job openings on the last business day of September, compared to 4.853 million in August. The job openings rate was 3.3 percent. The number of job openings was little changed for total private and government in September. The level of job openings decreased for arts, entertainment, and recreation.
The number of job openings (not seasonally adjusted) increased over the 12 months ending in September for total nonfarm, total private, and government. The job openings level increased over the year for many industries, including both professional & business services and health care & social assistance.
The hires level increased to 5.026 million in September, up from 4.742 million in August. This was the highest level of hires since December 2007.
 There were 4.788 million total separations in September, up from 4.531 million in August. The separations rate was 3.4 percent. The number of total separations increased for total private and was little changed for government. There were 4.788 million total separations in September, up from 4.531 million in August. The separations rate was 3.4 percent. The number of total separations increased for total private and was little changed for government.
The number of quits increased from 2.510 million in August to 2.753 million in September. This was the highest level of quits since April 2008. The quits rate in September was 2.0 percent. The number of quits increased for total private and government. The quits level increased in professional and business services, health care and social assistance, and state and local government.
In September, there were 388,000 other separations for total nonfarm, little changed from August.
This past week focused on the consumer sector and the latest indicators suggest moderate improvement. Third quarter still is likely to decelerate from the weather rebound of the second quarter but the fourth quarter is starting to look moderately healthy based on the consumer sector. This is likely to spread to manufacturing sector.
This coming week has a variety of indicators. The biggest market mover may be Fed minutes on Wednesday which might provide more detail on when the Fed starts to raise policy rates next year and its plans for lowering its balance sheet. Quantitative easing is over and rate change and unwinding are the next key Fed issues. Both housing and manufacturing have been oscillating in recent months. Important updates are posted for housing starts, existing home sales, and industrial production.
The Empire State manufacturing index for October fell to 6.17 from September's 5-year high of 27.54. October's reading signaled the slowest rate of monthly growth since April. Details of the report likewise showed sudden reversal with new orders in contraction at minus 1.73 versus September's 16.86 and shipments barely above the zero line at 1.12 versus 27.08.
Empire State Manufacturing Survey Consensus Forecast for November 14: 10.3
Range: 7.5 to 15.0
Industrial production jumped an outsized 1.0 percent in September after a decline of 0.2 percent in August. Forecasts were for 0.4 percent. Yes, utilities were the big mover, spiking a monthly 3.9 percent, following a 1.2 percent gain the prior month. But manufacturing was solid, rebounding 0.5 percent in September after a 0.5 percent decline the month before. Mining advanced 1.8 percent, following a 0.3 percent increase in August. Overall capacity utilization jumped to 79.3 percent from 78.7 percent in August. Manufacturing appears to have regained some steam for the U.S. economy. The third quarter still appears likely to post moderately healthy growth.
Industrial production Consensus Forecast for October 14: +0.2 percent
Range: -0.1 to +0.4 percent
Manufacturing production component Consensus Forecast for October 14: +0.3 percent
Range: +0.2 to +0.4 percent
Capacity utilization Consensus Forecast for October 14: 79.3 percent
Range: 79.0 to 79.4 percent
The producer price index for final demand in September slipped 0.1 percent, following no change the month before. Total final demand excluding food & energy was unchanged after easing to 0.1 percent in August. Total final demand excluding food, energy, and trade services dipped 0.1 percent after rising 0.2 percent in August. The index for final demand goods moved down 0.2 percent in September, the second consecutive decrease. The September decline was led by prices for final demand energy, which fell 0.7 percent. The index for final demand foods also decreased 0.7 percent. In contrast, prices for final demand goods less foods and energy advanced 0.2 percent. On a seasonally adjusted year-ago basis, PPI final demand was up 1.6 percent in September versus 1.8 percent in August. Excluding food & energy, PPI final demand was up 1.8 percent, versus the August pace of 1.6 percent. Inflation numbers are very soft and giving central banks leeway to easy monetary policy.
PPI-FD Consensus Forecast for October 14: -0.1 percent
Range: -0.3 to +0.1 percent
PPI-FD ex Food & Energy Consensus Forecast for October 14: +0.1 percent
Range: 0.0 to +0.2 percent
The NAHB housing market index for October was down 5 points to 54. The key in October's report was the traffic component which was down a full 6 points to 41. Lack of traffic pointed to lack of interest including lack of interest from the important group of first-time home buyers. The report's two other components were also down with present sales down 6 points to 57 and future sales down 3 points to 64.
NAHB housing market index Consensus Forecast for November 14: 55.0
Range: 52.0 to 56.0
Housing starts data continue to be volatile. Starts and permits rebounded in September after declines in August after sharp gains in July. Housing starts for September rebounded 6.3 percent after dropping 12.8 percent in August. September's pace of 1.017 million units topped market expectations for 1.010 million units and was up 17.8 percent on a year-ago basis. The multifamily component rebounded a monthly 16.7 percent after plunging 28.7 percent in August. The single-family component rose 1.1 percent in September, following a 2.0 percent decline the prior month. Building permits made a comeback, too. Permits increased 1.5 percent in September, following a 5.1 percent drop in August. September permits were up 2.5 percent on a year-ago basis.
Housing starts Consensus Forecast for October 14: 1.028 million-unit rate
Range: 0.979 million to 1.100 million-unit rate
Housing permits Consensus Forecast for October 14: 1.035 million-unit rate
Range: 1.005 million to 1.105 million-unit rate
The Minutes of the October 28-29 FOMC meeting are scheduled for release at 2:00 p.m. ET.
The October 28-29 FOMC meeting ended quantitative easing—long-term bond purchases. The question now is whether are additional hints on when policy rates might rise in 2015.
The consumer price index for September came in soft although the headline number was marginally above forecasts. Overall consumer prices in September firmed 0.1 percent after falling 0.2 percent in August. Market expectations were for no change. Excluding food and energy, the CPI also nudged up 0.1 percent, following no change in August. The consensus was for a 0.1 percent increase in September. Energy slipped 0.7 percent, following a drop of 2.6 percent in August. Gasoline declined 1.0 percent, following a 4.1 percent drop in August. Food price inflation gained 0.3 percent after posting a 0.2 percent gain in August. The index for all items less food and energy increased 0.1 percent in September. Along with the shelter index, the index for medical care increased, and the indexes for alcoholic beverages and for personal care advanced slightly. Several indexes were unchanged, and the indexes for airline fares and for used cars and trucks declined in September. On a seasonally adjusted basis, the headline CPI was up year-ago 1.7 percent in September—matching August. Excluding food and energy, the year-ago pace was 1.7 percent, also equaling the August pace.
CPI Consensus Forecast for October 14 -0.1 percent
Range: -0.3 to 0.0 percent
CPI ex food & energy Consensus Forecast for October 14: +0.1 percent
Range: +0.1 to +0.3 percent
Initial jobless claims remain at a low level but did rise in the November 8 week, up 12,000 to 290,000 which was the highest reading in 7 weeks. The 4-week average also rose, up 6,000 to 285,000 which is the highest in 5 weeks. Nonetheless, the latest reading is relatively low.
Jobless Claims Consensus Forecast for 11/15/14: 284,000
Range: 265,000 to 295,000
The PMI manufacturing index (final) for October was a soft month for Markit's US manufacturing sample where the composite index slowed to 55.9, down from 56.2 at mid-month and down sizably from 57.5 in final September. The comparison with September points to slowing growth for October's manufacturing activity. Weighing the most on the composite was the most important reading of all, in new business where monthly growth slowed to its lowest rate since the severe weather of this year's January. The report cited especially soft growth in export sales and noted the slowest increase in total backlog orders since January.
Markit PMI manufacturing flash index Consensus Forecast for November 14: 56.5
Range: 55.0 to 57.0
Existing home sales rose a solid 2.4 percent in September to a higher-than-expected annual rate of 5.17 million. This followed a dip of 1.8 percent in August. Year-on-year, however, sales remained flat at minus 1.7 percent. Condo sales were the strongest in the month, up 5.2 percent to a 0.610 million rate with sales of single-family homes showing less growth, up 2.0 percent to a 4.56 million rate. Year-on-year, condo sales show no change with single-family homes at minus 1.9 percent.
Existing home sales Consensus Forecast for October 14: 5.15 million-unit rate
Range: 5.01 to 5.25 million-unit rate
The general business conditions index of the Philadelphia Fed's Business Outlook Survey held pretty much steady in October, at a very strong 20.7 versus September's 22.5. The new orders index, which is by far the most important reading in the report, was actually up, to 17.3 versus 15.5. Unfilled orders were also very positive, from 5.0 in September to 11.6 which is very strong for this reading, in fact the strongest reading since July 2004.
Philadelphia Fed survey Consensus Forecast for November 14: 18.0
Range: 13.0 to 25.8
The Conference Board's index of leading indicators rose an outsized 0.8 percent in September against an easy August comparison when the index was unchanged. Low interest rates were the major factor contributing to the strength which was very broad based with only one of the 10 components, consumer expectations, in the negative column. The interest rate component had a 0.27 percentage point contribution to the index; lending credit, 0.11 percentage points; initial jobless claims, 0.09 percentage points; and ISM new orders, 0.09 percentage points among the most positive components.
Leading indicators Consensus Forecast for October 14: +0.5 percent
Range: +0.2 to +0.7 percent
The Kansas City Fed manufacturing index grew at a modest pace in October, and producers' optimism for future activity remained solid. The month-over-month composite index was 4 in October, down from 6 in September but slightly higher than 3 in August. The composite index is an average of the production, new orders, employment, supplier delivery time, and raw materials inventory indexes. Most other month-over-month indexes were also lower than last month. The production index fell from 12 to 3, and the shipments, new orders, and employment indexes also moved lower. The new orders for exports index decreased from minus 1 to minus 9, and the order backlog index posted its lowest level in over a year.
Kansas City Fed manufacturing index Consensus Forecast for November 14: 6
Range: 4 to 7
R. Mark Rogers is the author of The Complete Idiot's Guide to Economic Indicators, Penguin Books.
He can also be found on a weekly broadcast talking about the U.S. economy, the easiest way to find him is by going to iTunes and searching for "Simply Economics."
Econoday Senior Writer Mark Pender contributed to this article.
|
