|
There are signs that the consumer sector is slowly gaining momentum and helping to consolidate the recovery. But weak inflation may be a concern for the Fed. However, oil prices and international issues are weighing on equities.
 Equities took a sharp hit this past week for a variety of reasons—including sluggish growth abroad and a continued plunge in oil prices. However, other than high oil shale production resulting in low oil prices, the U.S. economy generally was not to blame for lower stock prices. Equities took a sharp hit this past week for a variety of reasons—including sluggish growth abroad and a continued plunge in oil prices. However, other than high oil shale production resulting in low oil prices, the U.S. economy generally was not to blame for lower stock prices.
 At the start of the week, stocks retreated, pressured by steepening declines in oil prices and signs of economic weakness in Europe and Japan—notably disappointing Japanese GDP and Chinese merchandise trade data and after a top official at the European Central Bank offered a gloomy assessment of the region's economy. Tuesday, the broad market was little changed although techs rebounded after a sizeable drop the day before. Greece unnerved investors after the government brought a presidential vote forward in a political gamble that has raised uncertainty over the country's transition out of its bailout. Apple lifted techs. At the start of the week, stocks retreated, pressured by steepening declines in oil prices and signs of economic weakness in Europe and Japan—notably disappointing Japanese GDP and Chinese merchandise trade data and after a top official at the European Central Bank offered a gloomy assessment of the region's economy. Tuesday, the broad market was little changed although techs rebounded after a sizeable drop the day before. Greece unnerved investors after the government brought a presidential vote forward in a political gamble that has raised uncertainty over the country's transition out of its bailout. Apple lifted techs.
At mid-week, stocks dropped as the energy sector fell along with crude oil prices. The energy sector led stocks down after OPEC cut its forecast on 2015 demand for crude. Equities rebounded somewhat Thursday as retail sales for November posted notably stronger than expected. However, the week ended on a sizeable down note as stocks dropped on a selloff of the oil sector.
Equities were down sharply this past week. The Dow was down 3.8 percent; the S&P 500, down 3.5 percent; the Nasdaq, down 2.7 percent; the Russell 2000, down 2.5 percent; and the Wilshire 5000, down 3.5 percent.
For the year-to-date, major indexes are mostly up as follows: the Dow, up 4.2 percent; the S&P 500, up 8.3 percent; the Nasdaq, up 11.4 percent; and the Wilshire 5000, up 6.6 percent. The Russell 2000 is down 1.0 percent;
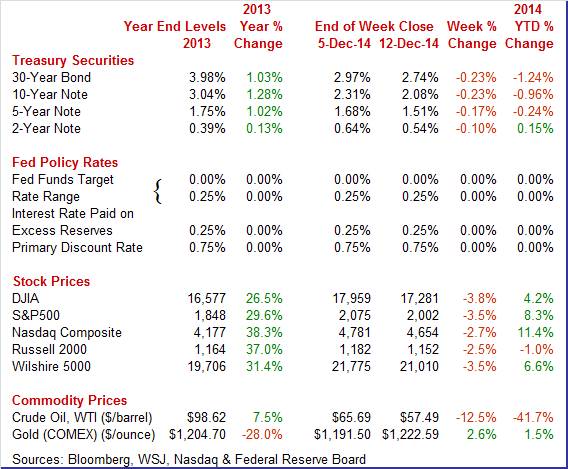
Weekly percent change column reflects percent changes for all components except interest rates. Interest rate changes are reflected in simple differences.
 Treasury yields dropped notably this past week on the plunge in oil prices with this effect weighing in all week. Treasury yields dropped notably this past week on the plunge in oil prices with this effect weighing in all week.
Tuesday, flight to safety nudged rates down as China tightened lending rules and on worries about Greek political stability affecting the country's financial restructuring. Flight to safety continued Wednesday on concern about Greek politics.
Yields firmed modestly on Thursday after a better-than-expected retail sales report. A soft producer price report added to the downdraft on yields on Friday.
Again, the week's sharp drop in oil prices tugged down notably on rates throughout the week.
For this past week Treasury rates were down significantly as follows: the 2-year note, down 10 basis points; the 5-year note, down 17 basis points; the 7-year note, down 21 basis points; the 10-year note, down 23 basis points; and the 30-year bond, down 23 basis points. The 3-month T-bill was unchanged.
 At the start of the week, dropped more than $2-1/2 per barrel on concern that OPEC would not cut production. Spot WTI hit a five year low. After little change Tuesday, WTI fell $2 per barrel Wednesday after OPEC cut its estimate for 2015 demand but gave no indication of reducing production—preferring to try to maintain market share as U.S. oil shale production increases. Also, U.S. inventories were up notably. Thursday, crude declined another $1-1/4 on supply glut concerns and fell below $60 per barrel. On Friday, WTI fell below $58 per barrel after the International Energy Agency cut its global demand forecast. At the start of the week, dropped more than $2-1/2 per barrel on concern that OPEC would not cut production. Spot WTI hit a five year low. After little change Tuesday, WTI fell $2 per barrel Wednesday after OPEC cut its estimate for 2015 demand but gave no indication of reducing production—preferring to try to maintain market share as U.S. oil shale production increases. Also, U.S. inventories were up notably. Thursday, crude declined another $1-1/4 on supply glut concerns and fell below $60 per barrel. On Friday, WTI fell below $58 per barrel after the International Energy Agency cut its global demand forecast.
The current spot price is the lowest since May 2009 during the great recession.
Net for the week, the spot price for West Texas Intermediate plunged $8.20 per barrel to settle at $57.49.
The past week's key numbers came from the consumer sector with retail sales and consumer sentiment surprising on the upside.
 Retail sales in November came in strong despite lower gasoline prices. Retail sales in November posted a 0.7 percent boost after rebounding 0.5 percent in October The headline well topped market expectations for a 0.4 percent rise for November. Autos jumped a notable 1.7 percent after gaining 0.8 percent in October. Excluding autos, sales increased 0.5 percent after rising 0.4 percent in October. Forecasts were for a 0.1 percent boost. Retail sales in November came in strong despite lower gasoline prices. Retail sales in November posted a 0.7 percent boost after rebounding 0.5 percent in October The headline well topped market expectations for a 0.4 percent rise for November. Autos jumped a notable 1.7 percent after gaining 0.8 percent in October. Excluding autos, sales increased 0.5 percent after rising 0.4 percent in October. Forecasts were for a 0.1 percent boost.
 Gasoline station sales fell on lower prices. Sales declined 0.8 percent after a 1.3 percent drop in October. Excluding both autos and gasoline, sales advanced 0.6 percent in November after a 0.7 percent rise the prior month. The median market forecast was for 0.5 percent. Gasoline station sales fell on lower prices. Sales declined 0.8 percent after a 1.3 percent drop in October. Excluding both autos and gasoline, sales advanced 0.6 percent in November after a 0.7 percent rise the prior month. The median market forecast was for 0.5 percent.
Within the core, strength was broad based led by building materials & garden equipment (up 1.4 percent), clothing & accessories (up 1.2 percent), department store sales (up 1.0 percent), and nonstore retailers (up 1.0 percent).
The latest retail sales report is favorable for fourth quarter GDP in the personal consumption component. Currently, the consumer sector is leading the recovery with confidence and spending up. The November retail sales report certainly is more positive than weekly sales numbers. And lower gasoline prices will likely provide some lift to non-gasoline sales with consumers having more discretionary income.
 There is more evidence that the consumer may be adding strength to the recovery. Consumer sentiment is surging this month, to 93.8 for the mid-month December reading versus an already strong 88.8 in final November and 89.4 in mid-month November. This was the strongest reading since January 2007. There is more evidence that the consumer may be adding strength to the recovery. Consumer sentiment is surging this month, to 93.8 for the mid-month December reading versus an already strong 88.8 in final November and 89.4 in mid-month November. This was the strongest reading since January 2007.
The current conditions component was up 3.0 points from final November to 105.7 in a gain that signals month-to-month strength in consumer activity for December. The expectations component, though lagging at 86.1, was up a very sharp 6.2 points to signal rising confidence in the outlook for income and jobs.
The falling price of gasoline is one reason behind the strength in sentiment and is a key factor keeping down inflation expectations which, however, are up in the latest report, at 2.9 percent for the 1-year outlook, 1 tenth higher from final November, and also at 2.9 percent for the 5-year outlook for a 3 tenths gain. Still these inflation readings are tame and further declines in gasoline prices are likely to boost upcoming consumer sentiment numbers.
 The Fed's Labor Market Conditions Index showed softening labor market conditions in November. The index pulls together 19 different labor market indicators. The November index posted at 2.9 versus a revised 3.9 for October. The November number is the lowest since January 2014 and suggests that the Fed will maintain loose monetary policy into 2015. The Fed only occasionally publishes details of the index since it is not an official indicator release but instead a research department number. Fed officials almost certainly get to see the detail and the doves will add this index reading to the low inflation argument for keeping policy rates low. The Fed's Labor Market Conditions Index showed softening labor market conditions in November. The index pulls together 19 different labor market indicators. The November index posted at 2.9 versus a revised 3.9 for October. The November number is the lowest since January 2014 and suggests that the Fed will maintain loose monetary policy into 2015. The Fed only occasionally publishes details of the index since it is not an official indicator release but instead a research department number. Fed officials almost certainly get to see the detail and the doves will add this index reading to the low inflation argument for keeping policy rates low.
The October Job Openings and Labor Turnover Survey showed modest improvement.  There were 4.834 million job openings on the last business day of October, little changed from 4.685 million in September. Hires (5.055 million) and separations (4.824 million) were steady in October. Within separations, the quits rate (1.9 percent) was little changed and the layoffs & discharges rate (1.2 percent) was unchanged. This release includes estimates of the number and rate of job openings, hires, and separations for the nonfarm sector by industry and by four geographic regions. There were 4.834 million job openings on the last business day of October, little changed from 4.685 million in September. Hires (5.055 million) and separations (4.824 million) were steady in October. Within separations, the quits rate (1.9 percent) was little changed and the layoffs & discharges rate (1.2 percent) was unchanged. This release includes estimates of the number and rate of job openings, hires, and separations for the nonfarm sector by industry and by four geographic regions.
While the October numbers were not strong, they were positive and indicate an improving jobs market.
The latest producer price report will keep many Fed officials concerned about inflation being too low.
 Inflation at the producer level eased somewhat in November. The PPI for total final demand declined 0.2 percent after rising 0.2 percent in October. Excluding food and energy, producer price inflation was flat, following a jump of 0.4 percent in October. Inflation at the producer level eased somewhat in November. The PPI for total final demand declined 0.2 percent after rising 0.2 percent in October. Excluding food and energy, producer price inflation was flat, following a jump of 0.4 percent in October.
The index for final demand goods fell 0.7 percent in November, the fifth consecutive decrease. The broad-based November decline was led by prices for final demand energy, which dropped 3.1 percent. The index for final demand goods less foods and energy edged down 0.1 percent, and prices for final demand foods fell 0.2 percent.
 The index for final demand services inched up 0.1 percent in November subsequent to a 0.5-percent rise in October. In November, prices for final demand services less trade, transportation, and warehousing, as well as margins for final demand trade services, rose 0.1 percent. (Trade indexes measure changes in margins received by wholesalers and retailers.) In contrast, the index for final demand transportation and warehousing services dropped 0.8 percent. The index for final demand services inched up 0.1 percent in November subsequent to a 0.5-percent rise in October. In November, prices for final demand services less trade, transportation, and warehousing, as well as margins for final demand trade services, rose 0.1 percent. (Trade indexes measure changes in margins received by wholesalers and retailers.) In contrast, the index for final demand transportation and warehousing services dropped 0.8 percent.
On a seasonally adjusted year-ago basis, PPI final demand was up 1.4 percent, compared to 1.5 percent in October. Excluding food & energy, PPI final demand was up 1.7 percent versus 1.8 percent the month before.
Overall, there is little inflation pressure at the producer level—and, again, the Fed doves will be pointing to weak inflation during the December 16-17 FOMC meeting as a reason to keep policy loose.
 Cross-border price pressures are nowhere to be found in the import & export price report where import prices dropped 1.5 percent in November, the 5th straight drop and the steepest since June 2012, and export prices fell 1.0 percent for the 4th straight drop and matching the steepest drop since June 2012. Cross-border price pressures are nowhere to be found in the import & export price report where import prices dropped 1.5 percent in November, the 5th straight drop and the steepest since June 2012, and export prices fell 1.0 percent for the 4th straight drop and matching the steepest drop since June 2012.
The year-on-year rate for import prices is at minus 2.3, the steepest negative reading since April 2013, with export prices at minus 1.9, the steepest since October 2013.
And it's not just oil-related prices that are falling. Excluding petroleum, import prices fell 0.3 percent in the month for a 4th straight drop and the steepest since April this year while export prices, excluding both food and fuels for this reading, fell 0.5 percent for a third straight drop.
The year-on-year reading for ex-petroleum import prices is at only plus 0.1 percent with ex-food & ex-fuel export prices at minus 0.4 percent.
 A look at finished goods shows extended declines for nearly all readings. Prices of imported motor vehicles are down 0.1 percent in the month for a 1.0 percent year-on-year decline while prices of exported consumer goods are down 0.3 percent for both the monthly and year-on-year comparisons. Imported capital goods prices fell a monthly 0.1 percent and on a year-ago basis were down 0.4 percent. A look at finished goods shows extended declines for nearly all readings. Prices of imported motor vehicles are down 0.1 percent in the month for a 1.0 percent year-on-year decline while prices of exported consumer goods are down 0.3 percent for both the monthly and year-on-year comparisons. Imported capital goods prices fell a monthly 0.1 percent and on a year-ago basis were down 0.4 percent.
The strong dollar is an important factor that is keeping import prices down, but it's more than the dollar as evidenced by the export side of the data. Falling oil prices are having a spillover effect throughout the global price picture. Commodity prices in general are down. Slower growth in Europe and Asia as well as the oil glut are contributing to weak import prices. The good news is that soft import prices likely will boost the consumer sector and corporate profits outside of the energy sector.
The consumer sector is showing improvement—especially in sales and confidence. Meanwhile, inflation is running lower than most Fed officials prefer. The debate within the Fed probably is going to be warmer than average at the December 16-17 FOMC meeting.
The two sluggish sectors of the economy—housing and manufacturing—are highlighted this coming week. While the National Association of Home Builders housing market index improved in November, the housing sector still is oscillating around a recent flat trend. This could be a key indicator after pending home sales decreased in October. Housing starts slipped in October but due to the volatile multifamily component which could rebound in November. Industrial production may be regaining modest momentum after slipping in October—largely the utilities component. Production worker hours for manufacturing were healthy in November.
The Empire State manufacturing index in November rose nearly 4 points to 10.16. The new orders index was the highlight of the report, rising to 9.14 from a brief dip into the negative column last month at minus 1.73. Shipments showed a similar gain, to 11.83 from October's very flat plus 1.12. Employment growth was steady, at 8.51 versus 10.23, while the 6-month general conditions outlook rose nearly 6 points 47.61.
Empire State Manufacturing Survey Consensus Forecast for December 14: 12.0
Range: 9.0 to 15.0
Industrial production in October was stronger than indicated by the headline number. Industrial production for October slipped on comedowns in mining and utilities. Industrial production dipped 0.1 percent after jumping 0.8 percent in September. Importantly, manufacturing gained 0.2 percent after rebounding 0.2 percent in September. Mining declined 0.9 percent in October, following a 1.6 percent boost the month before. Utilities slipped 0.7 percent after a monthly 4.2 percent surge in September. Excluding motor vehicles, manufacturing rose 0.2 percent, following a gain of 0.3 percent in September. Overall capacity utilization posted at 78.9 percent in October versus 79.2 percent in September. Looking ahead, production worker hours in manufacturing from the employment report were up 0.5 percent for the month, suggesting a significant increase in the manufacturing component for November industrial production.
Industrial production Consensus Forecast for November 14: +0.7 percent
Range: +0.4 to +1.2 percent
Manufacturing production component Consensus Forecast for November 14: +0.6 percent
Range: +0.3 to +0.9 percent
Capacity utilization Consensus Forecast for November 14: 79.4 percent
Range: 79.0 to 79.9 percent
Ther NAHB housing market index for November was up 4 points to 58 which, outside of September's 59, is the best reading of the year and of the recovery. Gains appear through the three components led by a 5 point gain in current sales to 62 which points to strength for November new home sales. Future sales were up 2 points to 66 with the traffic component, which continues to lag, up 4 points to 45. Regional data show wide gains led this month by the Northeast which is now in positive ground at 51 (readings over 50 indicate month-to-month growth). Housing remains comparatively flat to other sectors of the economy though the latest report does hint at increasing strength.
NAHB housing market index Consensus Forecast for December 14: 59
Range: 56 to 61
FOMC meeting begins
Housing starts in October pointed to an uncertain sector as starts slipped while permits gained. Housing starts numbers continue to oscillate. October weakness was in the multifamily component which swings sharply on a monthly basis. The single-family component may be gaining mild strength. Housing starts declined 2.8 percent after a 7.8 percent spike in September. The 1.009 million unit pace was up 7.8 percent on a year-ago basis. Market expectations were for 1.028 million units. Housing permits, however, showed momentum with a 4.8 percent gain in October after a 2.8 percent boost the month before. The 1.080 million unit pace was up 1.2 percent on a year-ago basis.
Housing starts Consensus Forecast for November 14: 1.038 million-unit rate
Range: 0.999 million to 1.080 million-unit rate
Housing permits Consensus Forecast for November 14: 1.060 million-unit rate
Range: 1.015 million to 1.100 million-unit rate
The Markit PMI manufacturing index (final) slowed in November to a 10-month low of 54.8 from 55.9 in October. The mid-month flash for November was 54.7. Looking at details, output slowed for a 3rd straight month and was also at a 10-month low for this sample. New orders also slowed and were also at a 10-month low with export orders in contraction. A plus in the report was a strong gain for employment, yet whether Markit's sample will continue to hire is uncertain given the slowing in new orders. The Markit November was notably softer than ISM and several regional surveys.
Markit PMI manufacturing flash index Consensus Forecast for December 14: 55.5
Range: 55.0 to 56.2
The consumer price index in October was a flat 0.0 percent after firming 0.1 percent in September. Excluding food and energy, the CPI was warmer, gaining 0.2 percent after nudging up 0.1 percent in September. The consensus was for a 0.1 percent increase in October. Energy fell 1.9 percent after slipping 0.7 percent in September. Gasoline dropped 3.0 percent after declining 1.0 percent the month before. Food price inflation rose 0.1 percent, following a gain of 0.3 percent in September. With crude oil prices down further, the headline CPI will be soft and possibly negative.
CPI Consensus Forecast for November 14 -0.1 percent
Range: -0.3 to +0.1 percent
CPI ex food & energy Consensus Forecast for November 14: +0.1 percent
Range: +0.1 to +0.2 percent
The U.S. current account deficit narrowed to $98.5 billion in the second quarter from a revised $102.1 billion in the first quarter. As a percentage of GDP, the gap slipped to 2.3 percent from the first quarter's 2.4 percent. A big positive in the second-quarter report, which incorporates new methodologies, was a wider surplus on transfers (adding $8.6 billion) and income (adding $0.7 billion). Also a plus was the balance on services (adding $1.1 billion) which helped offset a larger deficit on goods (subtracting $6.8 billion).
Current account Consensus Forecast for Q3 14: -$96.3 billion
Range: -$105.7 billion to -$93.5 billion
The FOMC announcement at 2:00 p.m. ET for the December FOMC policy meeting is expected to unchanged at a range of zero to 0.25 percent. The debate within the Fed likely will focus on the conundrum of a declining unemployment rate and below target inflation. Traders will take note of any changes in guidance for when the first increase in the fed funds rate might occur. Also, the Fed will release its quarterly forecasts at the same time as the statement.
FOMC Consensus Forecast for 12/17/13 policy vote on fed funds target range: unchanged at a range of zero to 0.25 percent
Chair press conference after the FOMC meeting statement is scheduled for 2:30 p.m. ET. Fed Chair Janet Yellen conducts a press conference after FOMC meetings in which participants present their quarterly economic forecasts. Yellen is expected to comment on the forecast and take Q&A.
Initial jobless claims fell 3,000 in the December 6 week to 294,000 but the 4-week average, up slightly to 299,250, was still about 15,000 higher than in early November. Continuing claims tell the same story, up a steep 142,000 to 2.514 million in lagging data for the November 29 week. This was the highest level since mid-August. The 4-week average, up 28,000 to 2.386 million, was also up about 15,000 versus the month-ago comparison.
Jobless Claims Consensus Forecast for 12/13/14: 295,000
Range: 288,000 to 300,000
The Markit PMI services index in November reported a 5th straight month of slowing growth from June's recovery peak, at a composite index of 56.2 versus 56.3 at mid-month and a final 57.1 in October. Readings on new business and output have moderated for 7 straight months. A positive was a 5-month high in hiring and a 5-month high in the business outlook.
Markit PMI services index (flash) Consensus Forecast for December 14: 57.3
Range: 56.5 to 57.7
The general business conditions index of the Philadelphia Fed's Business Outlook Survey
surged to 40.8 in November, almost doubling October's very strong growth of 20.7. The gain is backed by new orders which are at 35.7 versus October's 17.3. Shipments are at 31.9 vs 16.6 with employment nearly doubling, to 22.4 versus 12.1. November's numbers are total standouts for this report which goes back nearly 50 years. And despite the surge in demand, price pressures, due to falling oil prices, are easing. Inventories look lean and delivery times are up, two other indications of general strength.
Philadelphia Fed survey Consensus Forecast for December 14: 25.0
Range: 20.0 to 36.0
The Conference Board's index of leading indicators rose a very strong 0.9 percent in October pointing to near term acceleration in economic growth. The largest positive was once again in interest rates which reflect the Fed's near zero rate policy. Low unemployment claims were a strong contributor as were housing permits. The stock market was the only negative in the report but here strength may rebound given gains so far in November. The leading index is running on the warm side but does underscore some of the economy's key pluses going into year-end and the New Year.
Leading indicators Consensus Forecast for November 14: +0.6 percent
Range: +0.3 to +0.7 percent
Quadruple Witching
The Kansas City Fed manufacturing index expanded at a slightly faster pace in November, and producers' expectations for future activity increased further. The month-over-month composite index was 7 in November, up from 4 in October and 6 in September. The production index rose from 3 to 9, and the shipments, employment, and new orders for exports indexes also increased. Firms reported rising difficulties in attracting and retaining certain key workers, and several contacts cited increased labor costs. Price indexes were mixed with little change overall.
Kansas City Fed manufacturing index Consensus Forecast for December 14: 8
Range: 6 to 9
R. Mark Rogers is the author of The Complete Idiot's Guide to Economic Indicators, Penguin Books.
He can also be found on a weekly broadcast talking about the U.S. economy, the easiest way to find him is by going to iTunes and searching for "Simply Economics."
Econoday Senior Writer Mark Pender contributed to this article.
|
