|
The 2014 year has ended. The year was moderately good for the economy and equities. The latest week's economics and financial news were very mixed. But equities were in thin holiday trading. However, there were notable changes in some markets—especially bonds and oil.
 Equities ended the year with generally positive numbers despite downdraft the last week of the year and start of the year. Equities ended the year with generally positive numbers despite downdraft the last week of the year and start of the year.
Stocks were mixed at the start of this past week. Biotechnology shares rebounded for a third consecutive day. Energy companies advanced despite a drop in crude prices. Tuesday, stocks dipped after consumer confidence was not as strong as estimated (though still healthy).
 On Wednesday, the last trading day of 2014, equities dropped notably in thin trading. Initial jobless claims came in higher than forecast offsetting slightly higher than expected pending home sales. After the Thursday New Year's Day holiday, stocks on Friday were essentially unchanged for the day. On Wednesday, the last trading day of 2014, equities dropped notably in thin trading. Initial jobless claims came in higher than forecast offsetting slightly higher than expected pending home sales. After the Thursday New Year's Day holiday, stocks on Friday were essentially unchanged for the day.
Overall, U.S. equities in 2014 were moderately favorable and outperformed most others geographically. Economic growth was moderately healthy and corporate profits were reasonably healthy on average.
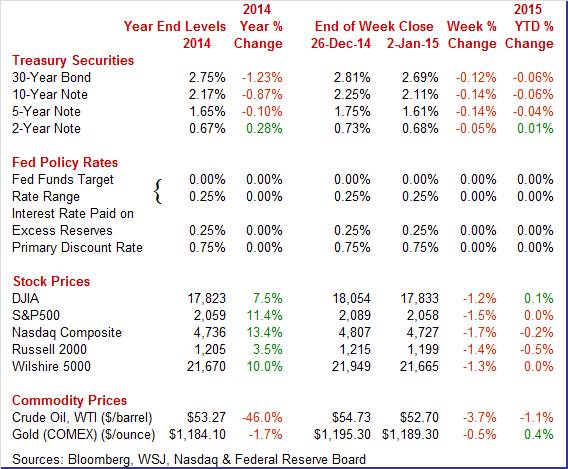
 Equities were down this past week. The Dow was down 1.2 percent; the S&P 500, down 1.5 percent; the Nasdaq, down 1.7 percent; the Russell 2000, down 1.4 percent; and the Wilshire 5000, down 1.3 percent. Equities were down this past week. The Dow was down 1.2 percent; the S&P 500, down 1.5 percent; the Nasdaq, down 1.7 percent; the Russell 2000, down 1.4 percent; and the Wilshire 5000, down 1.3 percent.
For the year-to-date (January 2 from December 31), major indexes are mixed as follows: the Dow, up 0.1 percent; the S&P 500, flat; the Nasdaq, down 0.2 percent; the Russell 2000, down 0.5 percent; and the Wilshire 5000, flat.
 For December, major indexes were mixed as follows: the Dow, flat; the S&P 500, down 0.4 percent; the Nasdaq, down 1.2 percent; the Russell 2000, up 2.7 percent; and the Wilshire 5000, down 0.3 percent. For December, major indexes were mixed as follows: the Dow, flat; the S&P 500, down 0.4 percent; the Nasdaq, down 1.2 percent; the Russell 2000, up 2.7 percent; and the Wilshire 5000, down 0.3 percent.
But for the past year, equities may not have been stellar but they generally did well. For end of year 2013 to end of year 2014, major indexes were up as follows: the Dow, up 7.5 percent; the S&P 500, up 11.4 percent; the Nasdaq, up 13.4 percent; the Russell 2000, up 3.5 percent; and the Wilshire 5000, up 10.0 percent. Apparently, the Fed achieved its goal in 2014 of boosting asset prices. Traders and investors shifted to riskier assets as bond yields remained low. A growing U.S. economy suggests that equities may be the best return in 2015.
Weekly percent change column reflects percent changes for all components except interest rates. Interest rate changes are reflected in simple differences.
 Treasury rates fell notably this past week. Yields declined moderately Monday on flight to safety on political turmoil in Greece. Rates nudged down Tuesday on continued reaction to political disarray in Greece. Treasury rates fell notably this past week. Yields declined moderately Monday on flight to safety on political turmoil in Greece. Rates nudged down Tuesday on continued reaction to political disarray in Greece.
Yields eased modestly on Wednesday on a rise in initial jobless claims. After the New Year's Day holiday, rates dipped on a lower-than-expected ISM manufacturing index and a drop in construction spending.
 For this past week Treasury rates were down as follows: the 2-year note, down 5 basis points; the 5-year note, down 14 basis points; the 7-year note, down 15 basis points; the 10-year note, down 14 basis points; and the 30-year bond, down 12 basis points. The 3-month T-bill firmed 2 basis points. For this past week Treasury rates were down as follows: the 2-year note, down 5 basis points; the 5-year note, down 14 basis points; the 7-year note, down 15 basis points; the 10-year note, down 14 basis points; and the 30-year bond, down 12 basis points. The 3-month T-bill firmed 2 basis points.
Over the past year, rate movements have been mixed. Long rates have come down on lower inflation expectations and weaker global growth. The 2-year note yield has risen, although slowly, on expectations of the Fed reducing near-term monetary ease.
 The spot price of West Texas Intermediate continued to decline this past week. The only notable daily moves were Monday, Wednesday and Friday. Crude fell a dollar a barrel Monday on a rise in the dollar. On Wednesday, WTI slipped half a dollar on news that OPEC continued to exceed its quota. On Friday, WTI dipped half a dollar and to the lowest in more than five and a half years. This was due to increased supply from Russia and Iraq and also due to slowing manufacturing in Europe and Asia. The spot price of West Texas Intermediate continued to decline this past week. The only notable daily moves were Monday, Wednesday and Friday. Crude fell a dollar a barrel Monday on a rise in the dollar. On Wednesday, WTI slipped half a dollar on news that OPEC continued to exceed its quota. On Friday, WTI dipped half a dollar and to the lowest in more than five and a half years. This was due to increased supply from Russia and Iraq and also due to slowing manufacturing in Europe and Asia.
Net for the week, the spot price for West Texas Intermediate dropped $2.03 per barrel to settle at $52.70.
For the last several months WTI has been under heavy downward pressure from global supply—including from the Middle East, Russia, and now from U.S. oil shale production. Also, demand has softened in Europe and Asia. For the year 2014, crude dropped 46.0 percent with recent highs over $100 per barrel.
The economy ended 2014 mixed. Both construction and manufacturing were uncertain but the consumer sector appeared to be improving.
 Pending home sales picked up steam in November, to 104.8 from a revised 104.0 in October for a better-than-expected gain of 0.8 percent Pending home sales picked up steam in November, to 104.8 from a revised 104.0 in October for a better-than-expected gain of 0.8 percent
The regional breakdown showed only narrow differences in the month with small gains in the Northeast, South, and West and a small decline in the Midwest. Final sales of existing homes stalled out in November but the latest report points to strength for the coming existing sales reports on December and January. The caveat, as always, is that pending home sales do not always follow through.
 Home prices rose notably in October but following soft data in earlier months. So, the big question is what is the trend' That is uncertain but on average still looks soft. Home prices rose notably in October but following soft data in earlier months. So, the big question is what is the trend' That is uncertain but on average still looks soft.
Case-Shiller's 20 city year-on-year index for October (both adjusted and unadjusted) came in soft as expected, at plus 4.5 percent, down 3 tenths from September. This is the lowest rate since October 2012 and follows a full year of low double digit gains through much of 2013 and into April this year.
But the month-to-month adjusted reading is positive, showing a very strong 0.8 percent adjusted gain led by continued strength in Atlanta and including big gains for San Francisco, Tampa and Denver. Unadjusted, however, the monthly change falls to minus 0.1 percent for a second straight month.
Though unadjusted data are closely followed in this report, the adjusted monthly gain is big and hints at a shift higher ahead for the year-to-year rate. Next report on housing will be tomorrow with the pending home sales index.
 The construction section was mixed in the latest report. The construction section was mixed in the latest report.
Construction outlays slipped 0.3 percent in November after a sharp 1.2 percent rebound in October.
November's decrease was led by public outlays which fell 1.7 percent after a 2.8 percent jump in October. Private residential spending rose 0.9 percent, matching the pace the month before. Private nonresidential construction spending dipped 0.3 percent in November after edging up 0.1 percent in October.
On a year-ago basis, total outlays were up 2.4 percent in November compared to 4.0 percent in October.
The construction sector is slowing, tugging down on fourth quarter GDP. However, there are positive signs for private residential and nonresidential activity.
 The consumer sector appears to be ending year on a strong note and providing forward momentum going into 2015. The consumer sector appears to be ending year on a strong note and providing forward momentum going into 2015.
Consumer confidence is strong especially in the assessment of current conditions which offers an indication of monthly strength for December consumer activity. The consumer confidence index rose 1.6 points to 92.6 which, outside of October's 94.4, is the strongest reading of the recovery. November's index is revised 2.3 points higher to 91.0.
The current conditions component of the index is up 5.1 points to 98.6, a convincing gain and a recovery best. The jobs-hard-to-get subcomponent shows special strength, at 27.7 percent vs November's 28.7 percent in an improvement that will lift expectations for strength in the December employment report.
Showing less punch is the expectations component which fell 8 tenths to 88.5. Weakness here, in contrast to the strength of the current jobs assessment, reflects pessimism in the jobs outlook where 16.9 percent see fewer jobs ahead vs 14.7 percent who see more opening up. Inflation expectations are steady at 5.1 percent which is soft for this reading and reflects price declines underway at the gas pump.
 Manufacturing appears to be sluggish at year end. Manufacturing appears to be sluggish at year end.
The ISM report had been running hot compared to many other measures of the manufacturing sector which should help limit the impact from the slowdown in the latest report. The ISM composite index came in at 55.5, down a sizable 3.2 points from November for the slowest rate of monthly growth in six months.
Growth in new orders slowed substantially, to 57.3 from November's exceptionally strong 66.0, while backlog accumulation also slowed, to 52.5 from 55.0. Production slowed to 58.8 vs 64.4.
Turning to the latest Markit PMI report, slowing growth is the signal where the final composite score came in at 53.9, down from November's 54.8. The flash reading for December was 53.7. New business gains and output both slowed in the month which respondents tied to uncertainty over the global economic outlook. Export orders did rise but weak demand was noted in the euro area and emerging markets. The news on hiring is downbeat with growth the slowest since July.
 On the positive side for December, Texas factory activity increased. The production index, a key measure of state manufacturing conditions, rose strongly from 6 to 15.8, indicating output grew at a faster pace in December. On the positive side for December, Texas factory activity increased. The production index, a key measure of state manufacturing conditions, rose strongly from 6 to 15.8, indicating output grew at a faster pace in December.
Other measures of current manufacturing activity reflected continued growth during the month. The capacity utilization index rose from 9.8 to 12.4, due to a higher share of respondents noting an increase in December than in November. The shipments index climbed to 19.6, its highest reading in five months. The new orders index moved down from 5.6 to 1.3, suggesting moderating demand growth, but more than a quarter of firms noted increases in new orders over November levels.
Perceptions of broader economic conditions remained positive this month. The general business activity index fell from 10.5 to 4.1. The company outlook index was almost unchanged at 8.4, with 21 percent of respondents noting an improved outlook.
Expectations regarding future business conditions remained optimistic in December. The index of future general business activity fell from 18.3 to 13.9, while the index of future company outlook edged up to 24.1. Indexes for future manufacturing activity moved down in December but remained in solidly positive territory.
The U.S. economy is still showing positive growth on average despite oscillations in manufacturing and housing. The consumer sector has gained traction. And the Fed's easy monetary policy has made equities attractive—along with generally favorable corporate earnings.
The consumer sector is the focus this coming week with the highlight being the employment situation report for December, released on Friday. Payroll jobs for November came in stronger than expected, jobless claims have been low recently, so the question is whether job growth remains relatively robust. On the other hand, wage growth has been sluggish and traders will be looking for stronger growth. On the spending side, motor vehicle sales jumped in November and markets get to see on Monday whether this continues in December.
Sales of total light motor vehicles rose a strong 4.5 percent in November to a 17.2 million unit annual rate which was above the top end of the Econoday consensus for 17.0 million. Sales of North American-made vehicles proved especially strong, at a 14.0 million rate which is also outside the top-end forecast. Sales of foreign-made vehicles rose to a 3.3 million rate from 3.2 million.
Motor vehicle domestic sales Consensus Forecast for December 14: 13.8 million-unit rate
Range: 13.5 to 14.5 million-unit rate
Motor vehicle total sales Consensus Forecast for December 14: 16.9 million-unit rate
Range: 16.7 to 17.3 million-unit rate
The Markit PMI services flash index reported abrupt slowing in growth in early December, to 53.6 versus 56.2 in the final November reading and 56.3 in the mid-month November reading. December's flash was the lowest reading since the heavy weather of February. Growth in this sample peaked in June and has been slowing the past 6 months, underscored by further moderation this month in new business.
Markit PMI services index (final) Consensus Forecast for December 14: 53.6
Range: 53.0 to 56.4
Factory orders in October surprised somewhat on the downside but with weakness coming from nondurables-almost certainly from lower oil prices. Overall factory orders slipped 0.7 percent after declining 0.5 percent in September. The durables component rose 0.3 percent compared to the original estimate of 0.4 percent and versus a drop of 0.7 percent in September. Nondurables orders fell 1.5 percent in October, following a 0.2 percent dip the month before.
Factory orders Consensus Forecast for November 14: -0.6 percent
Range: -1.4 to +1.8 percent
The composite index from the ISM non-manufacturing survey for November reported very solid conditions, at a composite 59.3 versus 57.1 in October. Aside from August's 59.6, November was a recovery high going back more than 9 years. New orders were very strong, up 2.3 points in the month to 61.4 with backlog orders up 4.0 points to 55.5 in a reading last matched in April 2011.
ISM non-manufacturing composite index Consensus Forecast for December 14: 58.0
Range: 57.0 to 59.0
ADP private payroll employment for November was 208,000 versus the Econoday consensus for 225,000 and the comparable BLS number November of 314,000.
ADP private payrolls Consensus Forecast for December 14: 235,000
Range: 205,000 to 310,000
The U.S. international trade gap in October narrowed to a disappointing $43.4 billion from a revised $43.6 billion in September. Analysts expected the deficit to narrow to $41 billion. Exports were up 1.2 percent after sliding 1.8 percent the month before while imports added 0.9 percent after recording no change. The October petroleum goods trade gap was $15.2 billion, up from $14.0 billion in September. Petroleum imports were down 0.6 percent while exports sank 11.1 percent. The changes in petroleum no doubt reflect the drop in crude oil prices. The October decline in the goods and services deficit reflected a decrease in the goods deficit of less than $0.1 billion to $62.7 billion and an increase in the services surplus of $0.1 billion to $19.2 billion. Year-to-date, the goods and services deficit increased 5.1 percent from the same period in 2013. Exports increased 3.1 percent. Imports increased 3.4 percent.
International trade balance Consensus Forecast for November 14: -$41.5 billion
Range: -$43.9 billion to -$40.5 billion
Initial jobless claims during holidays are often wildcards for weekly data, a fact that will limit the effect of a sharp 17,000 rise in initial jobless claims in the December 27 week to 298,000. Despite the jump, the 4-week average held steady, up only fractionally to a 290,750 level that is still trending about 10,000 lower than a month ago in a comparison that points to strength for the monthly employment report. Continuing claims, which are reported with a 1-week lag, showed improvement in the December 20 week, down 53,000 to 2.353 million. The 4-week average fell 5,000 to 2.414 million.
Jobless Claims Consensus Forecast for 1/3/15: 290,000
Range: 280,000 to 297,000
Consumer credit outstanding rose $13.2 billion in October but once again, to the disappointment of retailers, the gain was centered in non-revolving credit which rose $12.3 billion on the usual mix between auto financing and the government's acquisition of student loans from private lenders. Revolving credit rose only $0.9 billion in the month, down from what was a soft $1.4 billion gain in September. Slow growth in income continues to hold down the consumer's willingness to shop on credit.
Consumer credit Consensus Forecast for November 14: +$15.0 billion
Range: +$13.1 billion to +$18.5 billion
Nonfarm payroll employment in November jumped 321,000 after gaining 243,000 in October. Analysts expected a 230,000 rise and the November boost topped the Econoday high forecast for 275,000. The November boost was the largest since January 2012. September and October gains were revised up notably by a net 44,000. The unemployment rate held steady at 5.8 percent. The U-6 underemployment rate nudged down to 11.4 percent from 11.5 percent in September. The participation rate held roughly steady at 62.8 percent. Going back to the payroll report, private payrolls advanced 314,000 after increasing 236,000 in October. Analysts projected 225,000. Wages rose sharply in the latest month. Average hourly earnings jumped 0.4 percent in November after edging up 0.1 percent the month before. Expectations were for a 0.2 percent rise. On a year-ago basis, wage growth held steady at a still soft 2.2 percent. Average weekly hours edged up to 34.6 hours from 34.5 hours in October. Analysts expected 34.6 hours.
Nonfarm payrolls Consensus Forecast for December 14: 245,000
Range: 202,000 to 305,000
Private payrolls Consensus Forecast for December 14: 238,000
Range: 190,000 to 295,000
Unemployment rate Consensus Forecast for December 14: 5.7 percent
Range: 5.6 to 5.8 percent
Average workweek Consensus Forecast for December 14: 34.6 hours
Range: 34.5 to 34.6 hours
Average hourly earnings Consensus Forecast for December 14: +0.2 percent
Range: 0.0 to +0.3 percent
Wholesale inventories held steady in October, up 0.4 percent versus a 0.2 rise in sales that left the stock-to-sales ratio unchanged for a third month at a lean and healthy 1.19. Details showed noticeable draws relative to sales for computer equipment, farm products, chemicals and furniture. Builds relative to sales are hard to find but do include drugs and miscellaneous nondurable goods.
Wholesale inventories Consensus Forecast for November 14: +0.3 percent
Range: -0.3 to +0.7 percent
R. Mark Rogers is the author of The Complete Idiot's Guide to Economic Indicators, Penguin Books.
He can also be found on a weekly broadcast talking about the U.S. economy, the easiest way to find him is by going to iTunes and searching for "Simply Economics."
Econoday Senior Writer Mark Pender contributed to this article.
|
