|
Many pundits saw the December employment report as very positive. But traders looked at the details and saw less than stellar results.
 Equities swung sharply this past week on a daily basis and ended the week moderately down. Equities swung sharply this past week on a daily basis and ended the week moderately down.
At the start of the week, stocks fell sharply in the wake of declining crude prices and concerns that economic problems elsewhere in the world could hurt US growth. A renewed slide in oil prices sent energy shares sharply lower. The political situation in Greece also added uncertainty. The slide continued Tuesday as the S&P 500 fell for a fifth consecutive day. Weakness in oil prices and concern about Greece's political future ahead of general elections later this month pulled down equities.
 At mid-week, it was a different story with stocks rebounding sharply after a five-day selloff. Strong numbers from the ADP private employment report helped lift stocks. Also, Fed FOMC minutes affirmed the likelihood of a yet-to-come and slow rise in policy rates—with the suggestion that the first hike will not be for at least two FOMC meetings. The rebound gained momentum Thursday with gains combined with Wednesday offsetting losses on Monday and Tuesday. Thursday's decline in weekly jobless claims reassured investors that the employment situation report for the next day in the U.S. would underline the positive growth in the economy. At mid-week, it was a different story with stocks rebounding sharply after a five-day selloff. Strong numbers from the ADP private employment report helped lift stocks. Also, Fed FOMC minutes affirmed the likelihood of a yet-to-come and slow rise in policy rates—with the suggestion that the first hike will not be for at least two FOMC meetings. The rebound gained momentum Thursday with gains combined with Wednesday offsetting losses on Monday and Tuesday. Thursday's decline in weekly jobless claims reassured investors that the employment situation report for the next day in the U.S. would underline the positive growth in the economy.
Stocks declined Friday on a variety of issues. Worries about global growth resurfaced, the strong dollar was considered a threat to U.S. exports, there was uncertainty about ECB monetary policy, and U.S. wage growth came in negative for December (offsetting higher-than-expected payroll jobs growth).
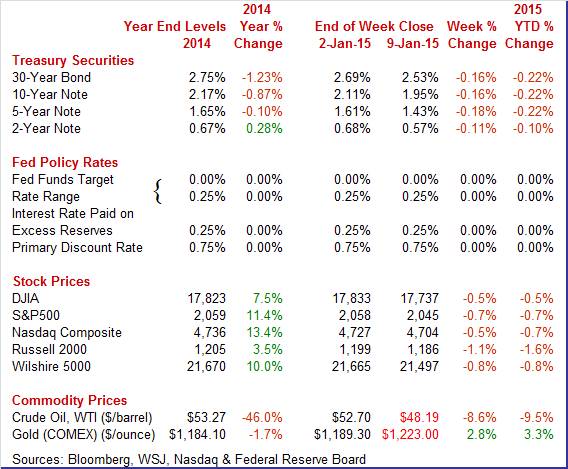
Equities were down this past week. The Dow was down 0.5 percent; the S&P 500, down 0.7 percent; the Nasdaq, down 0.7 percent; the Russell 2000, down 1.1 percent; and the Wilshire 5000, down 0.8 percent.
For the year-to-date, major indexes are down as follows: the Dow, down 0.5 percent; the S&P 500, down 0.7 percent; the Nasdaq, down 0.7 percent; the Russell 2000, down 1.6 percent; and the Wilshire 5000, down 1.6 percent.
Weekly percent change column reflects percent changes for all components except interest rates. Interest rate changes are reflected in simple differences.
 Treasury rates declined notably this past week. On Monday rates declined on the view that global inflation is declining on lower oil prices and softening demand. A stronger dollar added to the dip in yields. The drop in rates continued Tuesday partially due to a slowing in ISM non-manufacturing. Lower oil prices also tugged down on global inflation expectations. Treasury rates declined notably this past week. On Monday rates declined on the view that global inflation is declining on lower oil prices and softening demand. A stronger dollar added to the dip in yields. The drop in rates continued Tuesday partially due to a slowing in ISM non-manufacturing. Lower oil prices also tugged down on global inflation expectations.
The decline in rates took a break Wednesday with little change even though ADP private employment came in stronger than expected. Fed minutes were offsetting as traders interpreted the report to indicate continued Fed ease. Rates firmed modestly Thursday after initial jobless claims edged down, suggesting continuing improvement in the labor market. Yields dipped at the end of the week despite better- than-expected payroll job growth. Traders focused on a decline in wage growth which indicated a possible delay in Fed tightening.
For this past week Treasury rates were down as follows: the 2-year note, down 11 basis points; the 5-year note, down 18 basis points; the 7-year note, down 19 basis points; the 10-year note, down 16 basis points; and the 30-year bond, down 16 basis points. The 3-month T-bill was unchanged.
 The price of crude oil continued to fall sharply this week. After little change Monday, the spot price of West Texas Intermediate fell almost $2-1/2 per barrel on worries about a supply glut. The roughly $48 per barrel was the lowest in 5-1/2 years. At mid-week, WTI rebounded just over $3 per barrel from increased production demand. After essentially no change Thursday, crude dropped just under $3 per barrel Friday after OPEC officials indicated that OPEC members would not cut output. The week ended with spot WTI at a 5-1/2 year low. The price of crude oil continued to fall sharply this week. After little change Monday, the spot price of West Texas Intermediate fell almost $2-1/2 per barrel on worries about a supply glut. The roughly $48 per barrel was the lowest in 5-1/2 years. At mid-week, WTI rebounded just over $3 per barrel from increased production demand. After essentially no change Thursday, crude dropped just under $3 per barrel Friday after OPEC officials indicated that OPEC members would not cut output. The week ended with spot WTI at a 5-1/2 year low.
Net for the week, the spot price for West Texas Intermediate dropped $4.51 per barrel to settle at $48.19.
"First Friday" on the employment report came on second Friday this month due to technicalities of when the report is released. The employment news got the most attention as it was seen as having the most impact on possible changes in Fed policy.
 The December employment situation was somewhat stronger than expected at the headline level but the payroll numbers softened. In terms of actual numbers, the report was mixed. The December employment situation was somewhat stronger than expected at the headline level but the payroll numbers softened. In terms of actual numbers, the report was mixed.
 Payroll jobs advanced 252,000 after jumping a revised 353,000 in November. Analysts projected a 245,000 gain. October and November were revised up notably by a net 50,000. The unemployment rate decreased to 5.6 percent from 5.8 percent in November. Expectations were for 5.7 percent. Wages actually fell back for the latest month. Payroll jobs advanced 252,000 after jumping a revised 353,000 in November. Analysts projected a 245,000 gain. October and November were revised up notably by a net 50,000. The unemployment rate decreased to 5.6 percent from 5.8 percent in November. Expectations were for 5.7 percent. Wages actually fell back for the latest month.
Going back to the payroll report, private payrolls increased 240,000 after rising 345,000 in November. Expectations were for 238,000.
Goods-producing jobs jumped in December, led by construction which advanced 67,000 in December after a 20,000 increase the month before. Manufacturing employment increased 17,000, following a jump of 29,000 in November. Mining rose 3,000 in December, following a 1,000 boost the prior month.
Private service-providing jobs gained 173,000 after a 294,000 jump in October. The latest increase was led by professional & business services. Government jobs increased 12,000 after rising 8,000 in November.
Average hourly earnings slipped 0.2 percent in December after gaining 0.2 percent the prior month. Expectations were for a 0.2 percent rise. On a year-ago basis, wage growth slowed to 1.6 percent in December from 2.2 percent in November. Average weekly hours were unchanged at 34.6 hours and matched expectations.
Looking at the broader underemployment measure from the household survey, the U-6 measure eased to 11.2 percent from 11.4 percent in November. Also from the household survey, the participation rate slipped to 62.7 percent from 62.9 percent in November.
 Looking ahead to the personal income report, from the payroll survey, private aggregate weekly earnings unchanged in December, indicating sluggish private wages & salaries for the month. Production worker hours in manufacturing were up 0.3 for the month, suggesting a moderate rise in the manufacturing component for December industrial production. Looking ahead to the personal income report, from the payroll survey, private aggregate weekly earnings unchanged in December, indicating sluggish private wages & salaries for the month. Production worker hours in manufacturing were up 0.3 for the month, suggesting a moderate rise in the manufacturing component for December industrial production.
The December jobs report was mixed. Payroll gains beat expectations but slowed from November. Wage growth softened. The unemployment rate dipped but partially on a lower participation rate. Still, the labor market is showing overall improvement. However, the latest numbers will only increase debate within the Fed on just how strong or soft the labor market really is. Discussion likely will be between data on overall jobs and the unemployment rate versus soft wages. Most within the FOMC are focusing on boosting inflation and low wage growth likely will keep rates low for some time.
 Vehicle sales proved soft in December but still remained at respectable levels. Total sales were down 1.7 percent but hitting a 16.9 million annual rate. Sales of cars and light trucks manufactured in North American were especially soft, down 2.9 percent to a 13.6 million rate. Sales of foreign-made vehicles, specifically cars, helped offset some of the weakness on the domestic side, rising 2.8 percent to a 3.3 million rate. December's results offer the first hard indication, and a negative one, for the government's December retail sales report. Vehicle sales proved soft in December but still remained at respectable levels. Total sales were down 1.7 percent but hitting a 16.9 million annual rate. Sales of cars and light trucks manufactured in North American were especially soft, down 2.9 percent to a 13.6 million rate. Sales of foreign-made vehicles, specifically cars, helped offset some of the weakness on the domestic side, rising 2.8 percent to a 3.3 million rate. December's results offer the first hard indication, and a negative one, for the government's December retail sales report.
 Consumer credit rose $14.1 billion in November though, once again, revolving credit was weak. The revolving credit component, where credit card debt is tracked, fell $0.9 billion in the month for the second contraction of the last four months. In contrast, the non-revolving credit component, as usual, posted a strong gain, up $15.0 billion and once again reflecting demand for auto loans and student loans. But revolving credit is the weak link in the consumer credit. Consumer credit rose $14.1 billion in November though, once again, revolving credit was weak. The revolving credit component, where credit card debt is tracked, fell $0.9 billion in the month for the second contraction of the last four months. In contrast, the non-revolving credit component, as usual, posted a strong gain, up $15.0 billion and once again reflecting demand for auto loans and student loans. But revolving credit is the weak link in the consumer credit.
The difficulty with those numbers for revolving credit is interpreting the reason why. One can ask if consumers are less optimistic about the economy. But consumer mood surveys are pointing to increased optimism. Another alternative is that consumers got burned by too easy credit prior to the great recession and they have not forgotten. Consumers may simply have shifted preferences to buying in cash. In the context of overall data on the consumer sector, the latter explanation appears to be more likely.
The Fed minutes showed considerable discussion regarding the timing of the first rate hike. Because of lower oil prices, the first increase could occur even with inflation below the Fed's 2 percent target. The drop in oil prices was seen as being favorable to the consumer sector. In contrast, some participants noted that the labor market is weaker than indicated by the unemployment rate. Most participants saw little risk of wage inflation.
Downside and upside risks to the economy are seen "nearly balanced" with foreign deterioration as the largest downside risk.
Fed staff economists were somewhat more upbeat about the economy.
"The information reviewed for the December 16–17 meeting suggested that economic activity was increasing at a moderate pace in the fourth quarter and that labor market conditions had improved further."
It was noted that employment and industrial production had picked along with healthy personal spending.
On guidance, as noted in the earlier statement, "can be patient" language was seen as the prior use of "considerable time" for policy rates remaining low. The new language is seen as giving the Fed more flexibility. Rate changes are still data dependent.
"Most participants thought the reference to patience indicated that the Committee was unlikely to begin the normalization process for at least the next couple of meetings."
Overall, the Fed is taking a cautious approach to when the first rate hike takes place and on the pace of later increases. The minutes made clear that Fed officials remain determined to err on the side of caution by continuing to suppress interest rates. Most officials do not anticipate raising the fed funds rate before the middle of the year.
 Lower oil prices are helping to boost the U.S. economy—at least outside of the energy patch. The U.S. trade balance again narrowed and more than expected. And again, improvement was largely due to lower oil prices. Lower oil prices are helping to boost the U.S. economy—at least outside of the energy patch. The U.S. trade balance again narrowed and more than expected. And again, improvement was largely due to lower oil prices.
In November, the U.S. trade gap narrowed to $39.0 billion from a revised $42.2 billion in October. Exports were down 1.0 percent after gaining 1.6 percent the month before. But imports declined a sharp 2.2 percent after rising 0.7 percent in October.
 Shrinkage in the overall gap was led by the petroleum goods trade gap which dropped to $11.4 billion from $15.2 billion in October. Petroleum imports were down 11.9 percent while exports rose 5.9 percent. Shrinkage in the overall gap was led by the petroleum goods trade gap which dropped to $11.4 billion from $15.2 billion in October. Petroleum imports were down 11.9 percent while exports rose 5.9 percent.
The goods excluding petroleum gap increased to $45.7 billion from $45.2 billion in October. This likely reflects continued healthy demand in the U.S. and a stronger dollar. Both imports of consumer goods and capital goods gained. The services surplus was essentially unchanged at $40.4 billion.
Overall, the November number will likely bump up estimates for fourth quarter GDP growth. Importantly, the composition of the deficit was favorable with lower oil imports due to lower prices indicating greater discretionary income for consumer and increased imports of consumer and capital goods suggesting optimism.
 The non-manufacturing sector appears to be in an oscillating mode. The non-manufacturing sector appears to be in an oscillating mode.
December growth in ISM's non-manufacturing sample, at 56.2, slowed notably from, however, November's unusually strong 59.3.
Details show particular slowing in business activity, down 7.2 points to 57.2, followed by slowing in new orders, down 2.5 points to 58.9. A plus is respectable strength for employment, down only 7 tenths to 56.0. Prices paid, reflecting lower fuel costs, fell 4.9 points to 49.5 for the first sub-50 reading since September 2009.
Despite the slowing, signals from this report are still very healthy, underscored by the breadth of strength among individual industries with 12 of 18 reporting monthly growth. The two leading industries for December –- retail and accommodation & food services –- point specifically to consumer strength during the holidays. Other readings include a gain for construction and monthly contraction for mining. Despite December's deceleration, on average in recent months the non-manufacturing continues with moderately healthy growth.
Makit's services sector PMI is telling much the same story as the ISM non-manufacturing survey. December business slowed noticeably in Markit's US service sector sample, to a composite 53.3 from 56.2 in November. The mid-month flash for December was 53.6.
Growth in new business slowed for a third straight month and is at its softest rate since September 2012. Output also slowed as did employment where growth, at an 8-month low, is no better than marginal. Price data are subdued reflecting falling fuel costs for inputs and lack of pricing power for prices charged.
Despite the slowing, growth was still comfortably above 50 in December and readings on expectations remain strong. Above 50 is the breakeven point between growth and contraction with above 50 indicating growth.
The economy is still on an upward trajectory but the pace is uncertain due to volatility in the monthly data. The labor market is improving in most aspects except for wages and this latter factor is seen as keeping the Fed with loose policy. For equities, there are a variety of concerns, including low oil prices, slow global growth, and political instability in Europe—notably Greece. Yet, there is still the issue of what are the best options for investments. There is plenty of room for debate but for now, the Fed is boosting the option for riskier assets.
This week's emphasis is on the consumer and manufacturing sectors. The labor market has been slowly improving net. Retailers want to see it show up in December retail sales number. Going forward on sales, the consumer sentiment reading will be important. Manufacturing has been sluggish but production worker hours in the December employment report point to moderate growth for December. The Fed's next policy meeting is at the end of the month and this week's Beige Book is the start of the Fed's policy cycle.
The NFIB Small Business Optimism Index surged 2.0 points in November 2014 to 98.1 for its highest reading of the recovery, going back to February 2007. The index is suddenly at its historic average of 98.0. The month was led by a huge gain in expectations that the economy will improve followed by expectations for higher sales. Earnings trends showed a small gain while plans to increase employment also rose though just barely. Inflation readings remain very low.
NFIB Small Business Optimism Index Consensus Forecast for December 14: 98.1
Range: 96.5 to 99.5
The Labor Department's Job Openings and Labor Turnover Survey showed softening labor market conditions in November. The index pulls together 19 different labor market indicators. The November index posted at 2.9 versus a revised 3.9 for October. The November number was the lowest since January 2014 and suggests that the Fed will maintain loose monetary policy in 2015.
JOLTS job openings Consensus Forecast for December 14: 4.875 million
Range: 4.825 million to 5.010 million
The U.S. Treasury monthly budget report for November showed the Treasury's deficit continues to come down, to $178.5 billion now 2 months into the government's fiscal year for a year-to-date decrease of 21 percent. Excluding special factors, including calendar timing that pushed November outlays into December, the Treasury's deficit is down an estimated 8 percent year-to-date. For comparison, the government's deficit fell 29 percent in fiscal year 2014. Looking ahead, the month of December typically shows a moderate deficit for the month. Over the past 10 years, the average deficit for the month of December has been $15.7 billion and $40.7 billion over the past 5 years. The December 2013 figure came in with a surplus of $53.2 billion.
Treasury Statement Consensus Forecast for December 14: +$3.0 billion
Range: -$57.0 billion to +$24.0 billion
Retail sales in November came in strong despite lower gasoline prices. Retail sales in November posted a 0.7 percent boost after rebounding 0.5 percent in October Autos jumped a notable 1.7 percent after gaining 0.8 percent in October. Excluding autos, sales increased 0.5 percent after rising 0.4 percent in October. Gasoline station sales fell on lower prices. Sales declined 0.8 percent after a 1.3 percent drop in October. Excluding both autos and gasoline, sales advanced 0.6 percent in November after a 0.7 percent rise the prior month.
Retail sales Consensus Forecast for December 14: -0.1 percent
Range: -0.4 to +0.4 percent
Retail sales excluding motor vehicles Consensus Forecast for December 14: -0.1 percent
Range: -0.4 to +0.5 percent
Less motor vehicles & gasoline Consensus Forecast for December 14: +0.6 percent
Range: +0.4 to +0.8 percent
Import prices dropped 1.5 percent in November, the 5th straight drop and the steepest since June 2012, and export prices fell 1.0 percent for the 4th straight drop and matching the steepest drop since June 2012. The year-on-year rate for import prices was at minus 2.3, the steepest negative reading since April 2013, with export prices at minus 1.9, the steepest since October 2013. And it's not just oil-related prices that are falling. Excluding petroleum, import prices fell 0.3 percent in the month for a 4th straight drop and the steepest since April this year while export prices, excluding both food and fuels for this reading, fell 0.5 percent for a third straight drop.
Import prices Consensus Forecast for December 14: -2.7 percent
Range: -3.4 to -0.5 percent
Export prices Consensus Forecast for December 14: -0.5 percent
Range: -2.0 to -0.3 percent
Business inventories rose slightly in October, up 0.2 percent, but showed no significant change relative to business sales which slipped 0.1 percent. The stock-to-sales ratio was unchanged for a 3rd straight month at 1.30. Looking at components, inventories at retailers rose 0.2 percent in October versus a 0.4 percent rise for sales. Here too the inventory-to-sales ratio is unchanged, at 1.42 for this component. The inventory-to-sales ratios for the two other components, wholesalers and manufacturers, also showed little change with wholesalers at 1.19 for a 3rd month and manufacturers at 1.31 versus 1.30 in September and August.
Business inventories Consensus Forecast for November 14: +0.3 percent
Range: +0.1 to +0.5 percent
The Beige Book being prepared for the January 27-28 FOMC meeting is posted. As usual, traders will be looking for the give and take between labor market conditions and inflation and wage costs.
Initial jobless claims fell 4,000 in the January 3 week to 294,000, helping to pull down the 4-week average slightly to 290,500. The average is trending about 10,000 lower than the month-ago comparison which points to steady improvement underway in the labor market. Data on continuing claims, which are reported with a 1-week lag, were mixed. Continuing claims in the December 27 week rose a sizable 101,000 to 2.452 million but the 4-week average fell 17,000 to 2.397 million. This average has been steady around the 2.400 million mark since late November.
Jobless Claims Consensus Forecast for 1/10/15: 295,000
Range: 281,000 to 325,000
The producer price index for final demand eased somewhat in November. The PPI for total final demand declined 0.2 percent after rising 0.2 percent in October. Excluding food and energy, producer price inflation was flat, following a jump of 0.4 percent in October. The index for final demand goods fell 0.7 percent in November, the fifth consecutive decrease. The broad-based November decline was led by prices for final demand energy, which dropped 3.1 percent. The index for final demand goods less foods and energy edged down 0.1 percent, and prices for final demand foods fell 0.2 percent. The index for final demand services inched up 0.1 percent in November subsequent to a 0.5-percent rise in October.
PPI-FD Consensus Forecast for December 14: -0.4 percent
Range: -1.0 to -0.1 percent
PPI-FD ex Food & Energy Consensus Forecast for December 14: +0.1 percent
Range: -0.1 to +0.2 percent
PPI-FD ex Food & Energy & Trade Services Consensus Forecast for December 14: +0.1 percent
Range: 0.0 to +0.2 percent
The Empire State manufacturing index in December fell to minus 3.58 for the first negative reading since January last year. This compares with plus 10.16 in November and a soft plus 6.17 in October. This report had been showing very strong momentum from May to September when the index averaged 21.22. New orders, at minus 1.97 versus November's plus 9.14, were in the negative column for the second time in the last three months while unfilled orders, at a very steep negative reading of minus 23.96, were the weakest since December last year.
Empire State Manufacturing Survey Consensus Forecast for January 15: 5.0
Range: 0.0 to 8.0
The general business conditions index of the Philadelphia Fed's Business Outlook Survey was still very strong in December in the Philly Fed manufacturing region but just not as strong as November's great surge. The Philly Fed's general conditions index slowed to 24.5 from 40.8 in November. Outside of November, the latest reading was the strongest since March 2011. But details in the report do show across-the-board slowing including for new orders, at 15.7 versus November's 35.7 and unfilled orders at 1.5 versus 7.1.
Philadelphia Manufacturing Survey Consensus Forecast for January 15: 20.0
Range: 16.0 to 29.3
The consumer price index in November fell 0.3 percent after no change in October. Energy dropped 3.8 percent, following a 1.9 percent decline the month before. Gasoline plunged 6.6 percent in November after a 3.0 drop in October. Food rose 0.2 percent, following a 0.1 percent increase in October. Excluding food and energy, consumer price inflation posted at 0.1 percent in November easing from 0.2 percent in October.
CPI Consensus Forecast for December 14: -0.4 percent
Range: -0.6 to -0.2 percent
CPI ex Food & Energy Consensus Forecast for December 14: +0.1 percent
Range: 0.0 to +0.2 percent
Industrial production for November jumped 1.3 percent after edging up 0.1 percent in October. Manufacturing surged 1.1 percent, following a gain of 0.4 percent in October. The rise in factory output was well above its average monthly pace of 0.3 percent over the previous five months and was its largest gain since February. Mining slipped 0.1 percent in October, following a 1.0 percent drop the month before. Utilities rebounded 5.1 percent after a 0.7 percent decline in October. Overall capacity utilization advanced to 80.1 percent in November from 79.3 percent in October. December's manufacturing component likely is to be moderate. Production worker hours in manufacturing were up 0.3 for the month.
Industrial production Consensus Forecast for December 14: -0.1 percent
Range: -1.5 to +0.3 percent
Manufacturing production component Consensus Forecast for December 14:+0.2 percent
Range: -0.5 to +0.3 percent
Capacity utilization Consensus Forecast for December 14: 80.0 percent
Range: 78.6 to 97.8 percent
The Reuter's/University of Michigan's consumer sentiment index held steady for final December at a very high level of 93.6, little changed from 93.8 at mid-month and far above November's final reading of 88.8. The current conditions component, which offers an indication on month-to-month change in consumer activity, slipped 9 tenths from the mid-month reading to a still very strong 104.8 which is 2.1 points above final November. The expectations component, which offers an indication on confidence in the outlook for jobs and income, was up 3 tenths from mid-month and up a very strong 6.5 points from final November.
Consumer sentiment Consensus Forecast for preliminary January 15: 94.0
Range: 92.0 to 98.0
R. Mark Rogers is the author of The Complete Idiot's Guide to Economic Indicators, Penguin Books.
He can also be found on a weekly broadcast talking about the U.S. economy, the easiest way to find him is by going to iTunes and searching for "Simply Economics."
Econoday Senior Writer Mark Pender contributed to this article.
|
