|
The recovery continues but at a varying pace. Inflation is low due to a decline in oil prices and this gives the Fed room to keep policy loose. However, equities have declined on weakness in commodities, notably oil, and on worries about global growth slowing. News was mixed on the consumer and manufacturing sectors.
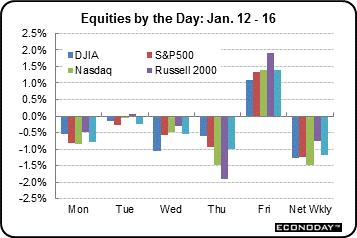 Equities fell the first four days of the past trading week but partially recovered at week's end. Equities fell the first four days of the past trading week but partially recovered at week's end.
The week started with stocks pulled down by energy shares and by movement to sidelines ahead of corporate earnings. Tuesday, equities were nudged down by energy shares.
At mid-week, stocks declined as a World Bank forecast and further drop in copper prices fueled concerns about global weakness. Also, retail sales for December missed expectations by a large margin on the downside.
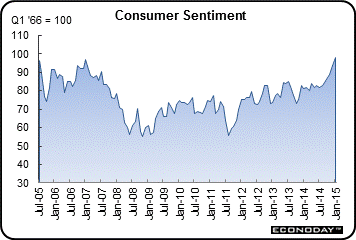
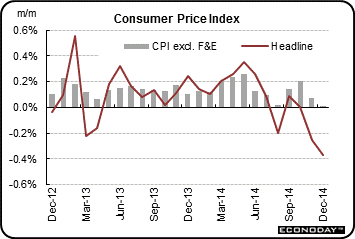
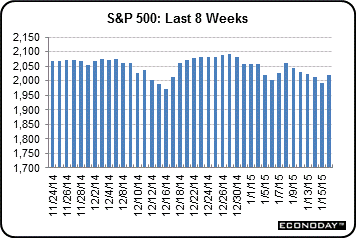 Thursday posted the most sizeable declines. Initial jobless claims were up notably. Investors sold-off positions in technology companies and lackluster results from two of the country's largest banks weighed on the financial sector. Bank of America and Citigroup fell short of expectations. On Friday, equities partially rebounded with a gain in energy shares and on better-than-expected consumer sentiment. Also, consumer prices declined by the most in six years, adding to consumer discretionary income and leading to increased belief that the Fed will be patient in raising policy rates. Thursday posted the most sizeable declines. Initial jobless claims were up notably. Investors sold-off positions in technology companies and lackluster results from two of the country's largest banks weighed on the financial sector. Bank of America and Citigroup fell short of expectations. On Friday, equities partially rebounded with a gain in energy shares and on better-than-expected consumer sentiment. Also, consumer prices declined by the most in six years, adding to consumer discretionary income and leading to increased belief that the Fed will be patient in raising policy rates.
Equities were down this past week. The Dow was down 1.3 percent; the S&P 500, down 1.2 percent; the Nasdaq, down 1.5 percent; the Russell 2000, down 0.8 percent; and the Wilshire 5000, down 1.2 percent.
For the year-to-date, major indexes are down as follows: the Dow, down 1.7 percent; the S&P 500, down 1.9 percent; the Nasdaq, down 2.1 percent; the Russell 2000, down 2.3 percent; and the Wilshire 5000, down 2.3 percent.
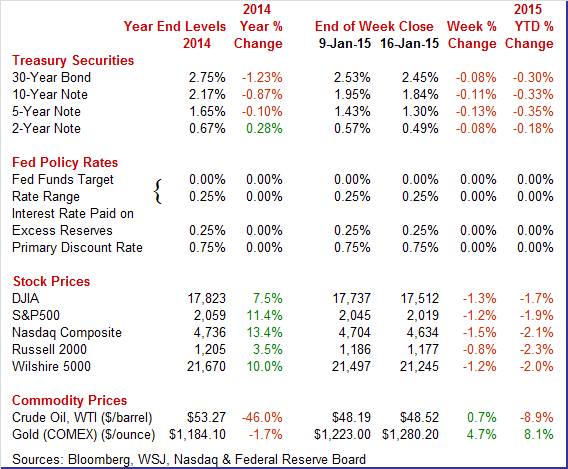
Weekly percent change column reflects percent changes for all components except interest rates. Interest rate changes are reflected in simple differences.
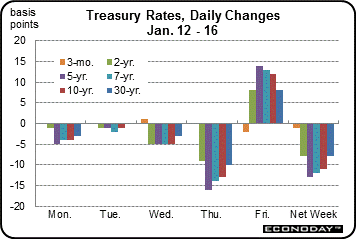 Treasury yields fell notably this past week. Treasury yields fell notably this past week.
On Monday, rates fell modestly on weak oil prices which indicated subdued inflation. Rates nudged down Tuesday on lower oil and commodities prices. This trend continued Wednesday but at a slightly faster pace.
Thursday was the weakest day of the week for Treasury yields. Initial jobless claims were up but notably coming into play was the Swiss National Bank's unexpected decision to scrap its exchange-rate cap and lower already-negative rates. This made U.S. Treasuries even more a safe haven.
Rates rebounded Friday largely on the view that the rush to buy Treasuries as a safe haven was overdone. Also, consumer sentiment jumped and St. Louis Fed President James Bullard stated that zero interest-rate policy is "too low" for an economy that's "near normal."
For this past week Treasury rates were down as follows: 3-month T-bill, down 1 basis point; the 2-year note, down 8 basis points; the 5-year note, down 13 basis points; the 7-year note, down 12 basis points; the 10-year note, down 11 basis points; and the 30-year bond, down 8 basis points.
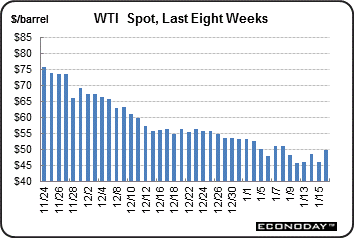 The spot price of West Texas Intermediate had a few notable daily swings and ended the week up moderately—but still at a low level. The spot price of West Texas Intermediate had a few notable daily swings and ended the week up moderately—but still at a low level.
At the start of the week, crude fell almost $2-1/2 per barrel to more than a 5-1/2 year low. This was due to Goldman Sachs Group Inc. and Société Générale SA reducing their price forecasts. WTI was little changed Tuesday.
Crude jumped almost $2-1/2 per barrel Wednesday largely on technical factors and on belief that oil had been oversold. February options expired Wednesday.
But WTI declined more than $2 per barrel on news of an OPEC forecast for weaker demand and as U.S. output hit a high in records going back to January 1983. The week ended on an up note for the energy sector with a $3-3/4 spike in spot WTI. Consumer sentiment was up and the IEA lowered its non-OPEC supply growth estimate.
Net for the week, the spot price for West Texas Intermediate declined $1.78 per barrel to settle at $49.97.
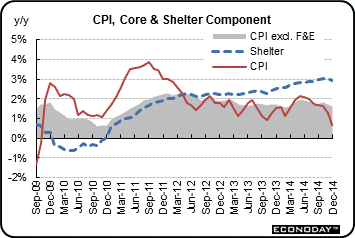
Industrial production for December was healthier than the headline. Meanwhile, the consumer sector is slowly improving. Inflation has been low due to a drop in oil prices.
The manufacturing sector is notably better than the headline number for December industrial production due to a drop in utilities. Industrial production for December slipped 0.1 percent, following a jump of 1.3 percent in November (original estimate of up 1.3 percent).
Manufacturing continued healthy growth and did not even partially reverse a sharp rise in November. Manufacturing gained 0.3 percent following a surge of 1.3 percent in November. Mining rebounded a healthy 2.2 percent, following a 0.3 percent decrease the month before. The volatile and weather –related utilities component dropped a sharp 7.3 percent after a jump of 4.2 percent in November.
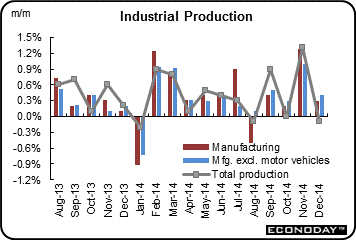 Within manufacturing, the production of durable goods increased 0.2 percent in December, and the production of nondurable goods rose 0.4 percent. Among major durable goods industries, primary metals posted the largest increase, 2.2 percent, while computers and electronic products registered a gain of 1.2 percent. The largest declines, of nearly 1 percent or more, were recorded by wood products and by motor vehicles and parts. Production increased for most nondurable goods industries, with the largest advance recorded by apparel and leather; only the plastics and rubber products industry registered a decrease. The production index for other manufacturing industries (publishing and logging) declined 0.3 percent. Within manufacturing, the production of durable goods increased 0.2 percent in December, and the production of nondurable goods rose 0.4 percent. Among major durable goods industries, primary metals posted the largest increase, 2.2 percent, while computers and electronic products registered a gain of 1.2 percent. The largest declines, of nearly 1 percent or more, were recorded by wood products and by motor vehicles and parts. Production increased for most nondurable goods industries, with the largest advance recorded by apparel and leather; only the plastics and rubber products industry registered a decrease. The production index for other manufacturing industries (publishing and logging) declined 0.3 percent.
Manufacturing excluding autos advanced 0.4 percent in December, following a 1.0 percent jump the month before.
Overall capacity utilization eased to 79.7 percent in December from 80.0 percent in November.
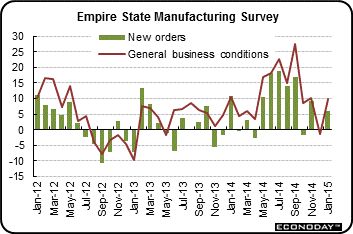
After discounting the heavily volatile utilities component, manufacturing continues recent improvement. Combined with a moderately positive consumer sector, economic growth is looking somewhat favorable. Looking ahead, the latest regional manufacturing surveys for January were mixed with Empire State accelerating and Philly Fed slowing.
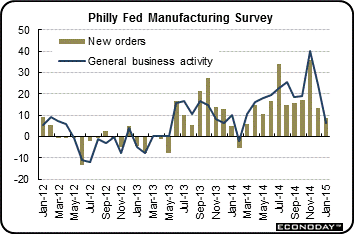 Turning to the Philly Fed report, the general conditions index for January fell to plus 6.3 from December's plus 24.3 (revised from 24.5). Growth in new orders, however, does remain solid at plus 8.5 though down from December's plus 13.6. The 6-month general outlook also was a positive, at a very strong 50.9 versus December's 50.4. Turning to the Philly Fed report, the general conditions index for January fell to plus 6.3 from December's plus 24.3 (revised from 24.5). Growth in new orders, however, does remain solid at plus 8.5 though down from December's plus 13.6. The 6-month general outlook also was a positive, at a very strong 50.9 versus December's 50.4.
The weak readings were led by shipments, which were in contraction at minus 6.9 versus December's plus 15.1, and employment, now also in contraction at minus 2.0 versus December's plus 8.4. Unfilled orders also are in the negative column, at minus 8.6 versus plus 2.7 in December.
Though the headline index levels for this report and the Empire State report are similar, this report is signaling month-to-month slowing while Empire State is signaling month-to-month acceleration from a contractionary reading in December.
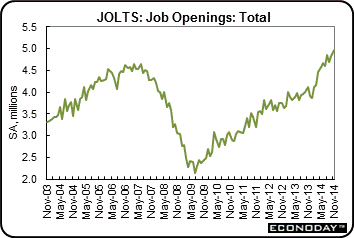
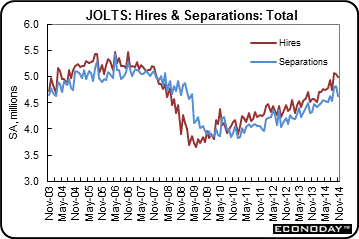
Hires remain below the pre-recession high.
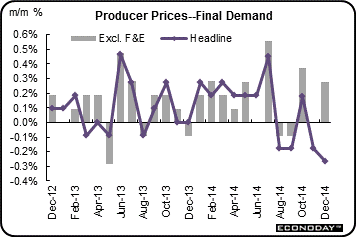
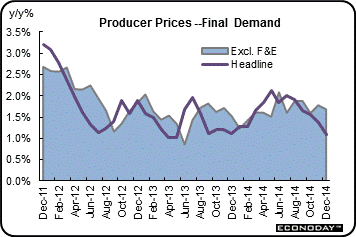
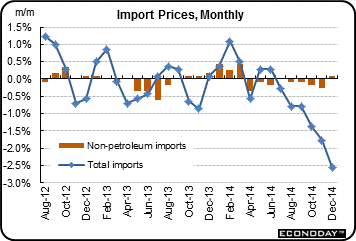 Import prices fell a very steep 2.5 percent in December following a downwardly revised contraction of 1.8 percent in November and declines of 1.4 percent and 0.8 percent in the prior 2 months. Year-on-year, import prices are down 5.5 percent. Import prices fell a very steep 2.5 percent in December following a downwardly revised contraction of 1.8 percent in November and declines of 1.4 percent and 0.8 percent in the prior 2 months. Year-on-year, import prices are down 5.5 percent.
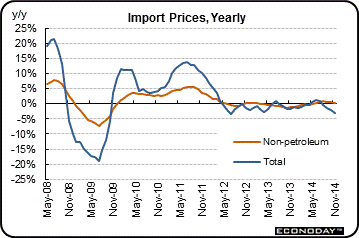 The contraction in oil prices is of course the central factor behind the deflation with petroleum prices down 16.6 percent in December alone for a year-on-year decline of 30.1 percent. But excluding petroleum, import prices are no better than flat, up 0.1 percent in December and unchanged year-on-year. The contraction in oil prices is of course the central factor behind the deflation with petroleum prices down 16.6 percent in December alone for a year-on-year decline of 30.1 percent. But excluding petroleum, import prices are no better than flat, up 0.1 percent in December and unchanged year-on-year.
Export prices, where petroleum is less of a factor, are also down. Export prices fell 1.2 percent in the month for a year-on-year decline of 3.2 percent. Agricultural prices are key on the export side and are down 0.7 percent on the month and down 4.9 percent on the year.
Prices of imported and exported finished goods show less downward pressure though there's still plenty of minus signs. Year-on-year, prices of imported vehicles are down 0.8 percent with imported capital goods down 0.5 percent.
Economic growth is moderate which is stellar compared to much of Europe and Asia. The consumer sector continues to slowly gain momentum. Manufacturing is mixed. Inflation is well below Fed target, giving the Fed room to be patient about boosting policy rates.
This week's emphasis is on housing which has stalled in recent months. Starts numbers have shown strength in the multifamily component but not the single-family component. Traders will be looking for single-family status. Existing home sales will add to that picture. Also, FHFA home prices were strong in the latest report and the issue is whether that trend continues. For housing, winter is a big seasonal factor time of year and sharp swings in data are not uncommon. But the recovery needs more help from this sector than seen in recent months.
U.S. Holiday: Martin Luther King, Jr. Day. All Markets Closed.
The NAHB housing market index remained solid, at 57 for the December housing market index. Though slightly below November's 58 and on the low side of expectations, this was still the 6th reading in row that the index was above breakeven 50. December's strength was centered in expectations for future sales, at 65 versus November's 66, followed by current sales which are at 61 versus 62. Continuing to trail in the distance was the traffic component, unchanged at 45 in a reading that underscores the lack of first-time buyers in the housing market.
NAHB housing market index Consensus Forecast for January 15: 58
Range: 56 to 59
The latest housing starts report showed single-family starts and multifamily starts moving in opposite directions. Housing starts in November dipped 1.6 percent after rebounding 1.7 percent in October. The 1.028 million unit pace was down 7.0 percent on a year-ago basis. November strength was in the volatile multifamily component. Multifamily starts rebounded 6.7 percent after declining 9.9 percent in October. In contrast, single-family starts fell 5.4 percent in November after gaining 8.0 percent in October. Housing permits declined a monthly 5.2 percent, following a 5.9 percent jump in October. The 1.035 million unit pace was down 0.2 percent on a year-ago basis.
Housing starts Consensus Forecast for December 14: 1.041 million-unit rate
Range: 0.950 million to 1.082 million-unit rate
Housing permits Consensus Forecast for December 14: 1.060 million-unit rate
Range: 0.950 million to 1.092 million-unit rate
Initial jobless claims jumped sharply in the January 10 week, up 19,000 to a 316,000 level that's the highest since September. The 4-week average was up 6,750 to 298,000 which is about even with the month-ago comparison. Data on continuing claims, which are reported with a 1-week lag, are mixed. Continuing claims fell 51,000 in the January 3 week to 2.424 million but the 4-week average rose 12,000 to 2.415 million in a comparison that is also about even with a month ago.
Jobless Claims Consensus Forecast for 1/17/14: 300,000
Range: 289,000 to 305,000
The FHFA purchase only house price index showed unexpected strength in October, gaining 0.6 percent after no change in September. Analysts forecast a 0.2 percent rise for October. The year-ago rate firmed to 4.5 percent from 4.4 percent in September. Regionally, six Census regions reported gains in October while three declined. Housing may be showing improved demand but this is just one month's report.
FHFA purchase only house price index Consensus Forecast for November 14: +0.3 percent
Range: +0.2 to +0.6 percent
The Markit PMI manufacturing index (final) for December came in at 53.9, down from November's 54.8. The flash reading for December was 53.7. New business gains and output both slowed in the month which respondents tied to uncertainty over the global economic outlook. Export orders did rise but weak demand was noted in the euro area and emerging markets. The news on hiring was downbeat with growth the slowest since July. A negative for employment was a marked slowing in backlog accumulation.
Markit PMI manufacturing flash index Consensus Forecast for January 15: 54.0
Range: 53.9 to 54.2
Existing home sales had been showing some life but not in November, sinking a very steep 6.1 percent to a 4.93 million annual rate which was below the low end of the Econoday consensus (4.97 million to 5.35 million). November, a month when the nation's weather proved mostly mild and which should have given a boost to sales, ended 5 straight months of plus 5.0 million rates. November's weakness was broad based with all 4 regions showing single digit monthly declines. But the good news is that the weakness in sales is not inflating supply which, due to a draw down of homes on the market to 2.09 million from 2.24 million, held steady relative to sales, at 5.1 months.
Existing home sales Consensus Forecast for December 14: 5.050 million-unit rate
Range: 4.930 to 5.120 million-unit rate
The Conference Board's index of leading indicators continues to signal very strong near-term rates of growth, at 0.6 percent in November following revised growth rates of 0.6 percent and 0.8 percent in the prior two months. Once again the yield spread was the biggest positive for the index reflecting the Fed's near zero rate policy. Manufacturing orders, based on the ISM, were another strong plus in the latest report as was the stock market. Credit indications were also solid. On the negative side is November's sharp decline in building permits as well as initial unemployment claims which peaked back over 300,000 briefly late in the month.
Leading indicators Consensus Forecast for December 14: +0.4 percent
Range: +0.2 to +0.6 percent
R. Mark Rogers is the author of The Complete Idiot's Guide to Economic Indicators, Penguin Books.
He can also be found on a weekly broadcast talking about the U.S. economy, the easiest way to find him is by going to iTunes and searching for "Simply Economics."
|