|
Investors' morale swung last week on key earnings reports along with central bank announcements — expected and unexpected. Economic data also provided some uncertainties as well. And the situation in Greece continued to unfold as the new government took control.
Greece's new left-wing finance minister Yanis Varoufakis said his government will not negotiate over the Greek bailout conditions with the "troika" team from the EU and IMF. Rather, he was seeking direct talks with Eurozone leaders to try to cancel more than half the money Greece owes. He spoke after meeting with Jeroen Dijsselbloem, head of the Eurogroup — the Eurozone finance ministers. Mr Dijsselbloem said Greece should stick to its reform commitments. He said Greece and the Eurogroup had a "mutual interest in the further recovery of the Greek economy inside the Eurozone" and warned against Athens acting unilaterally in its efforts to renegotiate a bailout.
On the troika, Mr Varoufakis said "we have no intention of cooperating with a three member committee whose goal is to implement a programme whose logic we consider anti-European." The troika creditors are supposed to wrap up their latest review of Greek finances at the end of February, based on which they would pay out another €7 billion of bailout money. The country's economy has shrunk drastically since the 2008 global financial crisis, and high unemployment has thrown many Greeks into poverty. The new government has already pressed ahead with cancelling major privatization projects, including of the two main ports of Piraeus and Thessaloniki.
The Federal Reserve kept its monetary policy unchanged at its FOMC meeting last week. The fed funds rate range remains zero to 0.25 percent where it has been since December 2008. The vote was unanimous. The FOMC said that the economy is now expanding at a "solid" pace with strong gains in employment. The FOMC repeated that it would be "patient" in raising interest rates, meaning it is unlikely to act until mid-year. The rate decision continues to be data dependent.
Both the Monetary Authority of Singapore and the Central Bank of Russia announced unexpected policy changes. Neither was scheduled to meet. At the same time, the Reserve Bank of New Zealand — the only major bank to increase rates in 2014 — kept its policy rate unchanged at 3.5 percent.
On the week, most equity indexes were down on global growth worries. While most indexes in Asia and Europe were up in January, U.S. indexes all retreated. U.S. stocks were down four of five weeks in the month. Monthly gains ranged from 0.3 percent (S&P/TSX Composite) to a high of 9.1 percent (DAX). Losses ranged from 0.8 percent (Shanghai Composite) to 6.7 percent (SMI).
|
|
2014 |
2015 |
% Change |
|
Index |
Dec 31 |
Jan 23 |
Jan 30 |
Week |
January |
2015 |
| Asia/Pacific |
|
|
|
|
|
|
|
| Australia |
All Ordinaries |
5388.6 |
5468.2 |
5551.6 |
1.5% |
3.0% |
3.0% |
| Japan |
Nikkei 225 |
17450.8 |
17511.8 |
17674.4 |
0.9% |
1.3% |
1.3% |
| Hong Kong |
Hang Seng |
23605.0 |
24850.5 |
24507.1 |
-1.4% |
3.8% |
3.8% |
| S. Korea |
Kospi |
1915.6 |
1936.1 |
1949.3 |
0.7% |
1.8% |
1.8% |
| Singapore |
STI |
3365.2 |
3411.5 |
3391.2 |
-0.6% |
0.8% |
0.8% |
| China |
Shanghai Composite |
3234.7 |
3351.8 |
3210.4 |
-4.2% |
-0.8% |
-0.8% |
|
|
|
|
|
|
|
|
| India |
Sensex 30 |
27499.4 |
29278.8 |
29183.0 |
-0.3% |
6.1% |
6.1% |
| Indonesia |
Jakarta Composite |
5227.0 |
5323.9 |
5289.4 |
-0.6% |
1.2% |
1.2% |
| Malaysia |
KLCI |
1761.3 |
1803.1 |
1781.3 |
-1.2% |
1.1% |
1.1% |
| Philippines |
PSEi |
7230.6 |
7548.9 |
7689.91 |
1.9% |
6.4% |
6.4% |
| Taiwan |
Taiex |
9307.3 |
9470.9 |
9361.9 |
-1.2% |
0.6% |
0.6% |
| Thailand |
SET |
1497.7 |
1598.3 |
1581.3 |
-1.1% |
5.6% |
5.6% |
|
|
|
|
|
|
|
|
| Europe |
|
|
|
|
|
|
|
| UK |
FTSE 100 |
6566.1 |
6832.8 |
6749.4 |
-1.2% |
2.8% |
2.8% |
| France |
CAC |
4272.8 |
4640.7 |
4604.3 |
-0.8% |
7.8% |
7.8% |
| Germany |
XETRA DAX |
9805.6 |
10649.6 |
10694.3 |
0.4% |
9.1% |
9.1% |
| Italy |
FTSE MIB |
19012.0 |
20519.8 |
20503.4 |
-0.1% |
7.8% |
7.8% |
| Spain |
IBEX 35 |
10279.5 |
10581.5 |
10403.3 |
-1.7% |
1.2% |
1.2% |
| Sweden |
OMX Stockholm 30 |
1464.6 |
1536.4 |
1573.6 |
2.4% |
7.4% |
7.4% |
| Switzerland |
SMI |
8983.4 |
8161.2 |
8385.1 |
2.7% |
-6.7% |
-6.7% |
|
|
|
|
|
|
|
|
| North America |
|
|
|
|
|
|
|
| United States |
Dow |
17823.1 |
17672.6 |
17165.7 |
-2.9% |
-3.7% |
-3.7% |
|
NASDAQ |
4736.1 |
4757.9 |
4635.2 |
-2.6% |
-2.1% |
-2.1% |
|
S&P 500 |
2058.9 |
2051.8 |
1995.0 |
-2.8% |
-3.1% |
-3.1% |
| Canada |
S&P/TSX Comp. |
14632.4 |
14779.4 |
14673.5 |
-0.7% |
0.3% |
0.3% |
| Mexico |
Bolsa |
43145.7 |
42649.7 |
40950.6 |
-4.0% |
-5.1% |
-5.1% |
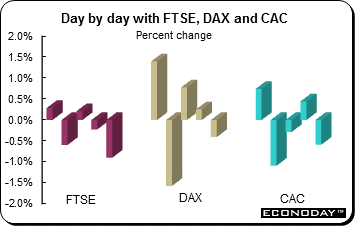 January trading ended on a down note with most equity indexes lower on the day and week. However, despite these declines, all indexes advanced in January with the exception of the SMI. For the week, the FTSE lost 1.2 percent and the CAC was 0.8 percent lower. However, the DAX added 0.4 percent while the SMI rebounded 2.7 percent. For the month, the FTSE, CAC and DAX advanced 2.8 percent, 7.8 percent and 9.1 percent respectively. The SMI, still recovering from the Swiss National Bank's shocking removal of the cap on the Swiss franc, was down 6.7 percent. January trading ended on a down note with most equity indexes lower on the day and week. However, despite these declines, all indexes advanced in January with the exception of the SMI. For the week, the FTSE lost 1.2 percent and the CAC was 0.8 percent lower. However, the DAX added 0.4 percent while the SMI rebounded 2.7 percent. For the month, the FTSE, CAC and DAX advanced 2.8 percent, 7.8 percent and 9.1 percent respectively. The SMI, still recovering from the Swiss National Bank's shocking removal of the cap on the Swiss franc, was down 6.7 percent.
Most economic data were released at the end of the week. Weak European and U.S. data had a negative impact on investor sentiment as the week wound down. Consumer prices in the Eurozone dropped more than expected in January and U.S. fourth quarter GDP data were weaker than expected.
Investors continue to watch the developments in Greece. The country's finance minister stated that Greece will not seek a bailout extension. Jeroen Dijsselbloem, president of the Eurogroup, cautioned against taking unilateral steps and ignoring previous arrangements after holding his first meeting with the new Greek government Friday.
Central Bank of Russia
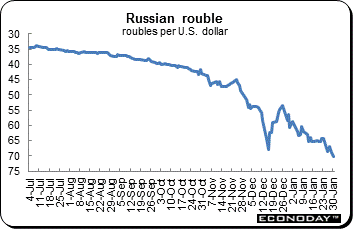 The Central Bank of Russia unexpectedly cut its main interest rate Friday as fears of recession mount in the country following the fall in global oil prices and Western sanctions over the Ukraine crisis. The bank reduced its one week minimum auction repo rate by 200 basis points to 15 percent, a little over a month after pushing it up by 6.5 points to 17 percent after a run on the rouble. The bank had been widely expected not to change the rate. Following the decision, the rouble extended losses to trade as much as 4 percent lower on the day against the dollar, though it later clawed back some of the losses. The Central Bank of Russia unexpectedly cut its main interest rate Friday as fears of recession mount in the country following the fall in global oil prices and Western sanctions over the Ukraine crisis. The bank reduced its one week minimum auction repo rate by 200 basis points to 15 percent, a little over a month after pushing it up by 6.5 points to 17 percent after a run on the rouble. The bank had been widely expected not to change the rate. Following the decision, the rouble extended losses to trade as much as 4 percent lower on the day against the dollar, though it later clawed back some of the losses.
The move implies a shift in the Bank of Russia's priorities away from clamping down on rising inflation and supporting the rouble, towards trying to support economic activity which the bank expects to fall sharply in the coming months. The decision will also fuel speculation that recent changes in the bank's senior management have shifted the bank towards more dovish monetary policy, possibly under pressure from the Kremlin, banks and business lobbies. Bank Governor Elvira Nabiullina said the rate remained high enough to allow the bank to reach its inflation target in the medium term. The bank said inflation was stabilizing.
The shift in policy may also reflect the realization that Russia's economy is heading for a hard landing as low oil prices look set to persist and the conflict in Ukraine worsens, defying hopes of an early end to Western sanctions. The bank said it expected gross domestic product to fall by 3.2 percent in annual terms during the first half of 2015, following growth of 0.6 percent in 2014.
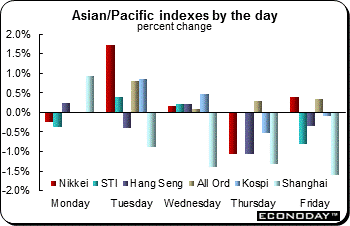 Equities were mostly lower on the week but mostly higher for the month of January. Only the All Ordinaries, Nikkei, Kospi and PSEi advanced for the week. Only the Shanghai Composite retreated in January. Chinese and Hong Kong stocks came under selling pressure on concerns over increased regulatory scrutiny of margin trading. Indian shares tumbled on earnings disappointment. Asian equities reacted negatively Thursday to what were labeled 'mixed signals' from the U.S. Federal Reserve on Wednesday regarding the possible timing of an interest rate increase. Equities were mostly lower on the week but mostly higher for the month of January. Only the All Ordinaries, Nikkei, Kospi and PSEi advanced for the week. Only the Shanghai Composite retreated in January. Chinese and Hong Kong stocks came under selling pressure on concerns over increased regulatory scrutiny of margin trading. Indian shares tumbled on earnings disappointment. Asian equities reacted negatively Thursday to what were labeled 'mixed signals' from the U.S. Federal Reserve on Wednesday regarding the possible timing of an interest rate increase.
The Shanghai Composite was down four of five days as regulatory scrutiny of margin trading businesses and caution ahead of manufacturing data due out February 1 kept investors on the sidelines. On the week, the index lost 4.2 percent and retreated 0.8 percent for the month of January. The Hang Seng was down three of five days on the week to end 1.4 percent lower. However, the index added 3.8 percent on the month. The official Xinhua news agency said the securities regulator plans to launch a fresh probe into the margin lending businesses of 46 companies. The China Securities Regulatory Commission, however, reassured investors that the inspection was "normal regular supervision" and should not be "over-interpreted".
The Nikkei gained 0.9 percent on the week and was up 1.3 percent in January. Investors shrugged off mixed economic data in the wake of strong company earnings. The slew of economic data released last week was mixed at best. Inflation continued to retreat while household spending and retail sales continued to fall. The situation in the jobs market improved, with the unemployment rate slipping to 3.4 percent from 3.5 percent, the lowest level since 1997.
The All Ordinaries added 1.5 percent on the week and was up 3.0 percent in January. Equities were up Friday for a seventh consecutive session to close near a five month high as the Australian dollar touched fresh 51/2-year lows on bets that the Reserve Bank of Australia will deliver a rate cut when it meets Tuesday. Australian investors were pouring cash into high yielding stocks with sustainable dividends, suggesting their bets are that the Reserve Bank of Australia will cut the official cash rate at Tuesday's board meeting.
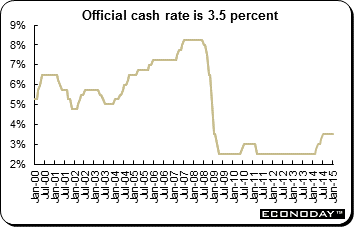 As expected, the Reserve Bank of New Zealand left its Official Cash Rate (OCR) unchanged at 3.5 percent where it has been since July 2014. The Bank said that given "the current circumstances, we expect to keep the OCR on hold for some time." Future interest rate adjustments, either up or down, will be data dependent. As the agriculture focused economy continues to grow strongly, the RBNZ had widely been expected to resume lifting rates sometime this year — building on four increases in 2014. However, the RBNZ surprised markets Thursday by suddenly introducing the possibility of rate cuts. As expected, the Reserve Bank of New Zealand left its Official Cash Rate (OCR) unchanged at 3.5 percent where it has been since July 2014. The Bank said that given "the current circumstances, we expect to keep the OCR on hold for some time." Future interest rate adjustments, either up or down, will be data dependent. As the agriculture focused economy continues to grow strongly, the RBNZ had widely been expected to resume lifting rates sometime this year — building on four increases in 2014. However, the RBNZ surprised markets Thursday by suddenly introducing the possibility of rate cuts.
In his statement, RBNZ Governor Graeme Wheeler once again pointed to the strength of the New Zealand dollar. Noting that it has eased recently, he said that the Bank believes that the exchange rate "remains unjustified in terms of current economic conditions, particularly export prices, and unsustainable in terms of New Zealand's long-term economic fundamentals. We expect to see a further significant depreciation."
Wheeler said that the high exchange rate, low global inflation and falling oil prices are causing traded goods inflation to be very weak. "Non-tradables inflation remains moderate, despite buoyant domestic demand and an improving labour market. Headline annual inflation is expected to be below the target band through 2015, and could become negative for a period before moving back towards 2 percent, albeit more gradually than previously anticipated."
Regarding the economy, the statement said that "annual economic growth in New Zealand is above 3 percent, supported by rising construction activity and household incomes. The housing market is showing signs of picking up, particularly in Auckland. However, fiscal consolidation, the reduced dairy payout, the risk of drought, and the high exchange rate will weigh on growth."
New Zealand was an outlier last year, increasing its cash rate by 100 basis points over four consecutive meetings at a time when many other developed countries were keeping theirs at record lows, if not actively cutting. Mr. Wheeler had said as recently as December that further rate increases were required, even as China's growth slowed and prices for New Zealand's biggest export, dairy, were plummeting.
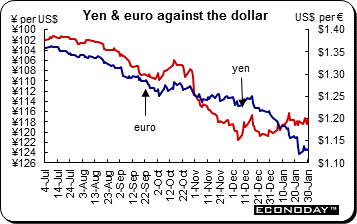 The U.S. dollar advanced against the Swiss franc and the commodity currencies, the Australian and Canadian dollars. However, it retreated against the euro, pound sterling and yen. The dollar edged lower on Friday after fourth quarter gross domestic product data were weaker than anticipated. The first estimate of GDP was up an annualized pace of 2.6 percent. It should be noted that these data are subject to major revisions going forward. An example is third quarter growth — the first estimate was up 3.5 percent only to be revised upward twice to the final 5 percent rate. The U.S. dollar advanced against the Swiss franc and the commodity currencies, the Australian and Canadian dollars. However, it retreated against the euro, pound sterling and yen. The dollar edged lower on Friday after fourth quarter gross domestic product data were weaker than anticipated. The first estimate of GDP was up an annualized pace of 2.6 percent. It should be noted that these data are subject to major revisions going forward. An example is third quarter growth — the first estimate was up 3.5 percent only to be revised upward twice to the final 5 percent rate.
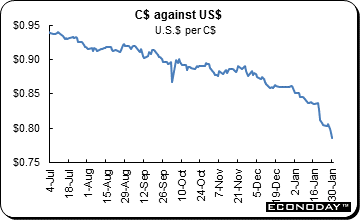 The Canadian dollar plunged to a near six year low in the wake of weaker than expected Canadian growth numbers for November. Monthly GDP contracted 0.2 percent — the weakest reading in nearly a year, led by declines in manufacturing, mining and the oil and gas sector. The Canadian dollar plunged to a near six year low in the wake of weaker than expected Canadian growth numbers for November. Monthly GDP contracted 0.2 percent — the weakest reading in nearly a year, led by declines in manufacturing, mining and the oil and gas sector.
The weak November data are unlikely to bode well for next month's data, as some of the steepest drops in oil prices happened in December and would not be accounted for in today's figures. The wild card is the energy sector where there is generally a lag between prices and production responses, and the collapse in oil prices did not become especially severe until December. The weak data may also help to explain why the Bank of Canada slashed growth forecasts for the rest of the year in its January policy meeting when it also surprised markets by cutting its policy interest rate by 25 basis points. The BoC now expects growth of 1.5 percent for the first quarter, down from its previous forecast of 2.4 percent. These numbers are the latest signal of a growing divergence between Canada and the U.S. economies.
In Singapore, the central bank changed its policy without holding a regularly scheduled meeting for the first time since October 2001, underscoring policy makers' apparent desire to act swiftly in response to events. The Monetary Authority of Singapore said Wednesday that it would slow the pace of the Singapore dollar's appreciation against a basket of currencies, reflecting a decline in inflation expectations linked to a plunge in the price of crude oil. The move set off a round of fresh volatility in foreign exchange markets.
|
|
2014 |
2015 |
% Change |
|
|
Dec 31 |
Jan 23 |
Jan30 |
Week |
2015 |
| U.S. $ per currency |
|
|
|
|
|
|
| Australia |
A$ |
0.817 |
0.792 |
0.778 |
-1.7% |
-4.7% |
| New Zealand |
NZ$ |
0.780 |
0.746 |
0.727 |
-2.5% |
-6.8% |
| Canada |
C$ |
0.861 |
0.804 |
0.787 |
-2.1% |
-8.6% |
| Eurozone |
euro (€) |
1.210 |
1.121 |
1.130 |
0.8% |
-6.6% |
| UK |
pound sterling (£) |
1.559 |
1.499 |
1.506 |
0.5% |
-3.3% |
|
|
|
|
|
|
|
| Currency per U.S. $ |
|
|
|
|
|
|
| China |
yuan |
6.206 |
6.229 |
6.251 |
-0.4% |
-0.7% |
| Hong Kong |
HK$* |
7.755 |
7.752 |
7.752 |
0.0% |
0.0% |
| India |
rupee |
63.044 |
61.435 |
61.870 |
-0.7% |
1.9% |
| Japan |
yen |
119.820 |
117.830 |
117.450 |
0.3% |
2.0% |
| Malaysia |
ringgit |
3.497 |
3.601 |
3.630 |
-0.8% |
-3.6% |
| Singapore |
Singapore $ |
1.325 |
1.345 |
1.353 |
-0.6% |
-2.1% |
| South Korea |
won |
1090.980 |
1084.020 |
1093.680 |
-0.9% |
-0.2% |
| Taiwan |
Taiwan $ |
31.656 |
31.324 |
31.527 |
-0.6% |
0.4% |
| Thailand |
baht |
32.880 |
32.580 |
32.716 |
-0.4% |
0.5% |
| Switzerland |
Swiss franc |
0.9942 |
0.879 |
0.919 |
-4.3% |
8.2% |
| *Pegged to U.S. dollar |
|
|
|
|
|
|
| Source: Bloomberg |
|
|
|
|
|
|
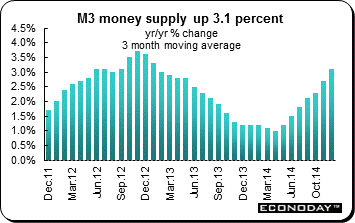 December broad money growth continued to accelerate with a reading of 3.6 percent on the year and the fastest pace since April 2013. As a result, the 3-month moving average measure picked up from 2.7 percent in mid-quarter to 3.1 percent. December's acceleration was largely attributable to a stronger performance by the key private sector lending counterpart where annual growth climbed to minus 0.5 percent from minus 0.9 percent. Within this, borrowing by households posted a minus 0.3 percent yearly rate and lending for house purchase, minus 0.1 percent. Loans to non-financial corporations climbed to minus 1.3 percent yearly after a 1.7 percent drop previously. However, it was lending to non-monetary financial corporations (excluding insurance companies and pension funds) that saw the sharpest turnaround, jumping to a plus 0.8 percent yearly rate from minus 1.0 percent in November. December broad money growth continued to accelerate with a reading of 3.6 percent on the year and the fastest pace since April 2013. As a result, the 3-month moving average measure picked up from 2.7 percent in mid-quarter to 3.1 percent. December's acceleration was largely attributable to a stronger performance by the key private sector lending counterpart where annual growth climbed to minus 0.5 percent from minus 0.9 percent. Within this, borrowing by households posted a minus 0.3 percent yearly rate and lending for house purchase, minus 0.1 percent. Loans to non-financial corporations climbed to minus 1.3 percent yearly after a 1.7 percent drop previously. However, it was lending to non-monetary financial corporations (excluding insurance companies and pension funds) that saw the sharpest turnaround, jumping to a plus 0.8 percent yearly rate from minus 1.0 percent in November.
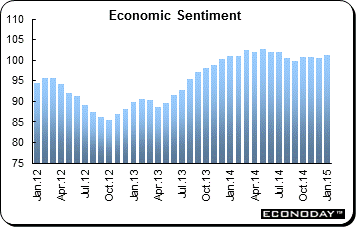 January economic sentiment (ESI) proved slightly less optimistic than expected this month. The headline index reading was 101.2, just 0.6 point higher from a marginally weaker revised December reading and nearly a point short of its level in mid-year. January's modest rise was largely attributable to improved confidence in the consumer sector where the final reading (minus 8.5) was in line with its flash estimate and 2.4 points above its year-end reading. Retail (minus 3.6 after minus 5.2) also made progress and industry (minus 5.0 after minus 5.2) similarly edged firmer. However, construction (minus 26.5 after minus 25.2) and services (plus 4.8 after plus 5.6) both lost ground. Regionally there were small gains in morale in Germany (0.4 points to 103.8) and Spain (1.0 points to 106.6) and a more marked increase in Italy (2.6 points to 101.1). However, France (down 0.4 points to 95.5) weakened further. The jump in the Italian index leaves France as the only member of the larger group of countries below the common 100 long-run average. January economic sentiment (ESI) proved slightly less optimistic than expected this month. The headline index reading was 101.2, just 0.6 point higher from a marginally weaker revised December reading and nearly a point short of its level in mid-year. January's modest rise was largely attributable to improved confidence in the consumer sector where the final reading (minus 8.5) was in line with its flash estimate and 2.4 points above its year-end reading. Retail (minus 3.6 after minus 5.2) also made progress and industry (minus 5.0 after minus 5.2) similarly edged firmer. However, construction (minus 26.5 after minus 25.2) and services (plus 4.8 after plus 5.6) both lost ground. Regionally there were small gains in morale in Germany (0.4 points to 103.8) and Spain (1.0 points to 106.6) and a more marked increase in Italy (2.6 points to 101.1). However, France (down 0.4 points to 95.5) weakened further. The jump in the Italian index leaves France as the only member of the larger group of countries below the common 100 long-run average.
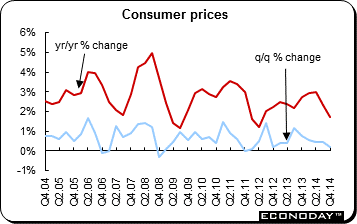
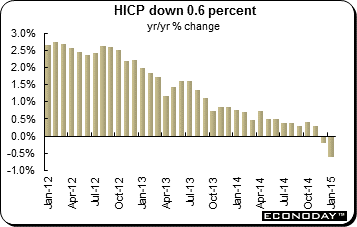 January flash harmonized index of consumer prices dropped 0.6 percent on the year — matching an all-time low — after sliding 0.2 percent in December. Energy prices continued their slump with a yearly decline of 8.9 percent following a 6.3 percent drop last time. Food, alcohol & tobacco inflation (down 0.1 percent after 0.0 percent) also had a small negative impact on the monthly change in the headline rate. Underlying developments were also worryingly soft. Excluding food, alcohol, tobacco & energy the yearly rate was only 0.6 percent, a tick below the December print and the weakest on record. Excluding just unprocessed food and energy the decline was a larger 0.2 percentage points to 0.5 percent. Elsewhere non-energy industrial goods prices were down 0.1 percent on the year after an unchanged reading in December and service sector inflation was 1.0 percent or 0.2 percentage points short of its year-end mark. January flash harmonized index of consumer prices dropped 0.6 percent on the year — matching an all-time low — after sliding 0.2 percent in December. Energy prices continued their slump with a yearly decline of 8.9 percent following a 6.3 percent drop last time. Food, alcohol & tobacco inflation (down 0.1 percent after 0.0 percent) also had a small negative impact on the monthly change in the headline rate. Underlying developments were also worryingly soft. Excluding food, alcohol, tobacco & energy the yearly rate was only 0.6 percent, a tick below the December print and the weakest on record. Excluding just unprocessed food and energy the decline was a larger 0.2 percentage points to 0.5 percent. Elsewhere non-energy industrial goods prices were down 0.1 percent on the year after an unchanged reading in December and service sector inflation was 1.0 percent or 0.2 percentage points short of its year-end mark.
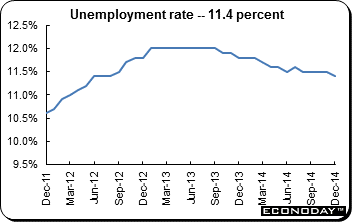 December unemployment dropped 157,000 and was enough to lower the jobless rate to 11.4 percent from 11.5 percent, its lowest level since August 2012. December's decline in the unemployment rate was the first since August and reflected declines in three of the four larger member states. According to Eurostat's definition of unemployment, Italy led the way with a sizeable 0.4 percentage point decline to 12.9 percent while both Germany (4.8 percent and the lowest in the Eurozone) and Spain (23.7 percent) saw their national rates dip just a tick. France (10.3 percent) was unchanged. At the top of the jobless ladder was Greece (25.8 percent in October) ahead of Spain and Cyprus (16.4 percent). December unemployment dropped 157,000 and was enough to lower the jobless rate to 11.4 percent from 11.5 percent, its lowest level since August 2012. December's decline in the unemployment rate was the first since August and reflected declines in three of the four larger member states. According to Eurostat's definition of unemployment, Italy led the way with a sizeable 0.4 percentage point decline to 12.9 percent while both Germany (4.8 percent and the lowest in the Eurozone) and Spain (23.7 percent) saw their national rates dip just a tick. France (10.3 percent) was unchanged. At the top of the jobless ladder was Greece (25.8 percent in October) ahead of Spain and Cyprus (16.4 percent).
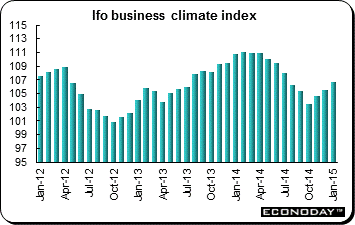 January Ifo business climate survey reading climbed to 106.7, 1.2 points above its December outcome and its third increase in as many months and its highest mark since July. The overall improvement reflected gains in both the current conditions and expectations components. The former was up almost 2 points to 111.7, also its strongest level since July and its third straight monthly advance. The latter saw a more modest 0.3 point increase to 102.0, a 5-month high and similarly a third successive rise. Among the major sectors, morale was significantly higher in manufacturing (best since August) and in retail (best since June) and also made some ground in wholesale. However, sentiment dipped in both construction and services. January Ifo business climate survey reading climbed to 106.7, 1.2 points above its December outcome and its third increase in as many months and its highest mark since July. The overall improvement reflected gains in both the current conditions and expectations components. The former was up almost 2 points to 111.7, also its strongest level since July and its third straight monthly advance. The latter saw a more modest 0.3 point increase to 102.0, a 5-month high and similarly a third successive rise. Among the major sectors, morale was significantly higher in manufacturing (best since August) and in retail (best since June) and also made some ground in wholesale. However, sentiment dipped in both construction and services.
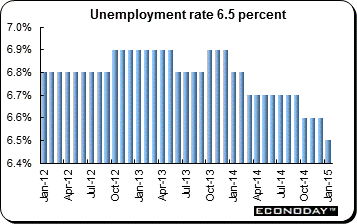 January jobless rate was 6.5 percent after recording an upwardly revised rate of 6.6 percent in December. Overall unemployment dropped 9, 000 on the month following a smaller revised 25,000 slide last time. The latest decline was the least marked since the number of people out of work started to fall again in October. Vacancies, which have made solid progress in recent months, were similarly less robust, registering a 6,000 increase following a 9,000 gain last time. Based on December ILO data, employment rose 22,000 in December for an 80,000 fourth quarter gain, up from the third quarter's 71,000 advance. January jobless rate was 6.5 percent after recording an upwardly revised rate of 6.6 percent in December. Overall unemployment dropped 9, 000 on the month following a smaller revised 25,000 slide last time. The latest decline was the least marked since the number of people out of work started to fall again in October. Vacancies, which have made solid progress in recent months, were similarly less robust, registering a 6,000 increase following a 9,000 gain last time. Based on December ILO data, employment rose 22,000 in December for an 80,000 fourth quarter gain, up from the third quarter's 71,000 advance.
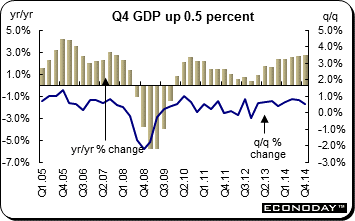 Fourth quarter first estimate gross domestic product slowed for a second successive quarter. A 0.5 percent increase in total output from the third quarter was the weakest rate since the fourth quarter of 2013. However, services performed well and annual growth edged a tick firmer to 2.7 percent. A calendar year rate of 2.6 percent was the highest since 2007. The expenditure components are not available with the first GDP estimate but the output data showed the service sector expanding a solid 0.8 percent on the quarter to match its pace in July to September. The slowdown in overall activity was attributable to the more volatile sectors. Construction (often subject to hefty revisions) contracted 1.8 percent and within a 0.1 percent dip in industrial production, utilities slumped 2.8 percent and extraction industries were off 0.6 percent. Manufacturing edged up 0.1 percent. Elsewhere, agriculture, forestry & fishing grew 1.3 percent and water supply & sewerage was up 1.2 percent. Within services, distribution, hotels & restaurants advanced 1.3 percent, transport, storage & communication 1.1 percent and business services & finance 0.9 percent. The sector as a whole would have registered a larger gain but for a zero contribution from government and other services. Fourth quarter first estimate gross domestic product slowed for a second successive quarter. A 0.5 percent increase in total output from the third quarter was the weakest rate since the fourth quarter of 2013. However, services performed well and annual growth edged a tick firmer to 2.7 percent. A calendar year rate of 2.6 percent was the highest since 2007. The expenditure components are not available with the first GDP estimate but the output data showed the service sector expanding a solid 0.8 percent on the quarter to match its pace in July to September. The slowdown in overall activity was attributable to the more volatile sectors. Construction (often subject to hefty revisions) contracted 1.8 percent and within a 0.1 percent dip in industrial production, utilities slumped 2.8 percent and extraction industries were off 0.6 percent. Manufacturing edged up 0.1 percent. Elsewhere, agriculture, forestry & fishing grew 1.3 percent and water supply & sewerage was up 1.2 percent. Within services, distribution, hotels & restaurants advanced 1.3 percent, transport, storage & communication 1.1 percent and business services & finance 0.9 percent. The sector as a whole would have registered a larger gain but for a zero contribution from government and other services.
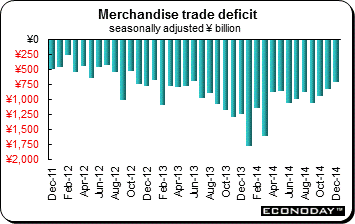 On an unadjusted basis, the December merchandise trade deficit narrowed from a revised ¥893.5 billion to ¥660.7 billion. Japan has been running a deficit since the March 2011 earthquake and tsunami when all nuclear power plants went off line and imports of oil and coal soared. Analysts expected a deficit of ¥724.4 billion. The 2014 deficit was the worst on record. On the year, imports were up 1.9 percent after retreating 1.6 percent last time while exports jumped 12.9 percent for the fourth straight increase. Also showing fourth straight increases were exports to Asia, up 4.3 percent on the year, and exports to China, up 0.9 percent. Exports to the U.S. were up 23.7 percent while those to the EU were up 6.8 percent from a year ago. On a seasonally adjusted basis, the November deficit was Y712.1 billion. On the month, imports added 0.1 percent and exports were up 2.0 percent. Between 1980 and 2010 Japan recorded a trade surplus every year. But since the Fukushima nuclear disaster of March 2011, the nation has been forced to increase imports of fossil fuels as a substitute. With the yen getting battered, those imports cost more than usual. On an unadjusted basis, the December merchandise trade deficit narrowed from a revised ¥893.5 billion to ¥660.7 billion. Japan has been running a deficit since the March 2011 earthquake and tsunami when all nuclear power plants went off line and imports of oil and coal soared. Analysts expected a deficit of ¥724.4 billion. The 2014 deficit was the worst on record. On the year, imports were up 1.9 percent after retreating 1.6 percent last time while exports jumped 12.9 percent for the fourth straight increase. Also showing fourth straight increases were exports to Asia, up 4.3 percent on the year, and exports to China, up 0.9 percent. Exports to the U.S. were up 23.7 percent while those to the EU were up 6.8 percent from a year ago. On a seasonally adjusted basis, the November deficit was Y712.1 billion. On the month, imports added 0.1 percent and exports were up 2.0 percent. Between 1980 and 2010 Japan recorded a trade surplus every year. But since the Fukushima nuclear disaster of March 2011, the nation has been forced to increase imports of fossil fuels as a substitute. With the yen getting battered, those imports cost more than usual.
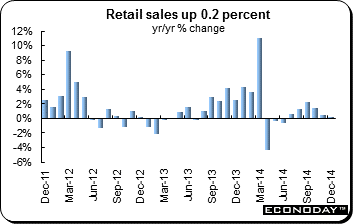 December retail sales were up 0.2 percent from a year ago after increasing 0.5 percent in November. Sales increases have steadily declined since September indicating continued weakness in the consumer sector. Auto sales dropped for a third month, this time by 2.2 percent on the year. Machinery & equipment dropped 6.1 percent for the subcategory's ninth consecutive decline. Fuel declined for the third month. Fuel sales declined 4.4 percent after dropping 5.3 percent in November, reflecting lower oil prices. On the plus side, fabrics, apparel & accessories added 3.1 percent on the year and drug & toiletry stores added 4.9 percent. December retail sales were up 0.2 percent from a year ago after increasing 0.5 percent in November. Sales increases have steadily declined since September indicating continued weakness in the consumer sector. Auto sales dropped for a third month, this time by 2.2 percent on the year. Machinery & equipment dropped 6.1 percent for the subcategory's ninth consecutive decline. Fuel declined for the third month. Fuel sales declined 4.4 percent after dropping 5.3 percent in November, reflecting lower oil prices. On the plus side, fabrics, apparel & accessories added 3.1 percent on the year and drug & toiletry stores added 4.9 percent.
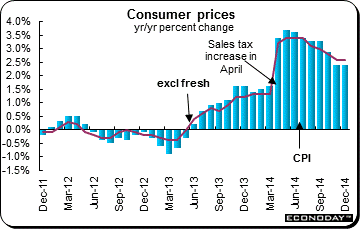 December consumer price index was up 0.1 percent and 2.4 percent from a year ago. Excluding fresh food, the CPI was down 0.2 percent and up 2.5 percent from December 2013. Excluding food and energy, the CPI was unchanged on the month and up 2.1 percent on the year. Stripped of an impact from April's increase in the sales tax from 5 percent to 8 percent, core prices were up just 0.5 percent – the most sluggish pace since June 2013 and well below the Bank of Japan's 2 percent target for the coming fiscal year. Goods prices were up 3.1 percent on the year while services increased 1.8 percent. January preliminary CPI for Tokyo declined 0.3 percent on the month but was 2.3 percent higher from a year ago. Excluding fresh food, the CPI was down 0.6 percent and up 2.2 percent on the year. Excluding food and energy the index was down 0.8 percent and 1.7 percent. The Tokyo index is looked upon as a precursor of the national index. Lower oil prices should help Japan's economy but in the short term it is making BoJ Governor Haruhiko Kuroda's battle against the deflationary mindset all the more difficult. The BoJ estimates that the April 1 tax increase added 1.7 percentage points to the core CPI data in April and 2 percent thereafter. December consumer price index was up 0.1 percent and 2.4 percent from a year ago. Excluding fresh food, the CPI was down 0.2 percent and up 2.5 percent from December 2013. Excluding food and energy, the CPI was unchanged on the month and up 2.1 percent on the year. Stripped of an impact from April's increase in the sales tax from 5 percent to 8 percent, core prices were up just 0.5 percent – the most sluggish pace since June 2013 and well below the Bank of Japan's 2 percent target for the coming fiscal year. Goods prices were up 3.1 percent on the year while services increased 1.8 percent. January preliminary CPI for Tokyo declined 0.3 percent on the month but was 2.3 percent higher from a year ago. Excluding fresh food, the CPI was down 0.6 percent and up 2.2 percent on the year. Excluding food and energy the index was down 0.8 percent and 1.7 percent. The Tokyo index is looked upon as a precursor of the national index. Lower oil prices should help Japan's economy but in the short term it is making BoJ Governor Haruhiko Kuroda's battle against the deflationary mindset all the more difficult. The BoJ estimates that the April 1 tax increase added 1.7 percentage points to the core CPI data in April and 2 percent thereafter.
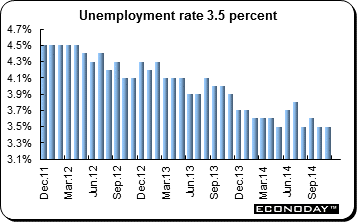 December unemployment rate edged down to 3.4 percent from 3.5 percent in November. Analysts were expecting it to remain at 3.5 percent. The jobless rate is the lowest since August 1997. Employment increased by 380,000 when compared with December 2013. The number of unemployed dropped 150,000 over the same time period. The labour force participation rate climbed to 59.3 percent from 59.0 percent in December 2013. The employment rate added 0.4 percent to a reading of 57.4 percent. December unemployment rate edged down to 3.4 percent from 3.5 percent in November. Analysts were expecting it to remain at 3.5 percent. The jobless rate is the lowest since August 1997. Employment increased by 380,000 when compared with December 2013. The number of unemployed dropped 150,000 over the same time period. The labour force participation rate climbed to 59.3 percent from 59.0 percent in December 2013. The employment rate added 0.4 percent to a reading of 57.4 percent.
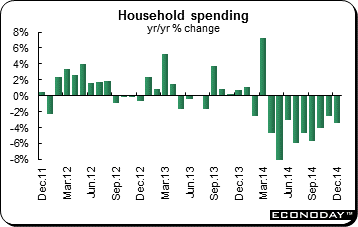 December household spending fell 3.4 percent from a year ago, confirming the weakness seen in Thursday's retail sales report. Households have been pulling back for nine consecutive months, ever since the country's national sales tax was lifted from 5 to 8 percent. Analysts expected a decline of 2.3 percent. Seven of eleven subcategories of household expenditures declined from a year ago including food (down 1.9 percent), furniture & household utensils (down 5.5 percent), clothing & footwear (down 1.0 percent), transportation & communication (down 13.8 percent) and culture & recreation (down 6.4 percent). Spending on housing, medical care and education was up on the year. December household spending fell 3.4 percent from a year ago, confirming the weakness seen in Thursday's retail sales report. Households have been pulling back for nine consecutive months, ever since the country's national sales tax was lifted from 5 to 8 percent. Analysts expected a decline of 2.3 percent. Seven of eleven subcategories of household expenditures declined from a year ago including food (down 1.9 percent), furniture & household utensils (down 5.5 percent), clothing & footwear (down 1.0 percent), transportation & communication (down 13.8 percent) and culture & recreation (down 6.4 percent). Spending on housing, medical care and education was up on the year.
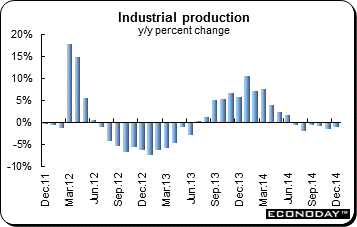 December industrial production was up 1.0 percent on the month but down 1.0 percent from a year ago. Output was down 0.5 percent in November. Factory output, which reflects the current economic climate, posted the first rise in two months after retreating 0.5 percent in November, thanks to stronger output of semiconductors, computers, cosmetics and light vehicles. METI upgraded its assessment on factory output, saying "Industrial production shows a gradual pickup." It was the first upward revision since September. Last month it said industrial production had been fluctuating. Output was up 1.8 percent in the December quarter for the first increase in three quarters. December industrial production was up 1.0 percent on the month but down 1.0 percent from a year ago. Output was down 0.5 percent in November. Factory output, which reflects the current economic climate, posted the first rise in two months after retreating 0.5 percent in November, thanks to stronger output of semiconductors, computers, cosmetics and light vehicles. METI upgraded its assessment on factory output, saying "Industrial production shows a gradual pickup." It was the first upward revision since September. Last month it said industrial production had been fluctuating. Output was up 1.8 percent in the December quarter for the first increase in three quarters.
 December quarter consumer prices were up 0.2 percent on the quarter after increasing 0.5 percent in the September quarter. On the year, the CPI was up 1.7 percent after increasing 2.3 percent in the prior quarter. The RBA's preferred measures — the trimmed mean and weighted mean — were both up 0.7 percent on the quarter and were up 2.2 percent and 2.3 percent respectively – just above the RBA's target floor. The most significant price increases were for domestic holiday travel & accommodation (5.8 percent), tobacco (4.8 percent) and new dwelling purchase by owner-occupiers (1.1 percent). The increases were partially offset by a decline in automotive fuel (down 6.8 percent). Global oil markets continue to experience oversupply, which resulted in continued declines in oil prices. In Australia, average unleaded petrol prices reached a low of $1.17 per litre in December 2014, the lowest recorded average daily price since February 2009. December quarter consumer prices were up 0.2 percent on the quarter after increasing 0.5 percent in the September quarter. On the year, the CPI was up 1.7 percent after increasing 2.3 percent in the prior quarter. The RBA's preferred measures — the trimmed mean and weighted mean — were both up 0.7 percent on the quarter and were up 2.2 percent and 2.3 percent respectively – just above the RBA's target floor. The most significant price increases were for domestic holiday travel & accommodation (5.8 percent), tobacco (4.8 percent) and new dwelling purchase by owner-occupiers (1.1 percent). The increases were partially offset by a decline in automotive fuel (down 6.8 percent). Global oil markets continue to experience oversupply, which resulted in continued declines in oil prices. In Australia, average unleaded petrol prices reached a low of $1.17 per litre in December 2014, the lowest recorded average daily price since February 2009.
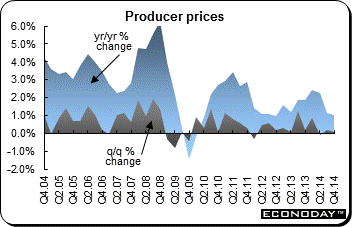 December quarter producer price index was up 0.1 percent on the quarter and 1.1 percent from the same quarter a year ago. The increase was mainly due to higher prices received for building construction (0.6 percent), other transport equipment manufacturing (5.8 percent) and computer & electronic equipment manufacturing (5.5 percent). These increases were partly offset by price declines petroleum refining & petroleum fuel manufacturing (down 11.7 percent). Intermediate demand prices were down 0.2 percent on the quarter due mainly to declines in the prices received for oil & gas extraction (down 12.9 percent) and petroleum refining & petroleum fuel manufacturing (down 11.7 percent). Prices received for textile, leather, clothing & footwear manufacturing however, were up 5.7 percent. On the year, intermediate prices were up 0.4 percent. Preliminary demand prices were down 0.4 percent and edged 0.1 percent lower on the year. The quarterly price decline was mainly due to declines in the prices received for oil & gas extraction (down 12.8 percent), petroleum refining & petroleum fuel manufacturing (down 12.3 percent) and metal ore mining (down 5.0 percent). These declines were partly offset by increases in the prices received for textile, leather, clothing & footwear manufacturing (5.9 percent) and basic polymer manufacturing (4.5 percent). December quarter producer price index was up 0.1 percent on the quarter and 1.1 percent from the same quarter a year ago. The increase was mainly due to higher prices received for building construction (0.6 percent), other transport equipment manufacturing (5.8 percent) and computer & electronic equipment manufacturing (5.5 percent). These increases were partly offset by price declines petroleum refining & petroleum fuel manufacturing (down 11.7 percent). Intermediate demand prices were down 0.2 percent on the quarter due mainly to declines in the prices received for oil & gas extraction (down 12.9 percent) and petroleum refining & petroleum fuel manufacturing (down 11.7 percent). Prices received for textile, leather, clothing & footwear manufacturing however, were up 5.7 percent. On the year, intermediate prices were up 0.4 percent. Preliminary demand prices were down 0.4 percent and edged 0.1 percent lower on the year. The quarterly price decline was mainly due to declines in the prices received for oil & gas extraction (down 12.8 percent), petroleum refining & petroleum fuel manufacturing (down 12.3 percent) and metal ore mining (down 5.0 percent). These declines were partly offset by increases in the prices received for textile, leather, clothing & footwear manufacturing (5.9 percent) and basic polymer manufacturing (4.5 percent).
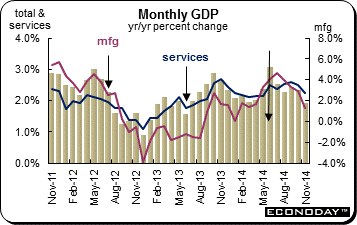 November monthly gross domestic product contracted 0.2 percent on the month, its worst performance since a weather impacted 0.4 percent slump in December 2013. Annual growth decelerated from 2.3 percent in October to 1.9 percent, its first sub-2 percent print in eight months. Headline weakness reflected a 0.8 percent monthly drop in the goods producing sector. Manufacturing was down 1.9 percent, its heftiest drop since January 2009, and mining, quarrying, & oil & gas extraction contracted 1.5 percent. The sector decline would have been steeper but for a 2.4 percent bounce in utilities and a 0.8 percent increase in agriculture, forestry, fishing & hunting. Service sector output held up a good deal better and posted no change from October when it rose 0.3 percent. The main areas of strength were arts, entertainment & recreation, which saw a 1.1 percent increase, and management of companies & enterprises, which advanced 1.0 percent. Retail trade (0.9 percent) also enjoyed a good month. However, gains here were offset by relatively small declines in a number of other categories among which wholesale trade (down 0.6 percent) and finance & insurance (down 0.4 percent) stood out. November monthly gross domestic product contracted 0.2 percent on the month, its worst performance since a weather impacted 0.4 percent slump in December 2013. Annual growth decelerated from 2.3 percent in October to 1.9 percent, its first sub-2 percent print in eight months. Headline weakness reflected a 0.8 percent monthly drop in the goods producing sector. Manufacturing was down 1.9 percent, its heftiest drop since January 2009, and mining, quarrying, & oil & gas extraction contracted 1.5 percent. The sector decline would have been steeper but for a 2.4 percent bounce in utilities and a 0.8 percent increase in agriculture, forestry, fishing & hunting. Service sector output held up a good deal better and posted no change from October when it rose 0.3 percent. The main areas of strength were arts, entertainment & recreation, which saw a 1.1 percent increase, and management of companies & enterprises, which advanced 1.0 percent. Retail trade (0.9 percent) also enjoyed a good month. However, gains here were offset by relatively small declines in a number of other categories among which wholesale trade (down 0.6 percent) and finance & insurance (down 0.4 percent) stood out.
Both the Federal Reserve and Reserve Bank of New Zealand left their key monetary policies unchanged. The Fed promised to be patient while the RBNZ once again said its currency was overvalued. Economic data were mixed. The situation in Greece continued to unfold and will continue to keep investors uneasy.
The coming week is dominated by the plethora of purchasing managers' indexes that will be released for China, Japan, the Eurozone and member states, the UK and the U.S. The Bank of England meets — it is still on a monthly meeting schedule unlike the ECB. Also on tap are monetary policy meetings in Australia and India with many expecting a rate cut from the Reserve Bank of Australia.
| Central Bank activities |
|
| February 3 |
Australia |
Reserve Bank of Australia Monetary Policy Announcement |
|
India |
Reserve Bank of India Monetary Policy Announcement |
| February 5 |
UK |
Bank of England Monetary Policy Announcement |
| |
|
|
| The following indicators will be released this week... |
| Europe |
|
|
| February 2 |
Eurozone |
Manufacturing PMI (January) |
|
Germany |
Manufacturing PMI (January) |
|
France |
Manufacturing PMI (January) |
|
UK |
Manufacturing PMI (January) |
| February 3 |
Eurozone |
Producer Price Index (December) |
| February 4 |
Eurozone |
Services & Composite PMI (January) |
|
|
Retail Sales (December) |
|
Germany |
Services & Composite PMI (January) |
|
France |
Services & Composite PMI (January) |
|
UK |
Services PMI (January) |
| February 5 |
Germany |
Manufacturers' Orders (December) |
| February 6 |
Germany |
Industrial Production (December) |
|
France |
Merchandise Trade (December) |
|
UK |
Merchandise Trade (December) |
| |
|
|
| Asia/Pacific |
|
|
| February 2 |
Japan |
Manufacturing PMI (January) |
|
China |
Manufacturing PMI (January) |
|
India |
Manufacturing PMI (January) |
| February 3 |
Australia |
Merchandise Trade Balance (December) |
| February 5 |
Australia |
Retail Sales (December) |
| |
|
|
| Americas |
|
|
| February 3 |
Canada |
Industrial Producer Price Index (December) |
| February 5 |
Canada |
International Trade (December) |
| February 6 |
Canada |
Labour Force Survey (January) |
Anne D Picker is the author of International Economic Indicators and Central Banks.
|
