|
This past week, the Fed continued with a go slow approach to tightening. Meanwhile, economic data were mixed, including a surprise on the downside for manufacturing. Also, the year for 2014 ended softer than expected.
 Equities fell notably this past week. However, the week got off to a positive start as gains in the energy sector overshadowed a decline in technology shares. Investors considered possible fallout from Greek elections but the U.S. has little exposure on this issue. Stocks fell Tuesday on corporate news and disappointing indicator news. Microsoft, Caterpillar and P&G results disappointed. Durables orders fell sharply in contrast to expectations for a modest rise. Equities fell notably this past week. However, the week got off to a positive start as gains in the energy sector overshadowed a decline in technology shares. Investors considered possible fallout from Greek elections but the U.S. has little exposure on this issue. Stocks fell Tuesday on corporate news and disappointing indicator news. Microsoft, Caterpillar and P&G results disappointed. Durables orders fell sharply in contrast to expectations for a modest rise.
 Stocks fell again at mid-week on a slump in the energy sector on lower oil prices. Also, the Fed's FOMC statement weighed on stocks including comments about concerns from international issues. Equities rebounded somewhat Thursday on a drop in jobless claims and investors cheering corporate news from McDonald's and Boeing. McDonald's announced a change in corporate leadership while Boeing reported stronger cash flow. But the week ended on a sour note as stocks fell on news of sluggish GDP growth for the fourth quarter. Stocks fell again at mid-week on a slump in the energy sector on lower oil prices. Also, the Fed's FOMC statement weighed on stocks including comments about concerns from international issues. Equities rebounded somewhat Thursday on a drop in jobless claims and investors cheering corporate news from McDonald's and Boeing. McDonald's announced a change in corporate leadership while Boeing reported stronger cash flow. But the week ended on a sour note as stocks fell on news of sluggish GDP growth for the fourth quarter.
Equities were down this past week. The Dow was down 2.9 percent; the S&P 500, down 2.8 percent; the Nasdaq, down 2.6 percent; the Russell 2000, down 2.0 percent; and the Wilshire 5000, down 2.4 percent.
Equities were down for January. The Dow was down 3.7 percent; the S&P 500, down 3.1 percent; the Nasdaq, down 2.1 percent; the Russell 2000, down 3.3 percent; and the Wilshire 5000, down 2.8 percent.
For the year-to-date, major indexes are down as follows: the Dow, down 3.7 percent; the S&P 500, down 3.1 percent; the Nasdaq, down 2.1 percent; the Russell 2000, down 3.3 percent; and the Wilshire 5000, down 3.3 percent.
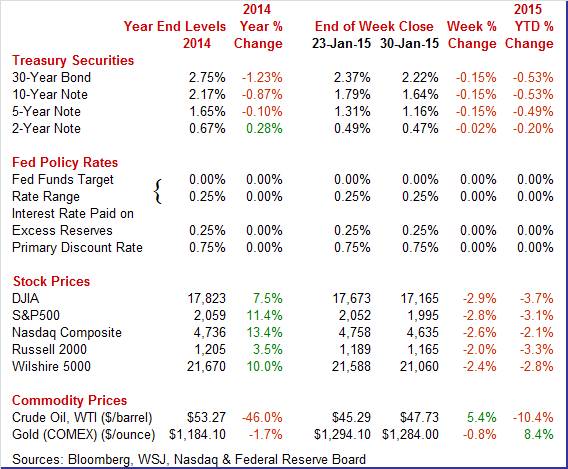
Weekly percent change column reflects percent changes for all components except interest rates. Interest rate changes are reflected in simple differences.
 Treasury rates fell significantly this past week. However, rates firmed Monday as trading was light with a snowstorm headed for the East Coast. After a quiet Tuesday, yields declined Wednesday after the Federal Reserve maintained its pledge to be "patient" on raising interest rates to normalcy. The Fed cited international risks even as it indicated a view of a stronger U.S. economy. Treasury rates fell significantly this past week. However, rates firmed Monday as trading was light with a snowstorm headed for the East Coast. After a quiet Tuesday, yields declined Wednesday after the Federal Reserve maintained its pledge to be "patient" on raising interest rates to normalcy. The Fed cited international risks even as it indicated a view of a stronger U.S. economy.
Thursday was little changed even with a drop in jobless claims. The week ended with rates down sharply on softer-than-expected GDP growth for the fourth quarter.
For this past week Treasury rates were down as follows: 3-month T-bill, down 1 basis point; the 2-year note, down 2 basis points; the 5-year note, down 15 basis points; the 7-year note, down 14 basis points; the 10-year note, down 15 basis points; and the 30-year bond, down 15 basis points.
 The spot price of West Texas Intermediate rebounded moderately this past week. After little change Monday and Tues, however, crude headed down by about $1-1/2 per barrel due to a jump in U.S. crude supply. Crude inventories increased to the highest level in data going back more than three decades. The spot price of West Texas Intermediate rebounded moderately this past week. After little change Monday and Tues, however, crude headed down by about $1-1/2 per barrel due to a jump in U.S. crude supply. Crude inventories increased to the highest level in data going back more than three decades.
Crude was flat Thursday. But Friday saw jump in WTI spot by well over $3 per barrel. Prices gained on a short-covering rally as traders recognized that low prices are eventually leading to some cutbacks in production.
Net for the week, the spot price for West Texas Intermediate gained $2.44 per barrel to settle at $47.73.
The Fed is going slow on removing policy ease. There is good reason—the economy is somewhat softer than believed. The good news is that the consumer sector is growing more positive.
At this past week's FOMC meeting, the Fed did not seem to be in any hurry to tighten. Unless the economy unexpectedly accelerates, policy is likely to remain loose for some time.
The Fed left policy rates unchanged as expected with the fed funds target at a range of zero to 0.25 percent. The Fed does see the economy as improving, describing "that economic activity has been expanding at a solid pace. Labor market conditions have improved further, with strong job gains and a lower unemployment rate."
"The Committee continues to see the risks to the outlook for economic activity and the labor market as nearly balanced. Inflation is anticipated to decline further in the near term, but the Committee expects inflation to rise gradually toward 2 percent over the medium term as the labor market improves further and the transitory effects of lower energy prices and other factors dissipate."
Guidance on when the next rate increase will occur is unchanged with emphasis on "patience" and data dependency.
There was no new news on asset purchases. The Fed is maintaining its existing policy of reinvesting principal payments from its holdings of agency debt and agency mortgage-backed securities and of rolling over maturing Treasury securities at auction. The Fed still expects policy rates to remain below normal levels for some time.
"The Committee currently anticipates that, even after employment and inflation are near mandate-consistent levels, economic conditions may, for some time, warrant keeping the target federal funds rate below levels the Committee views as normal in the longer run."
There were no dissenting votes.
Overall, Fed policy is unchanged, appears to be on a slow course, but is still data dependent even as the Fed has upgraded the status of the economy somewhat.
The latest GDP report validates the Fed decision to go slow with future tightening in policy.
 The advance estimate for fourth quarter GDP growth disappointed with a 2.6 percent figure versus analysts' estimate of 3.2 percent and following 5.0 percent for the third quarter. The advance estimate for fourth quarter GDP growth disappointed with a 2.6 percent figure versus analysts' estimate of 3.2 percent and following 5.0 percent for the third quarter.
Final sales of domestic product slowed to 1.8 percent, following a 5.0 percent jump in the third quarter. Final sales to domestic purchasers eased to 2.8 percent from 4.1 percent in the third quarter.
The increase in real GDP in the fourth quarter reflected positive contributions from personal consumption expenditures, private inventory investment, exports, nonresidential fixed investment, state and local government spending, and residential fixed investment that were partly offset by a negative contribution from federal government spending. Imports, which are a subtraction in the calculation of GDP, increased.
The deceleration in real GDP growth in the fourth quarter primarily reflected an upturn in imports, a downturn in federal government spending, and decelerations in nonresidential fixed investment and in exports that were partly offset by an upturn in private inventory investment and an acceleration in PCEs. PCE growth posted at 4.3 percent in the fourth quarter versus 3.2 percent the prior quarter. Inventories rose $113.1 billion, compared to $82.2 billion in the third quarter.
On the price front, the chain-weighted price index was unchanged, compared to the1.4 percent rise in the third quarter. Market expectations were for a 1.0 percent gain. The core chain index, excluding food and energy, eased to 0.7 percent from 1.7 percent in the third quarter.
Overall, GDP growth is moderate although somewhat disappointing. Importantly, personal spending is still healthy. The fourth quarter should perhaps be considered a question mark as the data continue to reverberate from first quarter adverse weather effects. But net, the fourth quarter was a little soft.
Manufacturing is going through a soft spot as economic growth has slowed in Europe and Asia and somewhat in the U.S.
 Durables orders unexpectedly fell 3.4 percent in December after dropping 2.1 percent in November. Analysts projected a 0.7 percent rise. Durables orders unexpectedly fell 3.4 percent in December after dropping 2.1 percent in November. Analysts projected a 0.7 percent rise.
Excluding transportation, the core slipped 0.8 in December following a decline of 1.3 percent in November. Transportation plunged a monthly 9.2 percent after dropping 3.9 percent in November. Motor vehicles rose 2.7 percent, nondefense aircraft plunged 55.5 percent, and defense aircraft fell 19.9 percent.
Outside of transportation, weakness was mixed. Industries posting gains were fabricated metals, electrical equipment, and "other." Declines were seen in primary metals, machinery, and computers & electronics.
Overall, manufacturing is soft. The outlook is questionable with the recently sharp boost in the value of the dollar.
 The consumer sector continues to carry the load for the economy in recent months. Consumer spending led fourth quarter GDP and the consumer outlook is reasonably healthy with recently favorable numbers on the consumer mood. The consumer sector continues to carry the load for the economy in recent months. Consumer spending led fourth quarter GDP and the consumer outlook is reasonably healthy with recently favorable numbers on the consumer mood.
Consumer confidence, according to the Conference Board, was up very sharply in a January reading and recovery best of 102.9 that was outside the Econoday forecast range (93.5 to 100.0). Gains swept most readings including a 12.7 point surge in the present situation component to 112.6. Here, the jobs-hard-to-get subcomponent showed special strength, down 1.6 percentage points to 25.7 percent in a reading that is a positive indication for the upcoming monthly employment report.
The expectations component also showed strength, up 7.9 points to 96.4 with the income subcomponent up sharply. Strength in expectations for future income points to a combination of strength in the jobs market, the stock market, and also the positive effect of lower gasoline prices.
Turning to the University of Michigan report, consumer sentiment held on to its very strong surge at the beginning of January, ending January at 98.1 versus the mid-month reading of 98.2 and compared against 93.6 in December. The current conditions component extended its first half gain to 109.3 vs 108.3 at mid-month and against 104.8 in December. The comparison with December points to strength for January consumer activity. The expectations component ended January at 91.0 versus 91.6 at mid-month and 86.4 in December.
 The housing sector was hard to read last week as there were mixed directions in sales indicators. The housing sector was hard to read last week as there were mixed directions in sales indicators.
New home sales surged 11.6 percent in December to a 481,000 annual rate that is outside the top estimate of the Econoday forecast (445,000 to 470,000). This followed a 6.7 percent drop in November.
And, underscoring the latest and solid S&P Case-Shiller report, there's further evidence of price appreciation as the median rose 2.2 percent in the month to $298,100 for a solid year-on-year rate of plus 8.2 percent.
Though there were 2.3 percent more homes on the market in December, totaling 219,000, the gain in sales drew down supply relative to sales to 5.5 months from 6.0 months in November. The draw in supply is a negative for January sales but a positive motivation for builders to bring new homes on the market—there may be some upward pressure on starts.
 Indications on housing had been turning up -- but not after the latest pending home sales index which fell a very steep 3.7 percent in December after rising 0.6 percent the month before. Indications on housing had been turning up -- but not after the latest pending home sales index which fell a very steep 3.7 percent in December after rising 0.6 percent the month before.
A decline was not expected at all with the result far underneath the Econoday low estimate for plus 0.3 percent. All regions showed single digit declines in the month including the two most closely watched regions, the South (down 2.6 percent) and the West (down 4.6 percent).
 Recent FHFA home price data have showed some life as does the latest S&P Case-Shiller report where the composite-20 city index rose 0.7 percent in November (seasonally adjusted) to match October's revised gain. Gains in the month were led by the largest region for home sales, the South, where Tampa, at plus 1.8 percent, and Atlanta, at plus 1.7 percent, showed particularly strong gains. Gains in the West were also strong led by San Francisco at plus 1.1 percent. Recent FHFA home price data have showed some life as does the latest S&P Case-Shiller report where the composite-20 city index rose 0.7 percent in November (seasonally adjusted) to match October's revised gain. Gains in the month were led by the largest region for home sales, the South, where Tampa, at plus 1.8 percent, and Atlanta, at plus 1.7 percent, showed particularly strong gains. Gains in the West were also strong led by San Francisco at plus 1.1 percent.
Despite the strength in monthly sales, the year-on-year rate edged 2 tenths lower to plus 4.3 percent (both adjusted and unadjusted). This rate has been edging lower each month since November 2013 but the degree of the latest decline is very small and the downward curve is definitely flattening out in what is a positive indication that the comparison may soon begin to turn higher.
Housing activity was flat through most of last year though recent price data are hinting at a bounce higher.
This past week shows obviously mixed data for the housing sector. Prices are improved with both key reports. But sales are very mixed. While prices have been on a continued, moderate uptrend, sales have been volatile. Forward momentum is still modest at best. And it is important to remember that seasonal factors are large during the off season for housing—caution in interpreting the numbers is appropriate until spring data start to post.
The economy appears to have lost a little steam after the heavy weather in the first quarter set up a mid-year rebound. Manufacturing is soft—in part due to sluggish growth in Europe and Asia. And a recently stronger dollar does not help the manufacturing outlook. But, again, the good news is that the consumer sector is showing more life due to lower gasoline prices and an improving labor market. And a stronger dollar is giving the Fed leeway to be patient in retaining low policy rates.
The consumer sector is the focus this week. The consumer mood has been improving and several indicators will confirm this trend or not. The jobs report for January posts on Friday and the two key questions are whether payroll gains continue at a moderately healthy pace and if wages improve from a soft trend. Personal income starts the week and a key issue is how much "fuel" the consumer sector gets in terms of income. The proof of consumer strength is "in the pudding" and the first January data on spending is with this week's motor vehicle sales.
Personal income advanced 0.4 percent in November after growing 0.3 percent in October. The wages & salaries component increased 0.5 percent, following a gain of 0.3 percent the month before. Personal spending grew 0.6 percent, following 0.3 percent in October. Strength was in durables which jumped 1.6 percent, following a rise of 0.3 percent in October. Nondurables were unchanged in November after decreasing 0.3 percent the prior month. Services improved 0.6 percent after rising 0.4 percent in October. PCE inflation continues to be weak-largely due to lower energy costs. Headline inflation posted at a minus 0.2 percent on a monthly basis, following no change in October. Core PCE inflation was flat in November, following a 0.2 percent rise in October. On a year-ago basis, headline PCE inflation eased to 1.2 percent in November from 1.4 percent the prior month. Year-ago core inflation came in at 1.4 percent in November compared to 1.5 percent in October. Both series remain below the Fed goal of 2 percent year-ago inflation.
Personal income Consensus Forecast for December 14: +0.3 percent
Range: +0.1 to +0.5 percent
Personal consumption expenditures Consensus Forecast for December 14: -0.2 percent
Range: -0.4 to +0.3 percent
PCE price index Consensus Forecast for December 14: -0.3 percent
Range: -0.4 to -0.2 percent
Core PCE price index Consensus Forecast for December 14: 0.0 percent
Range: -0.1 to +0.2 percent
The Markit PMI manufacturing flash index came in at 53.7 in January from 53.8 in final December and a flash reading in December of 53.7. This index has been slowing to the softest readings in a year because of weakening oil & gas activity and weakening export orders. Lower oil prices, however, have been a plus for input cost pressure which declined in the January flash for the first time in two-and-a-half years. Early indications on manufacturing activity in January have been soft.
Markit PMI manufacturing index (final) Consensus Forecast for January 15: 54.0
Range: 53.7 to 54.1
The composite index from the ISM manufacturing survey for December came in at 55.5, down a sizable 3.2 points from November for the slowest rate of monthly growth in six months. Growth in new orders slowed substantially, to 57.3 from November's exceptionally strong 66.0, while backlog accumulation also slowed, to 52.5 from 55.0. Production slowed to 58.8 vs 64.4. But employment was a positive in the report, up 1.9 points to 56.8 which is very solid for this reading. Also adding to the composite was a slowdown in delivery times which, however, reflects the labor-related slowdown at West Coast ports.
ISM manufacturing composite index Consensus Forecast for January 15: 54.5
Range: 53.5 to 56.5
Construction spending slipped 0.3 percent in November after a sharp 1.2 percent rebound in October. Market expectations were for a 0.5 percent gain. November's decrease was led by public outlays which fell 1.7 percent after a 2.8 percent jump in October. Private residential spending rose 0.9 percent, matching the pace the month before. Private nonresidential construction spending dipped 0.3 percent in November after edging up 0.1 percent in October.
Construction spending Consensus Forecast for December 14: +0.6 percent
Range: +0.5 to +1.5 percent
Sales of total light motor vehicles proved soft in December but still remained at respectable levels. Total sales were down 1.7 percent but hitting a 16.9 million annual rate. Sales of cars and light trucks manufactured in North American were especially soft, down 2.9 percent to a 13.6 million rate. Sales of foreign-made vehicles, specifically cars, helped offset some of the weakness on the domestic side, rising 2.8 percent to a 3.3 million rate.
Motor vehicle domestic sales Consensus Forecast for January 15: 13.3 million-unit rate
Range: 13.1 to 13.4 million-unit rate
Motor vehicle total sales Consensus Forecast for January 15: 16.6 million-unit rate
Range: 16.3 to 17.0 million-unit rate
Factory orders contracted for the fourth straight month in November, down 0.7 percent with minus signs sweeping nearly all major categories. The component for durables orders fell 0.9 percent in the month, revised down from minus 0.7 percent in the initial reading posted prior to Christmas. The non-durable goods component fell 0.5 percent reflecting weakness for food and petroleum products. Turning back to the durables side, transportation goods were especially weak, down 1.3 percent and reflecting a monthly swing lower for defense aircraft. Nondefense capital goods showed one of the few gains for the month, but only just barely at plus 0.1 percent. This reading when excluding civilian aircraft, which is considered a core reading for the industrial economy, fell 0.5 percent for a third straight decline.
Factory orders Consensus Forecast for December 14: -2.2 percent
Range: -3.5 to +0.4 percent
ADP private payroll employment growth for December posted at 241,000. This compares with the BLS figure for December private payrolls of 240,000.
ADP private payrolls Consensus Forecast for January 15: 220,000
Range: 210,000 to 266,000
The Markit PMI services flash index for January came in at 54.0 versus December's final reading and 10-month low of 53.3 and December's flash reading of 53.6. The gain was tied in part to a pickup in consumer spending though new business growth in January continued to moderate to a new low in the 5-year history of the report. Amid the slowing, service providers in the sample continued to add to payrolls though at the slowest rate in 9 months. Growth in backlogs was at a 6-month low. Price data showed only fractional pressure for inputs and only fractional pricing power for outputs.
Markit PMI services index (final) Consensus Forecast for January 15: 54.1
Range: 53.5 to 54.3
The composite index from the ISM non-manufacturing survey at 56.2 for December slowed substantially from November's unusually strong 59.3. Details showed particular slowing in business activity, down 7.2 points to 57.2, followed by slowing in new orders, down 2.5 points to 58.9. A plus was respectable strength for employment, down only 7 tenths to 56.0. Prices paid, reflecting lower fuel costs, fell 4.9 points to 49.5 for the first sub-50 reading since September 2009.
ISM non-manufacturing composite index Consensus Forecast for January 15: 56.5
Range: 54.5 to 57.5
The U.S. international trade gap in November narrowed to $39.0 billion from a revised $42.2 billion in October. Market expectations were for the deficit to narrow to $41.5 billion. Exports were down 1.0 percent after gaining 1.6 percent the month before. But imports declined a sharp 2.2 percent after rising 0.7 percent in October. Shrinkage in the overall gap was led by the petroleum goods trade gap which dropped to $11.4 billion from $15.2 billion in October. Petroleum imports were down 11.9 percent while exports rose 5.9 percent. The goods excluding petroleum gap increased to $45.7 billion from $45.2 billion in October. The services surplus was essentially unchanged at $40.4 billion.
International trade balance Consensus Forecast for December 14: -$37.9 billion
Range: -$40.0 billion to -$35.5 billion
Initial jobless claims the week of January 24 were down a shocking 43,000 to 265,000. This is the lowest reading since April 2000 but initial claims are often volatile coming off the Martin Luther King holiday (Monday, January 19). The 4-week average was down 8,250 in the week to a 298,500 level. Continuing claims, which are reported with a 1-week lag, fell a very sizable 71,000 in the January 17 week to 2.385 million.
Jobless Claims Consensus Forecast for 1/31/15: 290,000
Range: 280,000 to 310,000
Nonfarm business productivity for the third quarter was revised up to an annualized 2.3 percent from the first estimate of 2.0 percent and following a 2.9 percent boost in the second quarter. Unit labor costs were revised down notably to minus 1.0 percent from a first estimate of up 0.3 percent after falling an annualized 3.7 percent in the second quarter. Output growth slowed to 4.9 percent in the third quarter, following a 5.5 percent jump the prior quarter. Compensation growth in the third quarter was up 1.3 percent annualized after a dip of 0.9 percent the previous period. Based on the initial estimate for fourth quarter GDP, there likely will be a slowing in productivity and firming in unit labor costs.
Nonfarm Business Productivity Consensus Forecast for initial Q4 14: +0.2 percent annual rate
Range: -1.5 to +1.0 percent annual rate
Unit Labor Costs Consensus Forecast for initial Q4 14: +1.2 percent annual rate
Range: +0.7 to +2.6 percent annual rate
Nonfarm payroll employment in December advanced 252,000 after jumping a revised 353,000 in November. October and November were revised up notably by a net 50,000. The unemployment rate decreased to 5.6 percent from 5.8 percent in November. Going back to the payroll report, private payrolls increased 240,000 after rising 345,000 in November. Average hourly earnings slipped 0.2 percent in December after gaining 0.2 percent the prior month. Average weekly hours were unchanged at 34.6 hours and matched expectations. Looking at the broader underemployment measure from the household survey, the U-6 measure eased to 11.2 percent from 11.4 percent in November. Also from the household survey, the participation rate slipped to 62.7 percent from 62.9 percent in November.
Nonfarm payrolls Consensus Forecast for January 15: 230,000
Range: 215,000 to 275,000
Private payrolls Consensus Forecast for January 15: 229,000
Range: 215,000 to 275,000
Unemployment rate Consensus Forecast for January 15: 5.6 percent
Range: 5.5 to 5.7 percent
Average workweek Consensus Forecast for January 15: 34.6 hours
Range: 34.5 to 34.6 hours
Average hourly earnings Consensus Forecast for January 15: +0.3 percent
Range: +0.1 to +0.4 percent
Consumer credit outstanding rose $14.1 billion in November though, once again, revolving credit was weak. The revolving credit component, where credit card debt is tracked, fell $0.9 billion in the month for the second contraction of the last four months. In contrast, the non-revolving credit component, as usual, posted a strong gain, up $15.0 billion and once again reflecting demand for auto loans and student loans. But revolving credit is the weak link in the consumer credit.
Consumer credit Consensus Forecast for December 14: +$15.2 billion
Range: +$12.8 billion to +$22.0 billion
R. Mark Rogers is the author of The Complete Idiot's Guide to Economic Indicators, Penguin Books.
He can also be found on a weekly broadcast talking about the U.S. economy, the easiest way to find him is by going to iTunes and searching for "Simply Economics."
Econoday Senior Writer Mark Pender contributed to this article.
|
