|
The economy appears to be on a modest upward trend. But there is a higher level of uncertainty with retail sales coming in below expectations. Again, there were special factors that left big question marks regarding consumer spending. But consumer sentiment is still healthy although slightly softened.
 Equities ended the week up notably. Equities ended the week up notably.
The week started off on a negative note on news from overseas. Stocks dipped Monday on disappointing trade data from China and Greek debt concerns. Equities rebounded Tuesday, buoyed by hopes for a deal between Greece and its international creditors. Corporate news also helped as Coca-Cola gained after its fourth quarter profit beat analysts' expectations.
Equities were flat at mid-week. Thursday saw stocks gain on news of a truce deal in Ukraine and strong quarterly earnings reports—offsetting disappointing data on retail sales. TripAdvisor surged after rival Expedia agreed to buy Orbitz. Cisco surged after the company reported its fastest revenue growth in three years.
 The S&P500 hit a record high Friday. Equities gained largely on energy stocks which gained in the vicinity of 2 percent. The S&P500 hit a record high Friday. Equities gained largely on energy stocks which gained in the vicinity of 2 percent.
Equities were up this past week. The Dow was up 1.1 percent; the S&P 500, up 2.0 percent; the Nasdaq, up 3.1 percent; the Russell 2000, up 1.5 percent; and the Wilshire 5000, up 1.9 percent.
For the year-to-date, major indexes are up as follows: the Dow, up 1.1 percent; the S&P 500, up 1.9 percent; the Nasdaq, up 3.3 percent; the Russell 2000, up 1.5 percent; and the Wilshire 5000, up 1.5 percent.
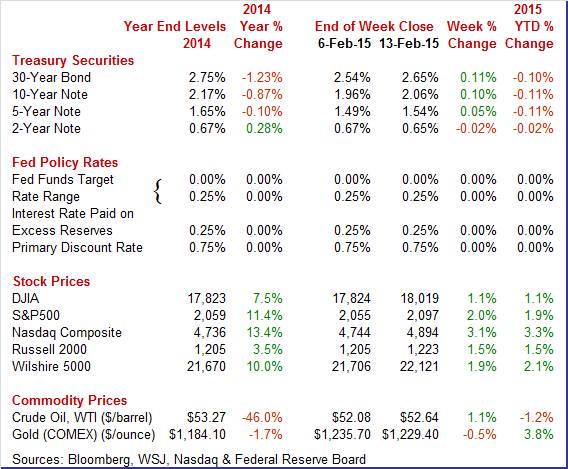
Weekly percent change column reflects percent changes for all components except interest rates. Interest rate changes are reflected in simple differences.
Treasury yields rose this past week.
 After essentially no change on Monday, rates firmed Tuesday with new debt sales—government and corporate weighing on prices. In the corporate sector, Apple and Microsoft stood out. After essentially no change on Monday, rates firmed Tuesday with new debt sales—government and corporate weighing on prices. In the corporate sector, Apple and Microsoft stood out.
Yields were flat Wednesday but dipped Thursday on disappointing retail sales. Rates rebounded Friday on encouraging news from Europe and Ukraine. Eurozone economic growth improved by 0.3 percent in the fourth quarter, topping a consensus estimate for 0.2 percent growth. A potential truce in eastern Ukraine was seen as a positive.
Also, returns on equities were seen as more favorable.
For this past week Treasury rates mostly were up as follows: the 5-year note, up 5 basis points; the 7-year note, up 7 basis points; the 10-year note, up 10 basis points; and the 30-year bond, up 11 basis points. The 3-month T-bill was unchanged while the 2-year note slipped 1 basis point.
 The spot price for West Texas Intermediate nudged up this past week. The spot price for West Texas Intermediate nudged up this past week.
After little change Monday, crude declined about $1-1/2 per barrel Tuesday on concerns about a supply glut. The U.S. Energy Information Administration in a monthly report issued Tuesday projected an average of $58 for Brent crude and $55 for West Texas Intermediate crude in 2015—matching its previous forecast.
The only other major daily move was Friday with a $1-1/2 gain. This was based on another weekly drop in U.S. rig counts from Baker Hughes.
Net for the week, the spot price for West Texas Intermediate edged up 56 cents per barrel to settle at $52.64.
The consumer sector is in flux. Spending is soft—partly due to technical factors. But the consumer sector still appears to be moderately optimistic.
Technical factors are affecting the consumer sector.
 Lower gasoline prices continue to tug down on retail sales. And consumers are not yet putting higher discretionary income into spending on non-gasoline categories of retail sales even as confidence has improved. Retail sales in January fell 0.8 percent after declining an unrevised 0.9 percent in December. Excluding autos, sales decreased 0.9 percent—the same pace of decline as in December. Auto sales declined 0.5 percent after a drop of 0.8 percent in December. These numbers tracked earlier released unit new auto sales. Lower gasoline prices continue to tug down on retail sales. And consumers are not yet putting higher discretionary income into spending on non-gasoline categories of retail sales even as confidence has improved. Retail sales in January fell 0.8 percent after declining an unrevised 0.9 percent in December. Excluding autos, sales decreased 0.9 percent—the same pace of decline as in December. Auto sales declined 0.5 percent after a drop of 0.8 percent in December. These numbers tracked earlier released unit new auto sales.
Excluding both autos and gasoline sales rose 0.2 percent after no change in December. Expectations were for a 0.4 percent increase. Gasoline sales swooned a monthly 9.3 percent after dropping 7.4 percent in December.
There were some positives in the report. Gains were seen in building materials & garden supplies, electronics, miscellaneous store retailers, nonstore retailers, and food services & drinking places. Housing may be improving as builders go to these retailers for materials. But an alternative explanation is that the building material sales reflected purchases of sand and other items to deal with extreme weather. The other gains are positive as they are very discretionary—indicating an improved consumer sector.
The latest retail sales numbers are not consistent with increased discretionary income and higher confidence. One explanation may be that consumers are spending more on services than on "hard" items found in the retail sales report. The big picture is that the consumer sector is improved but the next broad data will be in the next GDP and personal income reports.
 Consumer sentiment remains very strong but it did move down after spiking in January, to 93.6 for the mid-month February reading versus January's 98.1 which was the best reading in 11 years. The 93.6 reading was still very solid, matching December's reading as the second best of the last 8 years. Consumer sentiment remains very strong but it did move down after spiking in January, to 93.6 for the mid-month February reading versus January's 98.1 which was the best reading in 11 years. The 93.6 reading was still very solid, matching December's reading as the second best of the last 8 years.
The fall back for the index was divided about equally between the two components, current conditions at 103.1 versus 109.3 and expectations at 87.5 versus 91.0. The dip for current conditions points to possible slowing in consumer activity this month, while the dip in expectations points to a little less optimism in the outlooks for jobs and income.
Gas prices are low but haven't been falling any further this month. One-year inflation expectations are up a sizable 3 tenths to 2.8 percent which however is still low for this reading. In an offset, 5-year expectations are down 1 tenth to 2.7 percent.
The prior spike for consumer sentiment offered a leading indication on gains in the jobs market but not on consumer spending which is still flat. And today's report doesn't point to any improvement. These results will lower expectations for the consumer confidence index at month's end, a separate report that also posted an outsized spike in January.
The latest sentiment number is consistent with other measures—including Bloomberg and Conference Board—remaining relatively high.
 According to the Jobs Openings and Labor Turnover Survey, the labor market continues to improve, but slowly. According to the Jobs Openings and Labor Turnover Survey, the labor market continues to improve, but slowly.
There were 5.028 million job openings on the last business day of December, slightly improved from 4.847 million in November. Hires (5.148 million) and separations (4.886 million) were little changed in December. Within separations, the quits rate (1.9 percent) and the layoffs and discharges rate (1.2 percent) were unchanged. This release includes estimates of the number and rate of job openings, hires, and separations for the nonfarm sector by industry and by four geographic regions.
 There were 5.148 million hires in December, slightly higher than November's 5.054 million. This was the highest level of hires since November 2007. The hires rate in December was 3.7 percent. The number of hires was little changed for total private and government. Hires increased over the month in construction. There were 5.148 million hires in December, slightly higher than November's 5.054 million. This was the highest level of hires since November 2007. The hires rate in December was 3.7 percent. The number of hires was little changed for total private and government. Hires increased over the month in construction.
Total separations include quits, layoffs and discharges, and other separations. Total separations are referred to as turnover. Quits are generally voluntary separations initiated by the employee. Therefore, the quits rate can serve as a measure of workers' willingness or ability to leave jobs. Layoffs and discharges are involuntary separations initiated by the employer. Other separations include separations due to retirement, death, and disability, as well as transfers to other locations of the same firm.
There were 4.9 million total separations in December, little changed from November. This was the highest level of separations since October 2008. The separations rate was 3.5 percent. The number of total separations was little changed for total private and government.
There were 2.717 million quits in December, little changed from November. The quits rate in December was 1.9 percent. The number of quits was little changed for total private and government. Quits increased in construction and durable goods manufacturing. The number of quits was little changed in all four regions.
 Based on the Fed's broad view of the labor market, the doves may push back the first increase in policy rates. Based on the Fed's broad view of the labor market, the doves may push back the first increase in policy rates.
The Fed's labor market conditions index rose 4.9 points in January, compared to 7.3 points in December. This suggests softer growth—but still growth—in January.
The bottom line is that the Fed doves will see the labor market as still too sluggish even though improving. With below target inflation and still modest labor market conditions, the Fed will be debating more on when to start edging up policy rates. Fed hawks are concerned about lagged effects of loose policy.
The Fed's research department has created a labor market conditions index (LMCI) based on 19 labor market indicators. It is not an official report. However, the monthly publication is carefully noted by Fed Chair Janet Yellen and has gained market attention. Notably, the Fed does not publish component impact every month but only the headline number.
The LMCI index includes the following components: unemployment rate, labor force participation rate, part time for economic reasons, private payroll employment, government payroll employment, temporary help employment, average weekly hours (production), average weekly hours of persons at work, average hourly earnings (production), composite help-wanted index (Conference Board), hiring rate, transition rate from unemployment to employment, insured unemployment rate, job losers unemployed less than five weeks, quit rate, job leavers unemployed less than 5 weeks, jobs plentiful vs hard to get (Conference Board), hiring plans (NFIB) and jobs hard to fill (NFIB).
Economic growth "may" be slowing. The consumer sector recently has been carrying the load but is now giving mixed signals. Issues include technical factors (gasoline prices and volatility in auto sales). But consumer confidence is holding up.
In a light week of economic news, housing stands out. Housing construction has leveled off in recent months. But there are hints at improvement from NAHB. Will this continue and will the NAHB housing market index actually translate into gains for housing starts.
U.S. Holiday: Presidents' Day. Bond, Equity Markets Closed
The Empire State manufacturing index in January rose out of contraction to plus 9.95 versus December's slightly revised minus 1.23 (initial reading minus 3.58). New orders showed respectable strength at plus 6.09 versus a near zero reading in December while shipments rose to plus 9.95 from plus 2.25. A big positive in the report was a solid gain in employment which rose to 13.68 vs 8.33. The gain here points to confidence in Empire State's sample underscored by a more than 9 point jump in the 6-month outlook to 48.35.
Empire State Manufacturing Survey Consensus Forecast for February 15: 9.50
Range: 6.00 to 14.00
The NAHB housing market index continued to report solid conditions with the housing market index at 57 in January versus an upwardly revised 58 in December. January was the 7th plus-50 score in a row. January's strength was led by the most heavily weighted component, present sales, which held steady at 62. But the second most heavily weighted component, traffic, remained weak, down 2 points to 44 and reflecting a significant lack of first-time buyers in the new home market. The final component, future sales, did fall 4 points but remained very solid at 60.
NAHB housing market index Consensus Forecast for February 15: 58
Range: 56 to 60
Housing starts rebounded 4.4 percent in December after declining 4.5 percent in November. Expectations were for a 1.041 million pace for November. The 1.089 million unit pace was up 5.3 percent on a year-ago basis. But there is little forward momentum in housing as housing permits declined a monthly 1.9 percent, following a 3.7 percent decrease in November. The 1.032 million unit pace was up 1.0 percent on a year-ago basis. Single-family permits rose 4.5 percent while multifamily permits fell 11.8 percent.
Housing starts Consensus Forecast for January 15: 1.070 million-unit rate
Range: 1.050 million to 1.110 million-unit rate
Housing permits Consensus Forecast for January 15: 1.070 million-unit rate
Range: 1.032 million to 1.110 million-unit rate
The producer price index for final demand fell 0.3 percent in December, following a decline of 0.2 percent in November. Excluding food and energy, producer price inflation firmed 0.3 percent, following no change in November. The index for final demand goods dropped 1.2 percent after falling 0.7 percent in November, the sixth consecutive decrease. The December decline was led by prices for final demand energy, which fell a monthly 6.6 percent. The index for final demand goods less foods and energy rebounded 0.2 percent, following a dip of 0.1 percent in November. Prices for final demand foods declined 0.4 percent after decreasing 0.2 percent in November. The index for final demand services advanced 0.2 percent in December after inching up 0.1 percent in the prior month. In November, prices for final demand services less trade firmed to 0.2 percent after rising 0.1 percent in November.
PPI-FD Consensus Forecast for January 15: -0.5 percent
Range: -1.1 to -0.1 percent
PPI-FD ex Food & Energy Consensus Forecast for January 15: +0.1 percent
Range: 0.0 to +0.2 percent
PPI-FD ex Food & Energy & Trade Services Consensus Forecast for January 15: +0.1 percent
Range: 0.0 to +0.1 percent
Industrial production is notably better than the headline number for December industrial production due to a drop in utilities. Industrial production for December slipped 0.1 percent, following a jump of 1.3 percent in November (original estimate of up 1.3 percent). Manufacturing continued healthy growth and did not even partially reverse a sharp rise in November. Manufacturing gained 0.3 percent following a surge of 1.3 percent in November. Mining rebounded a healthy 2.2 percent, following a 0.3 percent decrease the month before. The volatile and weather –related utilities component dropped a sharp 7.3 percent after a jump of 4.2 percent in November. Overall capacity utilization eased to 79.7 percent in December from 80.0 percent in November.
Industrial production Consensus Forecast for January 15: +0.4 percent
Range: +0.1 to +1.0 percent
Manufacturing production component Consensus Forecast for January 15: +0.4 percent
Range: +0.2 to +0.7 percent
Capacity utilization Consensus Forecast for January 15: 79.9 percent
Range: 79.6 to 80.7 percent
The Minutes of the January 27-28 FOMC meeting are scheduled for release at 2:00 p.m. ET. The January 28 statement was rather un-new. The question is whether debate within the Fed is heating up on when to start nudging up policy rates. The minutes likely will add to what the positions are.
Initial jobless claims data have been choppy week to week but the underlying trends are favorable. Initial claims rose 25,000 in the February 7 week to a higher-than-expected 304,000 but the 4-week average actually fell, down for a 3rd straight week to a 289,750 level that is about 10,000 lower than a month ago in what is a favorable comparison for the monthly employment report. Continuing claims, which are reported with a 1-week lag, are also favorable. Continuing claims in the January 31 week fell 51,000 to 2.354 million while the 4-week average fell 19,000 to 2.404 million. The unemployment rate for insured workers is unchanged at a recovery low of 1.8 percent.
Jobless Claims Consensus Forecast for 2/14/15: 290,000
Range: 270,000 to 305,000
The Markit PMI manufacturing index (final) finished January at 53.9 versus 53.7 at mid-month. December's readings were the same: 53.9 for final December and 53.7 at mid-month. On the strong side were output volumes and employment, the latter is a special plus, while on the soft side was new business growth which is being held down by weakness in export orders. Here, the strong dollar and slowing foreign markets are a concern.
Weakness in the price-depressed oil & gas sector is also a factor holding down new business. Price pressures, because of oil, are very soft.
Markit PMI manufacturing flash index Consensus Forecast for February 15: 53.8
Range: 53.0 to 54.9
The general business conditions index of the Philadelphia Fed's Business Outlook Survey for January fell to plus 6.3 from December's plus 24.3 (revised from 24.5). Growth in new orders, however, does remain solid at plus 8.5 though down from December's plus 13.6. The 6-month general outlook also was a positive, at a very strong 50.9 versus December's 50.4.
Philadelphia Fed survey Consensus Forecast for February 15: 8.2
Range: 6.0 to 15.0
The Conference Board's index of leading indicators was most recently boosted by Fed policy. But in the latest report, there is not much else to encourage optimism. The index of leading economic indicators rose a solid 0.5 percent in December in what, however, was a somewhat shallow gain reflecting the Fed's zero interest-rate policy (the interest rate spread in leading indicators), a policy that looks to be shifting higher, and the report's credit index that has long been signaling strength in lending activity but has yet to be confirmed by other data. Otherwise, the month's strength was mostly negligible though a decline in unemployment claims was the third largest factor. A clear negative reading in the report was a decline in building permits.
Leading indicators Consensus Forecast for January 15: +0.3 percent
Range: +0.1 to +0.4 percent
He can also be found on a weekly broadcast talking about the U.S. economy, the easiest way to find him is by going to iTunes and searching for "Simply Economics."
Econoday Senior Writer Mark Pender contributed to this article.
|
