|
Payroll jobs were stronger than expected in the February employment situation. But a few facets of the report were soft. Will the overall report be enough to move up the Fed's timetable for rate increases?
This past week for equities, "good news" was "bad news" as strong payroll employment gains has raised belief that the Fed will start gradual tightening at mid-year instead of late year, leaving equities down for the week.
 But the week got off to a good start. Somewhat disappointing data on personal spending and construction outlays were shrugged off. ISM manufacturing came in much as expected while Markit's manufacturing index showed acceleration during the second half of February. Monday, for the first time in 15 years the Nasdaq topped 5,000. The Dow and S&P 500 closed at record highs. But the week got off to a good start. Somewhat disappointing data on personal spending and construction outlays were shrugged off. ISM manufacturing came in much as expected while Markit's manufacturing index showed acceleration during the second half of February. Monday, for the first time in 15 years the Nasdaq topped 5,000. The Dow and S&P 500 closed at record highs.
Tuesday, traders were in profit taking mode amid concerns about the sustainability of the uptrend in light of expectations of higher interest rates in the relatively near future. Disappointing auto sales from Ford, General Motors and Chrysler also weighed on stocks. Manufacturers attributed the dip in sales to the harsh winter weather. Traders were also moving to the sidelines, waiting for a slew of economic data later in the week, notably the monthly employment report on Friday.
 Stocks continued to slip at mid-week despite positive results from the ISM non-manufacturing survey and the Markit services survey. Profit taking continued. Nine of the 10 sectors in the S&P lost ground. The Fed's Beige Book was moderately positive but much as expected. On Thursday, equities rebounded somewhat despite a rise in initial jobless claims. Earlier in the day, the European Central Bank raised growth and inflation targets and announced it would start its new government bond-buying program of €60 billion a month on March 9. Stocks continued to slip at mid-week despite positive results from the ISM non-manufacturing survey and the Markit services survey. Profit taking continued. Nine of the 10 sectors in the S&P lost ground. The Fed's Beige Book was moderately positive but much as expected. On Thursday, equities rebounded somewhat despite a rise in initial jobless claims. Earlier in the day, the European Central Bank raised growth and inflation targets and announced it would start its new government bond-buying program of €60 billion a month on March 9.
Friday, "good news" was "bad news" as related to the jobs report. Stronger-than-expected payroll employment growth was seen as moving forward the Fed's gradual tightening in monetary policy. More traders anticipate "liftoff" for rate increases in June.
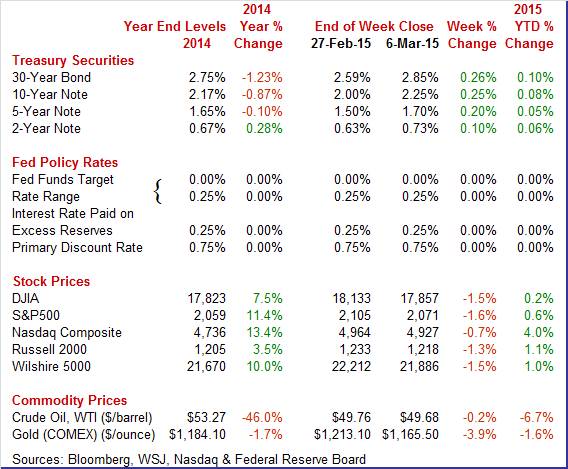
Equities were down this past week. The Dow was down 1.5 percent; the S&P 500, down 1.6 percent; the Nasdaq, down 0.7 percent; the Russell 2000, down 1.3 percent; and the Wilshire 5000, down 1.5 percent.
For the year-to-date, major indexes are up as follows: the Dow, up 0.2 percent; the S&P 500, up 0.6 percent; the Nasdaq, up 4.0 percent; the Russell 2000, up 1.1 percent; and the Wilshire 5000, up 1.0 percent.
Weekly percent change column reflects percent changes for all components except interest rates. Interest rate changes are reflected in simple differences.
 Treasury yields were up sharply this past week. However, notable daily moves occurred only on Monday and Friday. Treasury yields were up sharply this past week. However, notable daily moves occurred only on Monday and Friday.
Monday saw Treasury rates follow corporate rates as strong corporate sales and a boost in stocks (movement of funds to equities) led to weaker prices for Treasuries.
At week's end, it was all about the jobs report and potential Fed reaction. Strong payroll gains and an unexpectedly larger drop in the unemployment rate were seen as moving forward Fed "liftoff" of policy rates.
For this past week Treasury rates were up significantly as follows: the 2-year note, up 10 basis points; the 5-year note, up 20 basis points; the 7-year note, up 23 basis points; the 10-year note, up 25 basis points; and the 30-year bond, up 26 basis points. The 3-month T-bill was unchanged.
 The spot price of West Texas Intermediate was essentially unchanged this past week. The spot price of West Texas Intermediate was essentially unchanged this past week.
The only notable daily swings were Wednesday and Friday. Crude rose just over a dollar a barrel on Monday as stockpiles at Cushing grew slower than expected. WTI gained somewhat more than a dollar a barrel on Friday as the better-than-expected employment report lifted the dollar sharply higher. Internationally, most crude is traded in U.S. dollars.
Net for the week, the spot price for West Texas Intermediate nudged down 8 cents per barrel to settle at $49.68.
The February jobs report released last week was mostly stronger than expected. But some portions of the report were sluggish. Recent numbers on consumer spending have slipped, manufacturing data have been mixed, and construction activity has been on the downside. But the latest employment report offers hope of improvement in consumer and construction sectors but near-term sluggishness in manufacturing.
 The labor market is stronger than believed. Payroll jobs increased 295,000 in February after healthy increases of 239,000 in January and 329,000 in December. Market expectations for February were for a 230,000 increase. The labor market is stronger than believed. Payroll jobs increased 295,000 in February after healthy increases of 239,000 in January and 329,000 in December. Market expectations for February were for a 230,000 increase.
The unemployment rate dipped to 5.5 percent from 5.7 percent in January. Analysts forecast 5.6 percent. The civilian labor force declined 178,000 in February while household employment rose 96,000, and the number of unemployed dropped 274,000.
 The labor force participation rate edged down marginally to 62.8 percent from 62.9 percent in December. The "U-6" underemployment rate was unchanged at 11.3 percent. The labor force participation rate edged down marginally to 62.8 percent from 62.9 percent in December. The "U-6" underemployment rate was unchanged at 11.3 percent.
Turning back to the establishment survey, private payrolls increased 288,000 in February after a 237,000 gain the month before. The median forecast was for 225,000.
 Goods-producing jobs increased 29,000 after a 64,000 boost in January. Manufacturing increased 8,000 after rising 21,000 in January. However, a BLS analyst said that manufacturing is on trend if 6,000 on strike activity are discounted. Still, growth in manufacturing payrolls has been decelerating in recent months. Construction advanced 29,000 in February after gaining 49,000 the month before. Mining declined 9,000 after slipping 6,000 in the month before. The latest numbers indicate that the manufacturing and construction sectors are continuing modest improvement but strength appears to be shifting to construction in the goods-producing sectors. Goods-producing jobs increased 29,000 after a 64,000 boost in January. Manufacturing increased 8,000 after rising 21,000 in January. However, a BLS analyst said that manufacturing is on trend if 6,000 on strike activity are discounted. Still, growth in manufacturing payrolls has been decelerating in recent months. Construction advanced 29,000 in February after gaining 49,000 the month before. Mining declined 9,000 after slipping 6,000 in the month before. The latest numbers indicate that the manufacturing and construction sectors are continuing modest improvement but strength appears to be shifting to construction in the goods-producing sectors.
Private service-providing industries jumped 259,000 after a gain of 173,000 in January. In February, food services and drinking places added 59,000 jobs. In February, employment in health care rose by 24,000. Transportation and warehousing added 19,000 jobs in February and retail trade gained 22,000 jobs.
Government jobs rose by 7,000 in February after a rise of 2,000 the month before.
Average hourly earnings rose 0.1 percent, compared to 0.5 percent in January. Expectations were for a 0.2 percent gain. On a year-ago basis, growth in wages for production workers slowed to 1.6 percent from 2.0 percent in January. For total workers, the year-ago pace for February was 2.0 percent. The average workweek held steady at 34.6 hours, equaling expectations.
Looking ahead to the personal income report from the payroll survey, private aggregate weekly earnings rose 0.3 percent in February pointing to a moderate rise in private wages & salaries. Production worker hours in manufacturing were down 0.2 percent for the month, suggesting a soft manufacturing component for February industrial production.
Overall, the latest employment situation suggests the labor market is gradually gaining strength. The odds of a June rate increase by the Fed have gone up as have odds for "patient" to be removed from FOMC statement guidance later this month. But the soft trend in wage growth could keep the Fed patient even if the word is removed from guidance.
 The January personal income report indicates that attention to detail is required both on the income side and the spending side. The January personal income report indicates that attention to detail is required both on the income side and the spending side.
 In January, personal income was moderately healthy as was spending after price effects are discounted. Personal income posted a gain of 0.3 percent matching the rate in December. The wages & salaries component jumped 0.6 percent, following a rise of 0.1 percent the prior month. However, wages & salaries likely were boosted by increases in minimum wages in some states—an infrequent phenomenon. In January, personal income was moderately healthy as was spending after price effects are discounted. Personal income posted a gain of 0.3 percent matching the rate in December. The wages & salaries component jumped 0.6 percent, following a rise of 0.1 percent the prior month. However, wages & salaries likely were boosted by increases in minimum wages in some states—an infrequent phenomenon.
Personal spending decreased 0.2 percent, following a decline of 0.3 percent in December. Durables slipped 0.1 percent, following a 1.4 percent drop in December-due to sluggish auto sales. Nondurables plunged 2.2 percent in January after decreasing 1.4 percent the month before---with lower gasoline prices pulling this component down. Services advanced 0.5 percent after a 0.2 percent gain in December.
 But weakness in current dollar spending was price related as chain-weighted (price adjusted) personal spending came in at 0.3 percent, following a 0.1 percent dip in December. January actually is a good start for first quarter GDP in the PCE component. But weakness in current dollar spending was price related as chain-weighted (price adjusted) personal spending came in at 0.3 percent, following a 0.1 percent dip in December. January actually is a good start for first quarter GDP in the PCE component.
Prices at the headline level fell again, down 0.5 percent in January after a 0.2 percent dip the month before. The core PCE price index firmed to up 0.1 percent from flat in December. On a year-ago basis, headline inflation eased to 0.2 percent from 0.8 percent in December. The year-ago core rate was steady at 1.3 percent.
Income growth was moderately healthy in January. The consumer sector has fuel for spending-especially in the important wages & salaries component. Inflation is low and well below the Fed's target of 2 percent year-ago inflation.
 Vehicle sales proved soft in February, down 2.6 percent to a 16.2 million annual rate. This is the lowest rate since April 2015 with a pace of 16.0 million units. Vehicle sales proved soft in February, down 2.6 percent to a 16.2 million annual rate. This is the lowest rate since April 2015 with a pace of 16.0 million units.
Weakness in February was centered in North American made vehicles which fell 3.1 percent to a 13.1 million rate, also the lowest since April. Foreign made vehicles nudged down 0.2 percent to 3.1 million.
The latest results point to a third straight decline for the motor vehicle component of the monthly retail sales report. The latest auto sales figures are not encouraging to the manufacturing sector. But the latest jobs report indicates that a mostly improving labor market will provide some support to the auto industry.
 Growth in February slowed in ISM's manufacturing sample where the composite index slipped 6 tenths to 52.9. This is the slowest rate of growth since January last year when the polar vortex was putting a freeze on activity. Growth in February slowed in ISM's manufacturing sample where the composite index slipped 6 tenths to 52.9. This is the slowest rate of growth since January last year when the polar vortex was putting a freeze on activity.
New orders slowed 4 tenths to 52.5 which is the slowest rate of growth since May 2013 while production slowed 2.8 points to 53.7 which is the slowest rate of growth since February last year. Employment slowed 2.7 points to 51.4 for its slowest growth rate since June 2013.
Delivery times rose which contributed positively to the index though this is related not to strength in demand but to labor-related port delays on the West Coast and perhaps heavy weather on the East Coast. The slowing in deliveries added to backlogs and inventories, again offering counter-intuitive signals of strength. Input prices are down for a 4th straight month, reflecting oil effects.
The manufacturing sector has been uneven the last few months in large part due to weak foreign demand. New export orders in today's report fell 1 point to 48.5 to show a 2nd straight month of sub-50 contraction.
While strike activity and adverse weather recently have weighed on manufacturing activity in the U.S., the biggest threats to this sector are likely from overseas—a rising dollar as the Fed prepares to slowly tighten and foreign central banks plan to ease and also softer growth in Europe and China.
The Markit manufacturing PMI picked up noticeably in the last two weeks of February based on Markit's index which rose to a final 55.1 from 54.3 at mid-month and 53.9 in final January. The 0.8 point gain from mid-month implies a roughly 56.0 level for the last two weeks of February.
Strength in Markit's sample group was centered in output and new orders, both of which were rising at 4-month highs. Shipping delays, typically indicative of tie-ups tied to strong demand, were also a positive factor for the index, but in this case the delays were tied to snags not related to demand, that is the West Coast port slowdown and heavy weather on the East Coast. The shipping snags made for a rise in backlogs and a rise in inventories of finished goods.
 The U.S. trade balance for January narrowed on lower oil prices. The U.S. trade balance for January narrowed on lower oil prices.
In January, the U.S. trade gap shrank to $41.8 billion from a revised $45.6 billion in December. Exports fell 2.9 percent after slipping 0.9 percent the month before. Imports dropped 3.9 percent, following a rebound of 1.8 percent in December.
 The narrowing in the overall gap was led by the petroleum gap which came in at $10.7 billion from $14.6 billion in December. The goods excluding petroleum gap narrowed slightly to $53.6 billion from $54.0 billion in December. The narrowing in the overall gap was led by the petroleum gap which came in at $10.7 billion from $14.6 billion in December. The goods excluding petroleum gap narrowed slightly to $53.6 billion from $54.0 billion in December.
The real goods deficit decreased $0.4 billion to $53.6 billion in January.
The services surplus improved to $19.9 billion in January from $19.4 billion the previous month.
The January trade deficit number likely will lead to upward revisions to first quarter GDP estimates.
 Construction activity has been more volatile in recent months—like due to swings in weather. Construction activity has been more volatile in recent months—like due to swings in weather.
Construction outlays declined 1.1 percent in January after gaining 0.8 percent the month before. January was below market expectations which were for a 0.3 percent boost.
January's decrease was led by public outlays which dropped 2.6 percent after rebounding with a 1.7 percent jump in December. Private nonresidential construction spending declined 1.6 percent in January, following a 0.1 percent rise in December. Private residential spending rose 0.6 percent after increasing 0.7 percent in December.
On a year-ago basis, total outlays were up 1.8 percent in January compared to 2.2 percent in December.
The report shows softening in the overall construction sector but gains in the housing component. Increased activity in this subcomponent suggests optimism by homebuilders and perhaps also a shortage in supply of new homes on the market. Early data point to a gain in the residential investment component in first quarter GDP and a decline in the nonresidential component. Importantly, recent gains in construction employment suggest improvement ahead for the construction sector.
 Growth remains very solid in ISM's non-manufacturing sample where the composite index was up 2 tenths to 56.9 in the February report. Employment was a stand-out positive, jumping nearly 5 points to a 4-month high of 56.4. Growth remains very solid in ISM's non-manufacturing sample where the composite index was up 2 tenths to 56.9 in the February report. Employment was a stand-out positive, jumping nearly 5 points to a 4-month high of 56.4.
Not so strong were new orders where growth is down nearly 3 points to 56.7 for the lowest reading since March last year. Nevertheless, this is still a very healthy and sustainable rate of growth.
Supplier deliveries slowed further in February which added to the composite for the month. But the slowing is likely tied, not to demand factors, but to the port slowdown on the West Coast, a slowdown which has since been resolved.
Service sector growth picked up noticeably in February, to a 4-month high of 57.1 versus 54.2 in January. The final reading for February was little changed from the flash estimate of 57.0. Both new business and output are at 4-month highs, reflecting what the report says are stronger customer demand and improving economic conditions.
Employment expansion was described as solid and reflects strong confidence in the business outlook. Cost pressures are dormant with input price inflation, reflecting low fuel costs, unchanged at a 50-month low. Price traction is no more than modest. Markit notes that heavy weather did cause disruptions in the Northeast early in the month but which were reversed by month end.
Overall, strength in the economy appears to be shifting to non-manufacturing sectors.
The Federal Reserve published its Beige Book in preparation for its March 17 and 18 FOMC meeting. It stated that the US economy continued to expand across most of the country. The Beige Book describes the economy as continuing "moderate expansion." Inflation is seen as flat or slightly increasing at most. Consumer spending is up in most Districts. This is a positive as contacts were generally optimistic about near-term sales. Automobile sales rose in most Districts during the reporting period.
Wage pressures are moderate, seen mainly in specialized jobs. Job growth is stable or slightly expanded. Home sales are somewhat up but mixed across Districts.
Manufacturing generally increased since the previous survey, although the rate of growth varied across the Districts and sectors. Residential real estate conditions were mixed across the Districts. Home sales and prices increased in most Districts; construction activity was mixed, with some Districts reporting disruptions due to severe weather.
Some points of concern included the bad weather in the Northeast, the impact of lower oil prices on businesses and the West Coast port dispute that slowed trade.
Overall, the Beige Book indicates only modestly positive growth. Based on the Beige Book, there will be no rush by the Fed to raise rates. However, the latest employment situation report has may have changed the odds on timing.
While the latest jobs report was favorable in most aspects and many expect the Fed to bump up its timetable for "lift-off" of policy rates, there still are question marks. Wage growth is soft and PCE price inflation is negative at the headline level and weak at the core level. At a minimum, the Fed will remain cautious in the near term, likely taking only token steps.
Last week, payroll jobs surprised on the upside and the unemployment rate surprised on the downside. The consumer sector is still carrying the current load for the economy. This week, we get a number of additional readings on the consumer sector. The newly attention getting labor market conditions index is released Monday and it is a broad measure and has been on the soft side. The JOLTS report has been showing only modest growth in job openings. Retail sales declined in January on lower gasoline prices. But consumers are not spending gasoline savings as the core figure was sluggish. Did consumers start spending in February, reflecting job growth and gasoline savings?
The Fed's Labor Market Condition Index is released at 10:00 ET or somewhat thereafter. This index is not from an official release but from an internal report by the Federal Reserve Board of Governors' Research Department. It is tracked by many within the Fed. The Fed's labor market conditions index rose 4.9 points in January, compared to 7.3 points in December. This suggests softer growth—but still growth—in January. February payroll jobs should add lift but wage growth is not very positive.
The bottom line is that the Fed doves will see the labor market as still too sluggish even though improving. With below target inflation and still modest labor market conditions, the Fed will be debating more on when to start edging up policy rates. Fed hawks are concerned about lagged effects of loose policy.
No consensus numbers are available for this month's report
The NFIB Small Business Optimism Index fell back but from the prior month's very strong reading, to a still respectable 97.9 in January from December's 9-year high of 100.4. The economic outlook was by far the weakest component in January with much smaller declines among other components. All told, 7 of 10 components fell back including sales expectations and earnings trends. But there were a couple of positives including inventories, which are considered too low, and current job openings.
NFIB Small Business Optimism Index Consensus Forecast for February 15: 99.0
Range: 96.5 to 100.0
The Labor Department's Job Openings and Labor Turnover Survey showed that there were 5.028 million job openings on the last business day of December, slightly improved from 4.847 million in November. Hires (5.148 million) and separations (4.886 million) were little changed in December. Within separations, the quits rate (1.9 percent) and the layoffs and discharges rate (1.2 percent) were unchanged. There were 5.148 million hires in December, slightly higher than November's 5.054 million. This was the highest level of hires since November 2007. There were 4.9 million total separations in December, little changed from November. This was the highest level of separations since October 2008. The separations rate was 3.5 percent. The number of total separations was little changed for total private and government. There were 2.717 million quits in December, little changed from November.
JOLTS job openings Consensus Forecast for January 15: 5.075 million
Range: 5.025 million to 5.220 million
Wholesale inventories look heavy, rising 0.1 percent in December versus a noticeable 0.4 percent decline in sales at the wholesale level. The mismatch bumped up the stock-to-sales ratio by 1 notch from 1.21 to 1.22 which is the heaviest reading since way back in the troubled days of late 2009. This ratio was at 1.17 through the middle of last year but has since been moving higher. December's unwanted wholesale build was centered in the non-durable component where sales, in contrast to durable goods which rose 1.1 percent, fell 1.7 percent in the month. Here the culprit is petroleum where sales, reflecting both price effects and lower demand, fell 13.7 percent in the month.
Wholesale inventories Consensus Forecast for January 15: +0.1 percent
Range: -0.3 to +0.2 percent
The U.S. Treasury monthly budget report showed a $17.5 billion shortfall for January. Receipts were be up 8.7 percent four months into the Treasury's fiscal year, but outlays, which are the larger side of the ledger, were up 8.3 percent and together make for a 6.2 percent year-on-year rise in the year-to-date deficit, now at $194.2 versus $182.8 billion a year ago. Medicare costs, reflecting Obamacare, were up a year-on-year 9.9 percent so far in this fiscal year with social security outlays up 4.4 percent. Defense was the only component on the outlay side where spending was less than a year ago, down 4.3 percent. Turning to receipts, corporate income taxes were up 35.0 percent year-to-date while individual income taxes, which are a far larger component, were up 8.2 percent. Looking ahead, the month of February typically shows a deficit for the month. Over the past 10 years, the average deficit for the month of February has been $179.5 billion and $214.4 billion over the past 5 years. The February 2014 deficit came in at $193.5 billion.
Treasury Statement Consensus Forecast for February 15: -$188.0 billion
Range: -$202.0 billion to -$178.0 billion
Initial jobless claims rose 7,000 to a much higher-than-expected level of 320,000 in the February 28 week. The increase lifts the 4-week average by a steep 10,250 to 304,750. The average is trending roughly 5,000 higher than a month ago. Continuing claims, which are reported with a 1-week lag, are also moving higher, up 17,000 in data for the February 21 week to 2.421 million. The 4-week average is up 4,000 to a 2.404 million level that is slightly higher than a month ago.
Jobless Claims Consensus Forecast for 3/7/15: 309,000
Range: 292,000 to 320,000
Retail sales in January were pulled down by lower gasoline prices. And consumers are not yet putting higher discretionary income into spending on non-gasoline categories of retail sales even as confidence has improved. Retail sales in January fell 0.8 percent after declining an unrevised 0.9 percent in December. Excluding autos, sales decreased 0.9 percent—the same pace of decline as in December. Auto sales declined 0.5 percent after a drop of 0.8 percent in December. These numbers tracked earlier released unit new auto sales. Excluding both autos and gasoline, sales rose 0.2 percent after no change in December. Gasoline sales swooned a monthly 9.3 percent after dropping 7.4 percent in December.
Retail sales Consensus Forecast for February 15: +0.3 percent
Range: -0.1 to +0.5 percent
Retail sales excluding motor vehicles Consensus Forecast for February 15: +0.5 percent
Range: 0.0 to +0.9 percent
Less motor vehicles & gasoline Consensus Forecast for February 15: +0.5 percent
Range: 0.0 to +0.7 percent
Import prices fell 2.8 percent in January alone for year-on-year contraction of 8.0 percent. And it's much more than just the impact of the strong dollar as export prices are also in contraction, at minus 2.0 percent for the month and minus 5.4 percent on the year. The import price contraction was centered in petroleum where import prices fell a monthly 17.7 percent for year-on-year contraction of 40.1 percent. Excluding petroleum, import prices were still down sharply, at minus 0.7 percent for the month, which is the sharpest drop for this core reading since March 2009, and minus 1.2 percent for the year. Turning to details on export prices, agricultural prices fell 1.2 percent for a year-on-year minus 6.3 percent. Excluding agriculture, export prices are down 2.1 percent, which is the largest drop since November 2008, and down 5.3 percent on the year.
Import prices Consensus Forecast for February 15: +0.2 percent
Range: -1.0 to +0.9 percent
Export prices Consensus Forecast for February 15: -0.1 percent
Range: -0.8 to +0.5 percent
Business inventories rose only 0.1 percent in December but business sales fell a very sharp 0.9 percent for a third straight decline. The inventory-to-sales ratio jumped 2 notches to 1.33 which is the heaviest reading since July 2009. All 3 components showed builds relative to sales especially retailers where inventories of apparel and building materials look heavy. Inventories of autos also look heavy -- especially given the latest contraction in the auto component of the January retail sales report.
Business inventories Consensus Forecast for January 15: +0.1 percent
Range: -0.7 to +0.3 percent
The producer price index for final demand decreased 0.8 percent January after falling 0.2 percent in December. This was the biggest drop for the PPI-FD on record. A sharp drop in energy pulled the headline number down. But weakness was more widespread. Excluding food and energy, producer price inflation slipped 0.1 percent after firming 0.3 percent the month before. The index for final demand goods fell 2.1 percent after dropping 1.1 percent in December. The January decrease was led by prices for final demand energy, which fell a monthly 10.3 percent. The decline in prices for final demand goods was led by the index for gasoline, which dropped 24.0 percent. The index for final demand services eased 0.2 percent after advancing 0.3 percent in December. In January, prices for final demand services less trade declined 0.3 percent after rising 0.1 percent the month before. This was the first decline since falling 0.3 percent in September 2014. In January, a major contributor to the decline in the index for final demand services was prices for outpatient care, which fell 0.7 percent.
PPI-FD Consensus Forecast for February 15: +0.3 percent
Range: +0.1 to +0.7 percent
PPI-FD ex Food & Energy Consensus Forecast for February 15: +0.1 percent
Range: 0.0 to +0.2 percent
PPI-FD ex Food & Energy & Trade Services Consensus Forecast for February 15: +0.1 percent
Range: 0.0 to +0.2 percent
The University of Michigan's consumer sentiment index improved sharply the last two weeks in February as the month's final index of 95.4 was up 1.8 points from the mid-month reading. The final reading points to a roughly 97 pace for the last two weeks which did not show that much slowing from January's final reading of 98.1. The sharpest moves were in the current conditions component which rose to 106.9 from 103.1 at mid-month. This put the pace for the last two weeks in the 109 area which was little changed from January's final reading of 109.3. This component points to steady rates of consumer activity for February compared to January. The expectations component rose 1.5 points from mid-month to 88.0, pointing to a nearly 90 pace over the last two weeks. The final reading for January was 91.0.
Consumer sentiment Consensus Forecast for preliminary March 15: 96.0
Range: 94.5 to 98.0
He can be found on a weekly broadcast talking about the U.S. economy, the easiest way to find him is by going to iTunes and searching for "Simply Economics."
Econoday Senior Writer Mark Pender contributed to this article.
|
